Parsing NASA thermodynamic data using MATLAB
Objective-
-Write a program to read the NASA thermodynamic data and calculate the Specific heat, Enthalpy, Entropy for asked compound or element
-Ploting the temp vs Secific heat ,Enthalpy,Entropy three different garphs.
Program-
%starting of the program
close all
clear all
clc
%Calling an file parsing function
[specific_heat Enthalpy Entropy]=fileparsing('Compund or element name');
%End of the program
Function for File reading for this specific program
function [spec_h enth ent]=fileparsing(compound)
R=8.314; %defining varaible R as universal gas constant
d=fopen('THERMO.dat','r'); %file opening and reading in variable d
ip=compound; %Input for the program
input=string(capitalize(ip)); %Calling an capitalize function to capitalize the compund name as data is in capitals
A=fgetl(d); %Reading first line and storing it in A
B=fgetl(d); %Reading a second line and stroing it in B
B=str2num(B); %As B contains numbers that's why converting the this line to number data
glt=B(1); %These are three temperature values therefore storing them in 3 different variables
gmt=B(2); %glt,gmt,ght are global low, medium and high temperatures respectively
ght=B(3);
temp=linspace(glt,gmt,100); %for calucaltion and lotting purpose storing temperature as array
%Next three lines are comments therefore ignoring them with loop
for i=1:3
H=fgetl(d);
end
%Creating the another loop up to lines in d for reading coefficients for that particular element or compound
for i=1:d
C=fgetl(d); %reading single line at a time from the file and storing it in C in string format
X=split(C,' '); %spliting the string after space to separate the element name from the rest of line
if (X{1}==input) %comparing the first row of splited string to input with conditional statment if
%If the first string of x matches the input string it will execute following commands
for i=1:3 %readint the next three lines from the file and storing in it in D variable
D=fgetl(d);
Z(i,1)=string(D); %storing the each line in different rows in Z variable
end
break; %If it executes the conditional statement fully then it will get out of bigger loop
end
%Converting each line from Z to characters and storing it in a,b,c
a=convertStringsToChars(Z(1));
b=convertStringsToChars(Z(2));
c=convertStringsToChars(Z(3));
%storing the particular range of characters in different variables in as numbers which are co-efficients
a1= str2double(a(1:15));
a2= str2double(a(16:30));
a3= str2double(a(31:45));
a4= str2double(a(46:60));
a5= str2double(a(61:75));
a6= str2double(b(1:15));
a7= str2double(b(16:30));
a8= str2double(b(31:45));
a9= str2double(b(46:60));
a10= str2double(b(61:75));
a11= str2double(c(1:15));
a12= str2double(c(16:30));
a13= str2double(c(31:45));
a14= str2double(c(46:60));
%calling the three functions specific heat, enthalpy and entropy by passing them values of temperature ,universal gas constant, global medium temperature, and generated co-efficients
spec_h=cp(temp,R,gmt,a1,a2,a3,a4,a5,a6,a7,a8,a9,a10,a11,a12,a13,a14);
enth=enthalpy(temp,R,gmt,a1,a2,a3,a4,a5,a6,a7,a8,a9,a10,a11,a12,a13,a14);
ent=entropy(temp,R,gmt,a1,a2,a3,a4,a5,a6,a7,a8,a9,a10,a11,a12,a13,a14);
%Plotting the temperature vs specific heat, enthalpy and entropy individually in three different figures and saving those figures as images
figure(1);
plot(temp,spec_h);
title(input);
xlabel('Temperature');
ylabel('specific heat');
saveas(figure(1),'specific heat.jpg');
figure(2);
plot(temp,enth);
xlabel('Temperature');
ylabel('Enthalpy');
title(input);
saveas(figure(2),'Enthalpy.jpg');
figure(3);
plot(temp,ent);
xlabel('Temperature');
ylabel('Entropy');
title(input);
saveas(figure(3),'Entropy.jpg');
end
Function For capitalizing-
%Function takes the ip as input from file parsing
function [ip]=capitalize(ip)
ip=ip;
% We are creating the loop which will convert the small data to capitals
for h=1:length(ip)
capOut= mlreportgen.utils.capitalizeFirstChar(ip(h));
ip(h)=capOut;
end
Functions for Specific Heat, Enthalpy and Entropy-
All three functions take inputs temperature,Gas_constant,Global medium temperature and coefficients.
In all three functions there is conditional statement if the temperature values is greater than the global medium temperature then, it will use first seven coefficients for calculations and if not then it will use last seven coefficients for calculations.
Specific Heat-
function [Spec_h]=cp(temp,Gas_const,Glob_med_temp,a1,a2,a3,a4,a5,a6,a7,a8,a9,a10,a11,a12,a13,a14)
T=temp;
R=Gas_const;
if (T>=Glob_med_temp)
Spec_h=R*(a1+(a2*T)+(a3.*T.^2)+(a4.*T.^3)+(a5.*T.^4)+(a6.*T.^5)+(a7.*T.^6));
else
Spec_h=R*(a8+(a9*T)+(a10.*T.^2)+(a11.*T.^3)+(a12.*T.^4)+(a13.*T.^5)+(a14.*T.^6));
end
end
Enthalpy
function [enth]=enthalpy(temp,Gas_const,Glob_med_temp,a1,a2,a3,a4,a5,a6,a7,a8,a9,a10,a11,a12,a13,a14)
T=temp;
R=Gas_const;
if (T>=Glob_med_temp)
enth=(a1+(a2.*(T./2))+(a3.*(T.^2./2))+(a4.*(T.^3./2))+(a5.*(T.^4./2))+(a6.*(T.^5./2))+(a7./T)).*(R).*(T);
else
enth=(a1+(a2.*(T./2))+(a3.*(T.^2./2))+(a4.*(T.^3./2))+(a5.*(T.^4./2))+(a6.*(T.^5./2))+(a7./T)).*(R).*(T);
end
end
Entropy-
function [ent]=entropy(temp,Gas_const,Glob_med_temp,a1,a2,a3,a4,a5,a6,a7,a8,a9,a10,a11,a12,a13,a14)
T=temp;
R=Gas_const;
if (T>=Glob_med_temp)
ent=(a1+(a2.*(T./2))+(a3.*(T.^2./2))+(a4.*(T.^3./2))+(a5.*(T.^4./2))+(a6.*(T.^5./2))+(a7./T)).*(R).*(T);
else
ent=((a1.*(log(T)))+(a2.*(T))+(a3.*(T.^2))+(a4.*(T.^3))+(a5.*(T.^4))+(a6.*(T.^5))+(a7)).*(R).*(T);
end
end
Explanation-
Commands Used
fopen - It is used to open and read, write and append the file.
fgetl - This command is used to read single line from the file and can store in variable as string.
split - This command is used to split the string at various instances.
str2num - they are used as to convert the strings to numerical value.
str2double - They are used as to convert the strings to double format.
convertStringsToChars - this is used to convert an string array in individual characters.
saveas - command is used to matlab figures in deifferent file formats.
mlreportgen.utils.capitalizeFirstChar- To capitalize the first character from sentence.
for loop - to generate the single output multiple times to get the desired results or running a sequence of commands multiple times to get the desired results
Conditional statement(if...else..)
This command is used to run the specific intructions only if the conditions are met for that intructions.
- We created the 5 functions to run this particular program to get the desired ouput from the file
-We are giving the elements or compounds as input for the function to get the output as graphs of that elements or compounds to temp vs specific heat, enthalpy, entropy individually.
-We are giving the input commands in case insensative format.
- function calls another function to capitalize the input data as input.
-After that ,we are reading each line from the file and stroing it in particular format, after ignoring some unuseful data we are reading the each line again in loop to match the element or compund in file with input element and compunds using conditional statements.
-If the data matches we are running loops inside the conditional statement three times to get the next three lines which contains thermodynamic coefficients of those elements or compounds
- All these three lines stored in variable and we are converting and storing each coefficient again in different variables.
- Once we extracted all the 14 coefficients from the data we are calling three functions to calculate specific heat, Enthalpy and entropy as mentioned above
-These three will take the inputs of temperature array, global medium temperature , universaal gas constant and 14 co-efficients
-we are storing those values in variables given in function.
-After that we are plotting graphs temp vs specific heat,enthalpy and entropy invidually and saving them as .png file
Results and Conclusions-
-Results and Execution of the function was successfull with proper graphs.
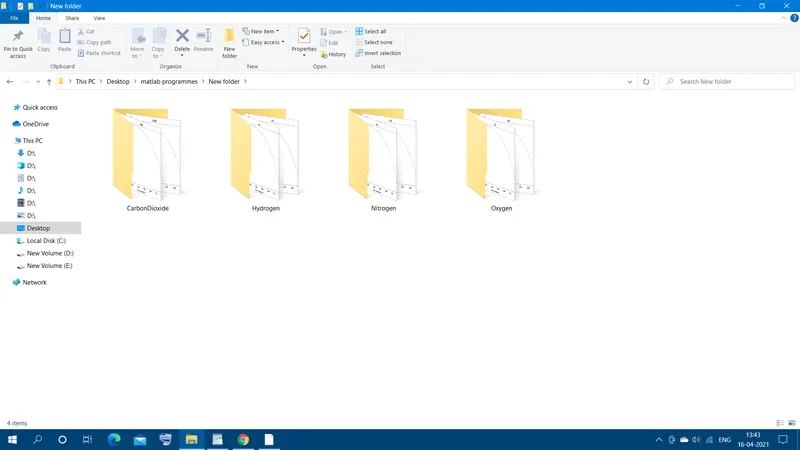
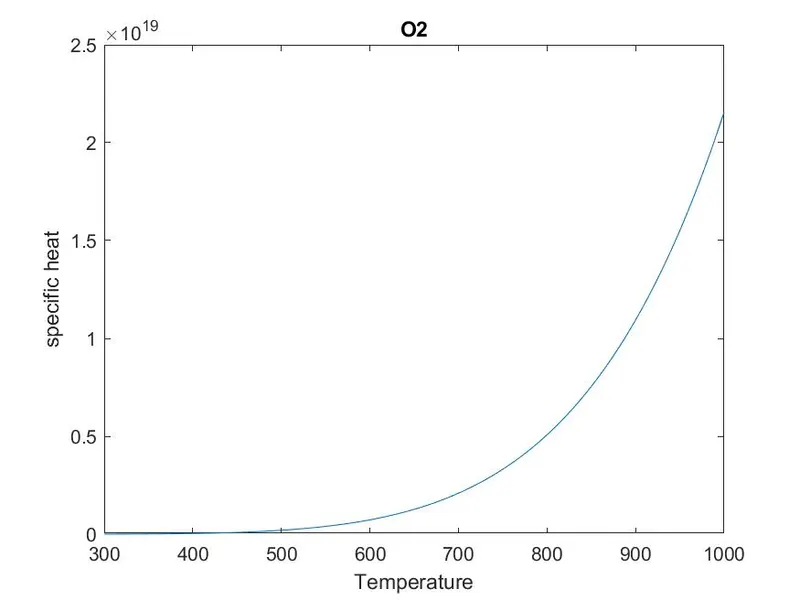
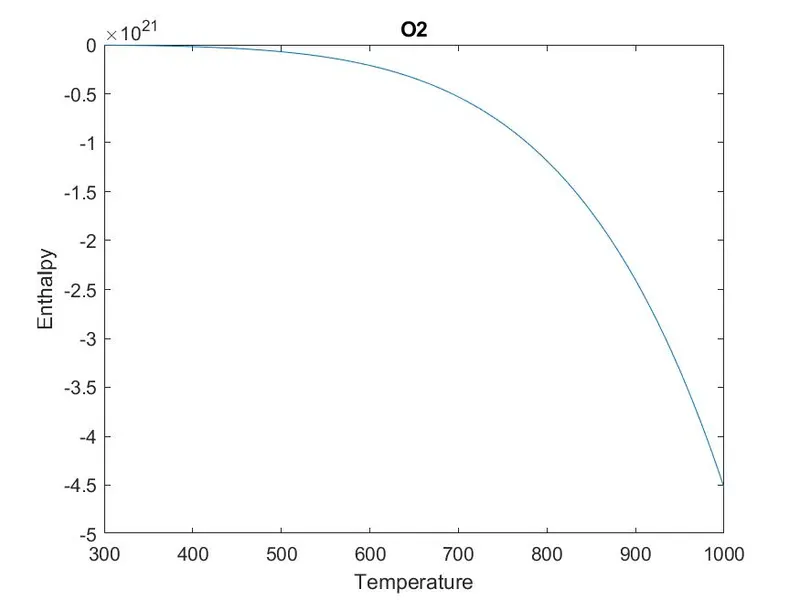
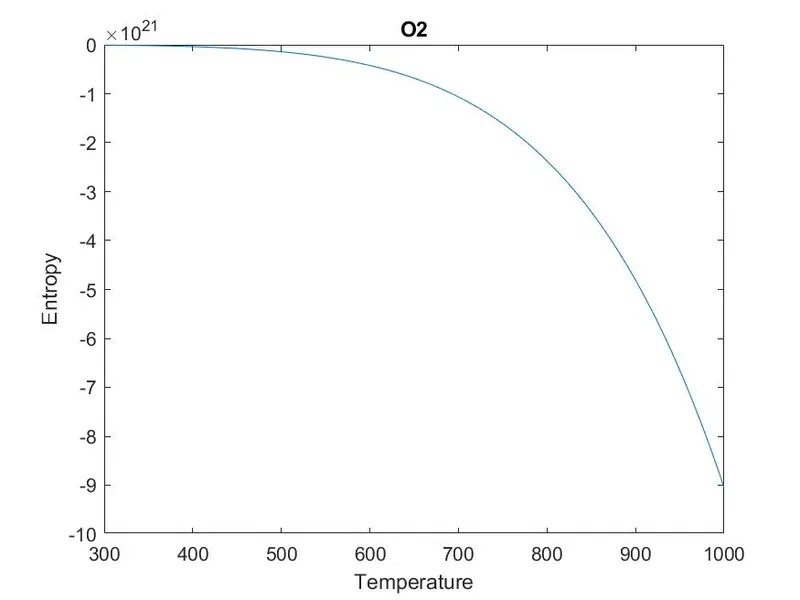
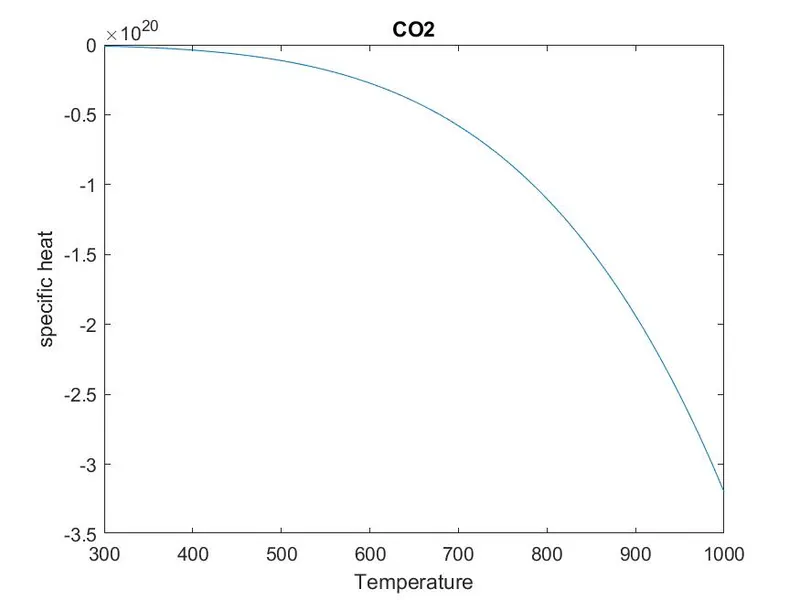
Plots from the Oxygen,Nitrogen and Carbon Dioxide
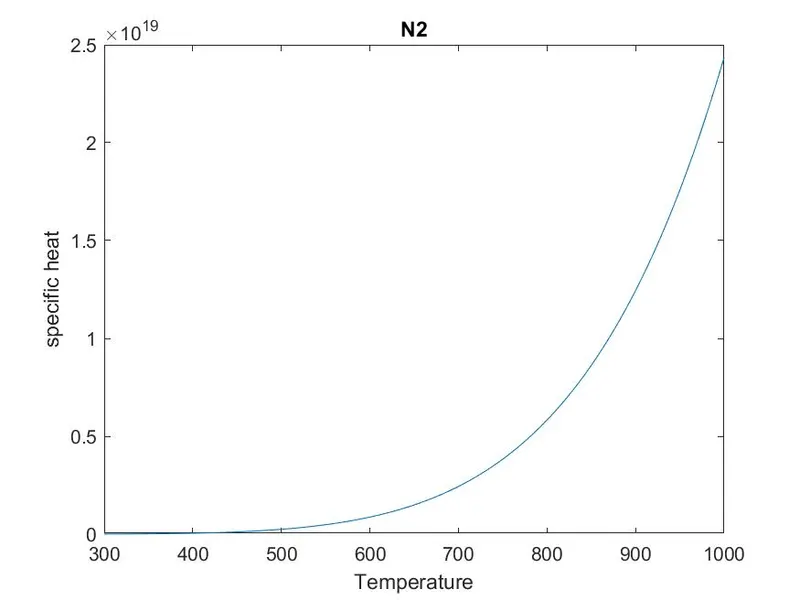
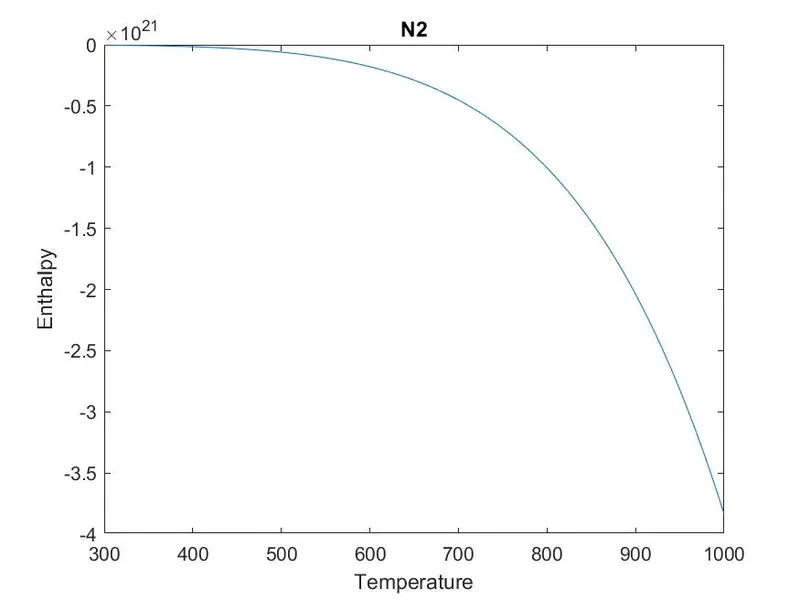
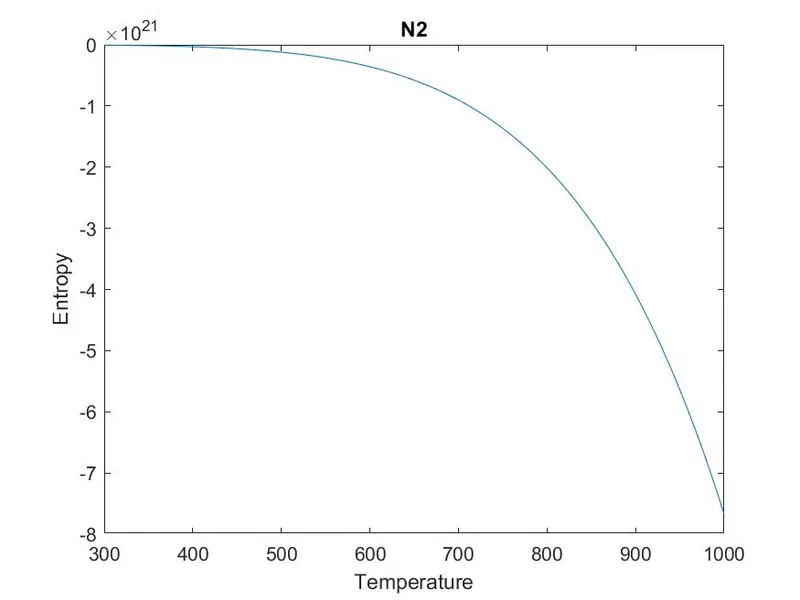
Nitrogen-N2
Specific Heat
Enthalpy
Entropy
Oxygen-O2
Specific Heat
Enthalpy
Entropy
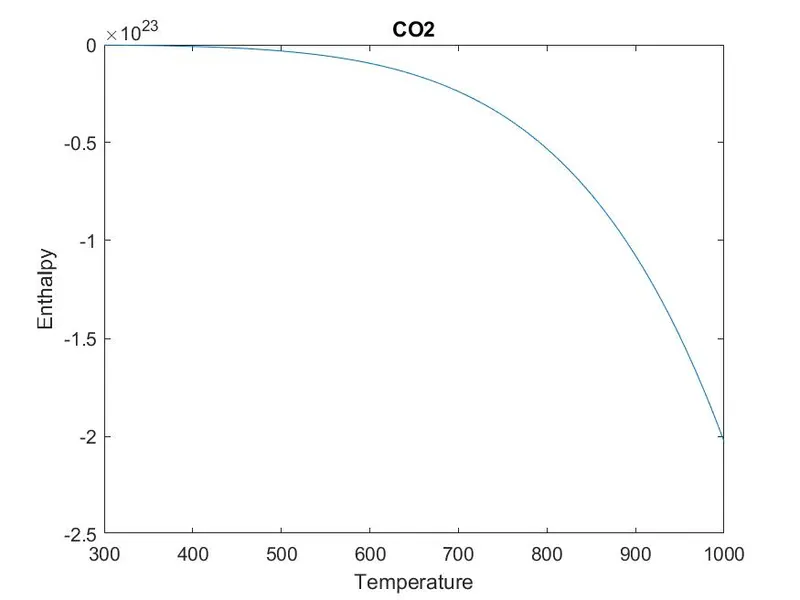
Carbon Dioxide-CO2
Specific Heat
Enthalpy
Entropy
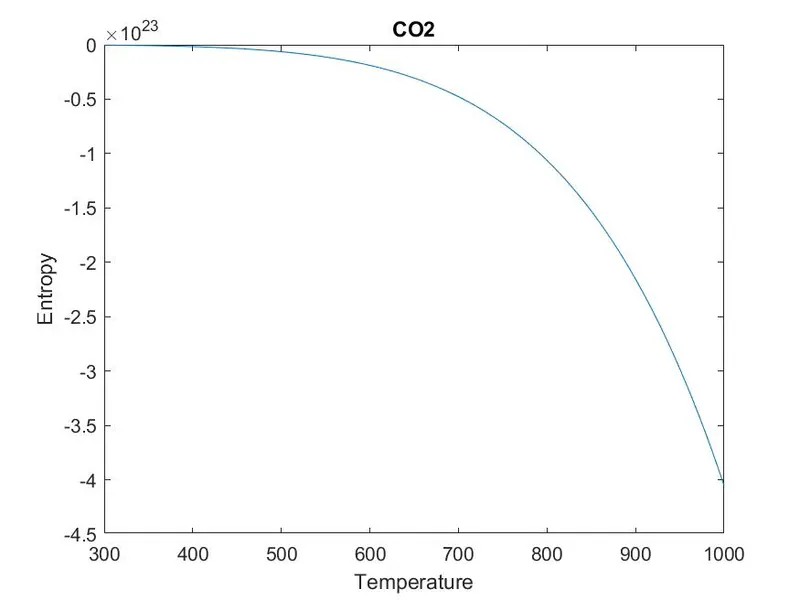
-as we used temperature range from the low temperature to medium temperature from the file we got this result
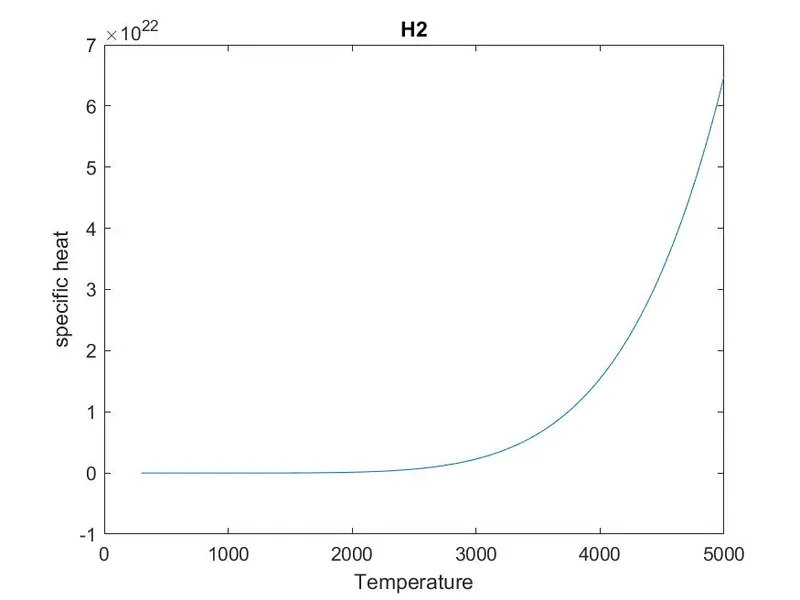
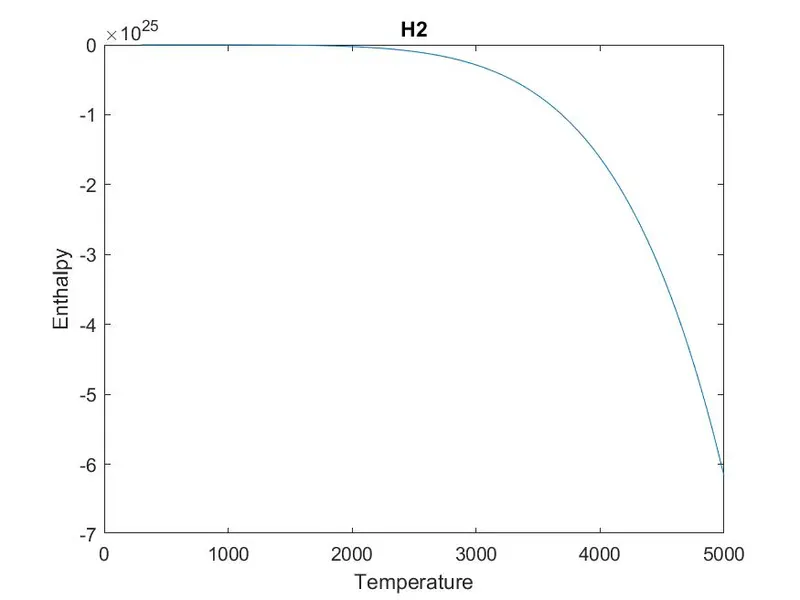
So we added the temperature range from low to high temperature we will get result according to that garphs for them are as follows
Hydrogen-H2
specific heat'
Enthalpy'
Entropy
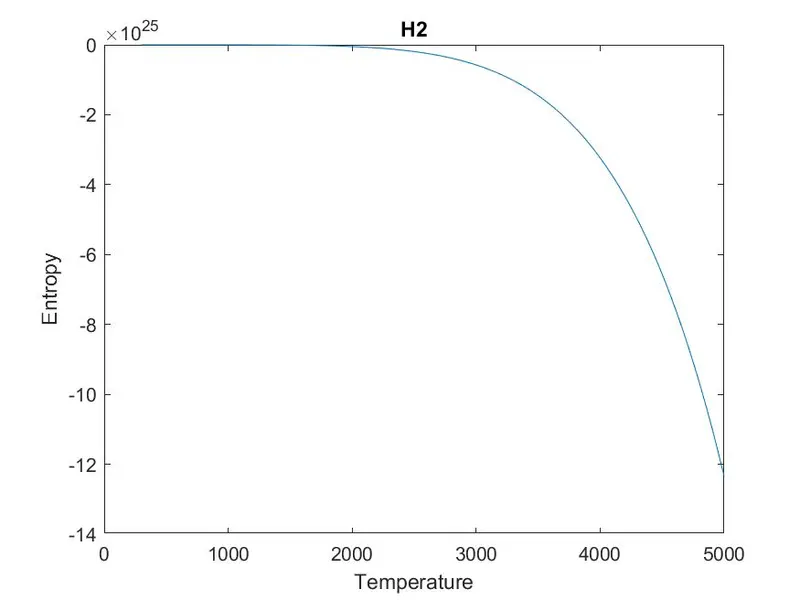
-we can alter the results by changing temperature ranges and by changing them we will get different graph.