Week-4 Challenge WOT Condition Part-2
1.AIM: a)Difference Between mapped and dynamic model of engine, motor and generator.
Mapped Model: The model which uses the Macro statistics (Data is converted into statistics) of two variables of a component into a graph With respect to Base variable.
- It uses look-up table for mapping the data.
Example: Mapped steering
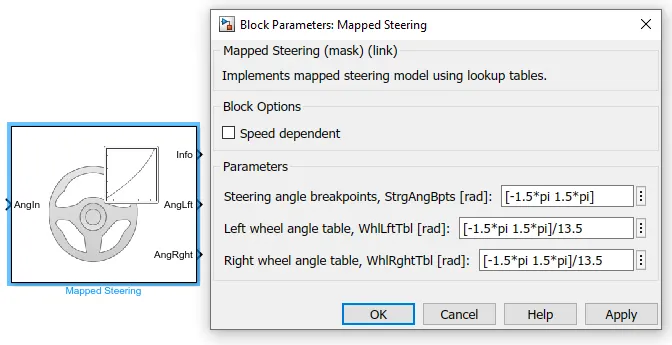
- With Respect to steering angle(base variable) left and Right wheel angles are mapped in a lookup table internally.
- Steering angle acts as input, Left and Right wheel angles are acts as output.
- Both Outputs and inputs data are predefined
Dynamic model:This model uses the Function obtained from input and output and calculate the output according to input given.
- This model requires additional information as constants(coefficients), parameters,Limits and range of component for simulation
- Sample time also to be given for simulation iterations.
- It Requires more time for simulation than mapped model
Dynamic Steering:
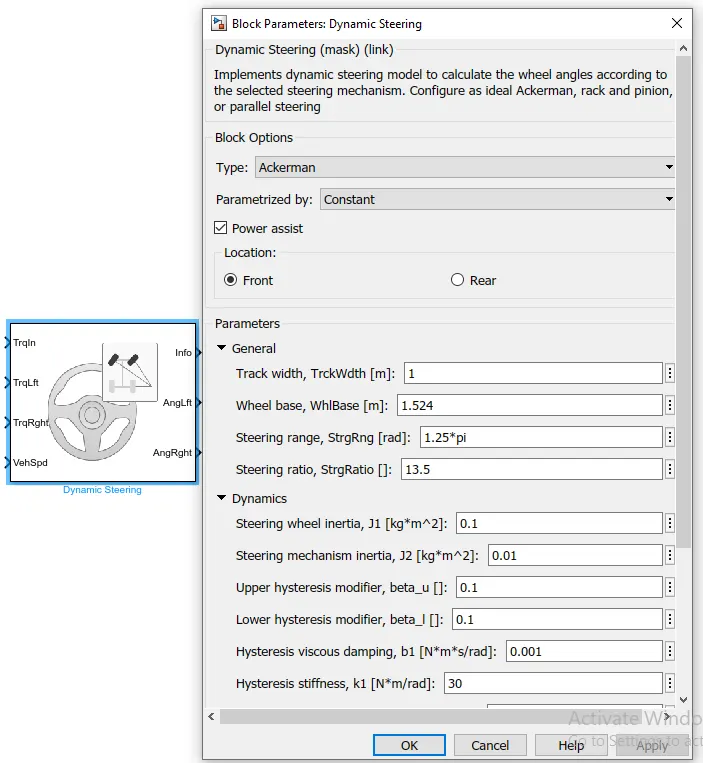
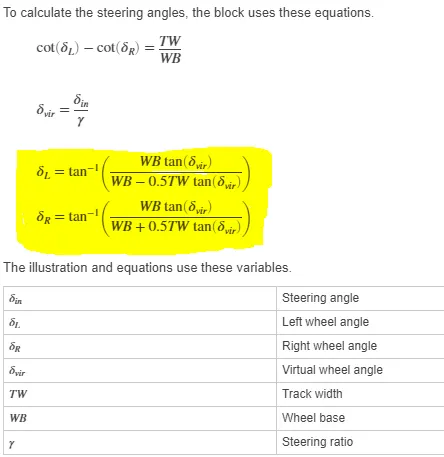
- The Dynamic Steering block implements dynamic steering to calculate the wheel angles for Ackerman, rack-and-pinion, and parallel steering mechanisms. The block uses the steering wheel input torque, right wheel torque, and left wheel torque to calculate the wheel angles. The block uses the vehicle coordinate system.
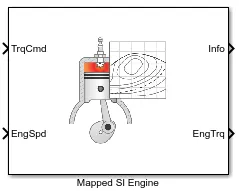
i)Difference Between Mapped and Dynamic Engine Model:
| Mapped SI Engine | Dynamic Engine |
|
2.Engine Speed and Torque data are required to map lookup table. 3.Optional data also can be provide like emission gases, Exhaust air temperature for accurate results. 4.Block is used for:
5.Model uses a set of steady-state lookup tables to characterize engine performance. 6.The tables provide overall engine characteristics, including actual torque, fuel flow rate, BSFC, andengine-out exhaust emissions.If you have engine data from a dynamometer or a design tool like GT-POWER. 7.Mapped Engine used for quasi steady-state engine simulations. |
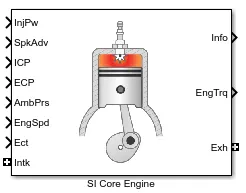
2.The SI Core Engine block calculates:
3.Block is used for:
4.Model decomposes the engine behavior into engine characteristics that are separated into lower-level components. By combining components in this way, the models capture the dynamic effects. 5.It Provides more detailed dynamic model and have component-level data. 6.To analyze the impact of individual engine components on the overall performance. |
ii)Differences Between Mapped and Dynamic Motor/generator model:
| Mapped Motor/Generator | Dynamic Motor/Generator |
|
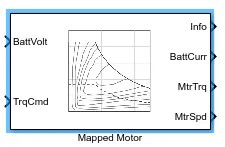
1.The Mapped Motor block implements a mapped motor and drive electronics operating in torque-control mode. 2.The output torque tracks the torque reference demand and includes a motor-response and drive-response time constant. 3.Use the block for fast system-level simulations 4.If We do not know detailed motor parameters, for example, for motor power and torque tradeoff studies. The block assumes that the speed fluctuations due to mechanical load do not affect the motor torque tracking. 5.Data Provided to be:
|
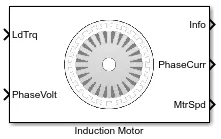
1.This Block uses the three-phase input voltages to regulate the individual phase currents, allowing control of the motor torque or speed. 2.By default, the block sets the Simulation Type parameter to 3.To generate code for fixed-step double- and single-precision targets, considering setting the parameter to 4.The block uses these equations to calculate the electrical speed (ωem) and slip speed (ωslip). `omega_(em)=P*omega_(m)` `omega_(slip)=omega_(syn)-omega_(em)` |
b)changing model from Mapped to Dynamic.
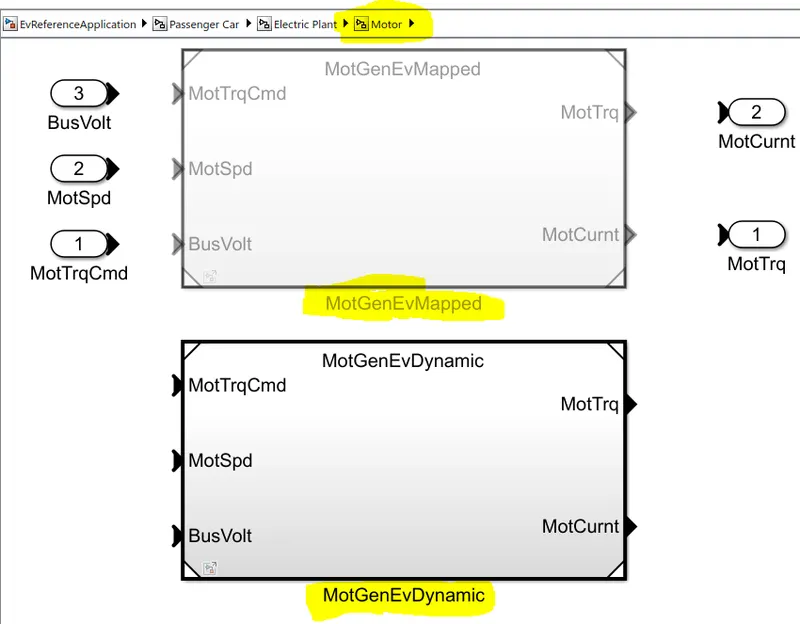
- To change from mapped to dynamic or viceversa to systems should be present in one sub system block called as variant as shown
- Here in Motor variant subsytem both mapped and dynamic models are created.
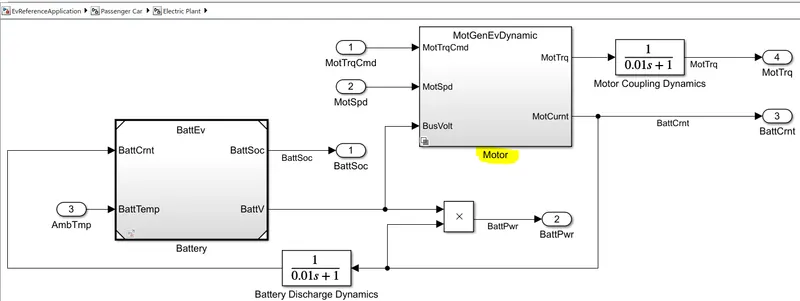
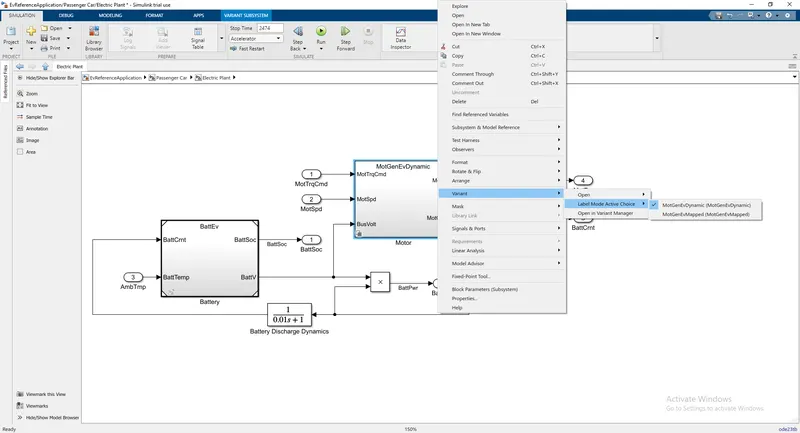
- Right Click on motor subsytem will visualize the different options.
- Click on Variant option then click on Label mode active choice option
- Will shows the mapped and dynamic model option click on one of it required to simulate.
2.AIM:Miles per gallon model for fuel tank and required factors
- `(MILE)/(GALLON)`is defined as Number of miles vehicle runs per gallon fuel. To calculate this in simulink is as follows.
- Here it shows conversion of both `(MILE)/(GALLON)`and `(LITRE)/(100KM)`
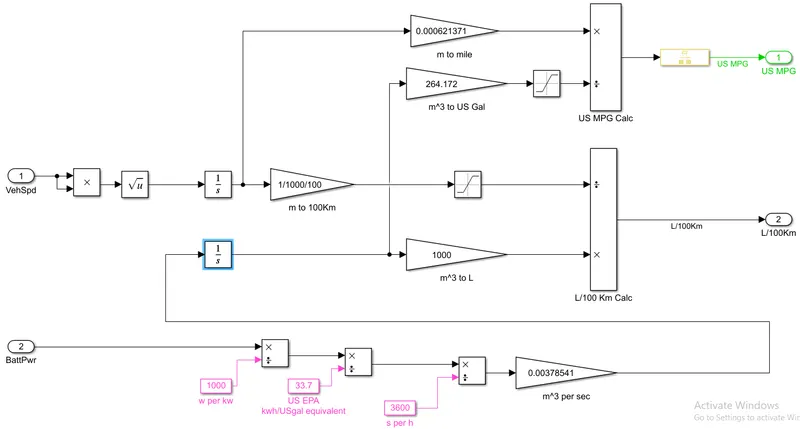
To calculate this we mainly require two factors from HEV vehicle output are
- Velocity in `(meter)/sec`.
- Battery Power in Watts.
To get miles from velocity:
- Velocity(m/s) is integrated with respect to time to get Distance in Meters.
Distance(m)`=int(dv)/dt`
- Meters is converted into miles
1Meter=0.000621371 Miles
By this, we get miles
To get gallons from Power:
- Battery Power(watts) is converted to kilowatts.
1000W=1KW
- KW is converted to gallons/hour.
`(KW)/((33.7KWH)/(gallon))=(gallon)/(hour)`
- `(gallon)/(hour)` is converted to `(gallon)/(sec)`
`(gallon)/(hr)*(hr)/(3600 sec)=(gallon)/sec`
- `(gallon)/(sec)` is converted to `(m^3)/sec`
`(gallon)/(sec)`=0.00378541`*m^3/sec`
- `(m^3)/sec` is integrated with respect to time to convert to `m^3`
- `m^3` is converted to gallon
`1m^3=264.172gallons`
By this we get gallons
- Thus we get miles per gallon by dividing miles with gallons.
3.AIM:Run the HEV ReferenceApplication with WOT drive cycle. Change the grade and wind velocity in the environment block. Comment on the results.
- Run the HEV reference applcation from matlab help and do changes as shown to view required results.
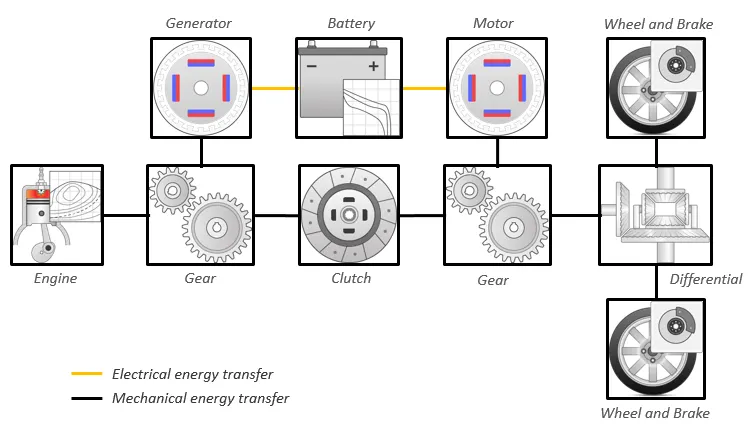
- Vehicle runs through by both battery and engine.
- Battery can be recharged by both engine and motor with generator and Regenerative braking.
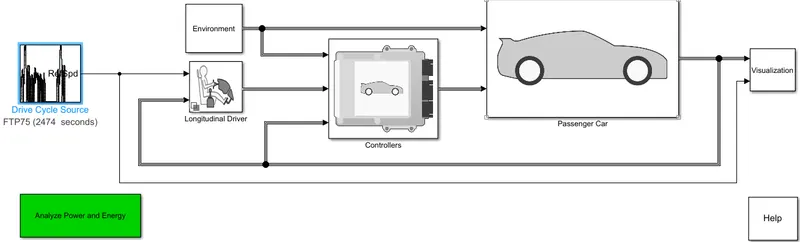
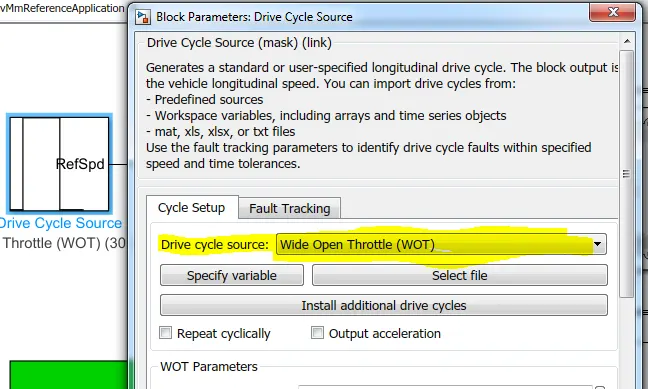
- Click on drive cycle source to change the drive cycle to WOT as shown below.
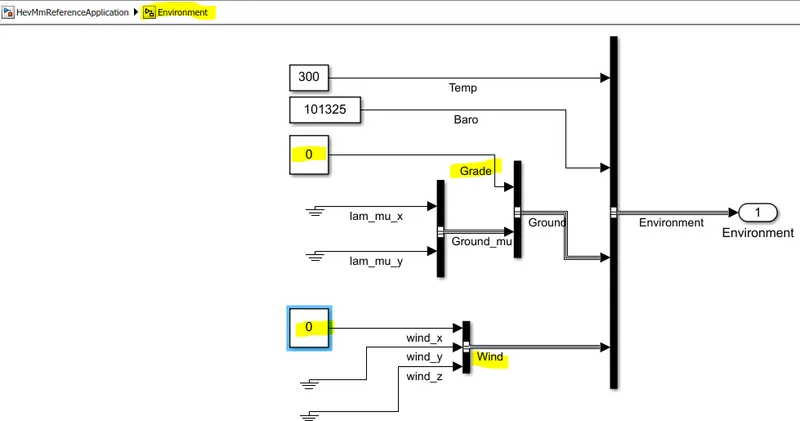
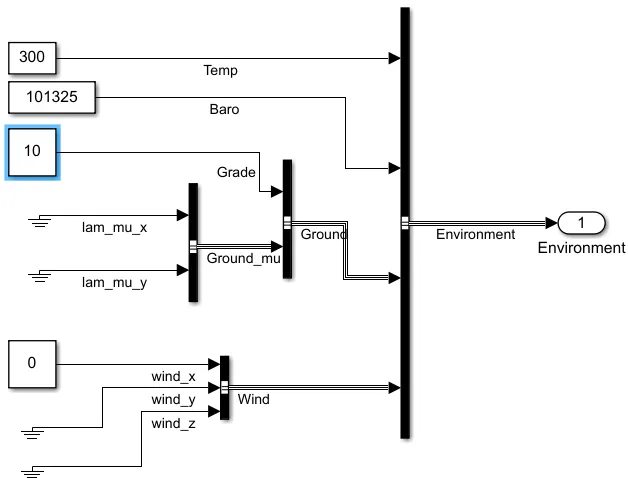
- click on environment block subsytem to make changes in grade and wind velocity values as follows.
Simulation Results:
Case-1: Wind=0, Grade=0
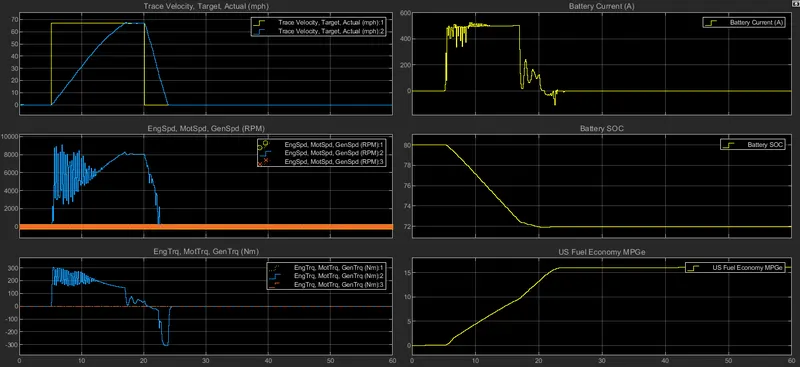
- WOT applied from T=5sec to T=20sec,Speed of vehicle increases gradually and reached to max speed of WOT (60mph) at T=18sec. From T=20sec, Speed decreases gradually and reached to zero at T=25sec.
- Motor speed oscillates from 8000 RPM to 2000RPM due to sudden application of WOT and settles at 8000RPM at T=18sec. From T=20sec speed decreases same as vehicle speed. Thus,Vehicle runs by motor only and both engine and generator are at standstill mode.
- Motor attains max.torque=300Nm and oscillates for 7sec and finally reach to 200Nm at T=15sec and at T=20sec motor torque in negative direction.
- Max Battery current=450A throughout WOT
- Battery SOC starts decreasing from 80% to 72%
- If fuel is consumed instead of battery then fuel consumption is 15 miles per gallon.
Case-2: Wind=0, Grade=10
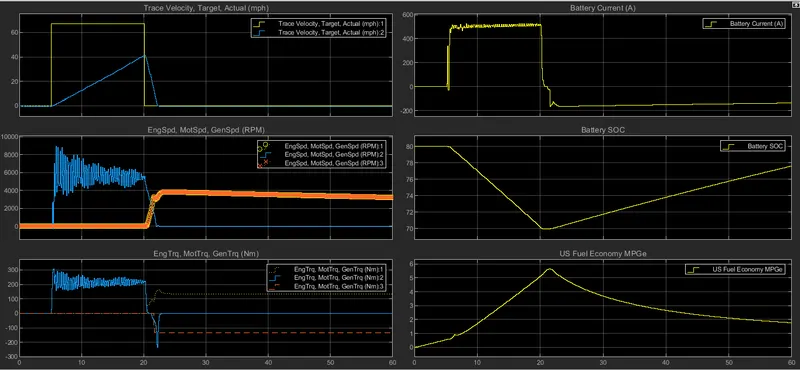
- WOT applied same as case-1 but velocity of vehicle decrease due to grade applied on it.
- Motor completely oscillates through out WOT as vehicle grade force applied simultaneously.
- After completion of grade Motor acts as generator and engine speed is increases.
- motor toque also oscillates completely throughout WOT and runs in negative quadrant after WOT which acts as generator.
- engine torque runs in positive quadrant after WOT.
- Battery current obtained in WOT is 450A. After WOT Current obtain negative quadrant as -200A
- Battery SOC decreased more than Case-1 from 80% to 70% and after WOT battery starts to recharge.
Case-3: wind=10 grade=0
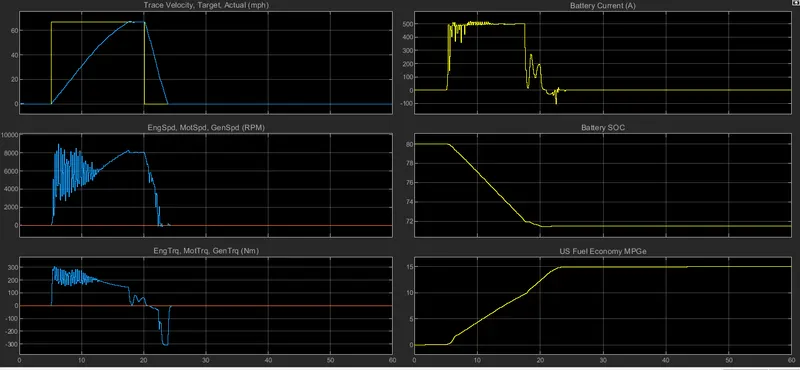
- Similar to case-1, but slight changes in Battery current and SOC are more power is discharged.
- more fluctuations in current due to wind velocity.
Case-4: Grade=10, wind=20
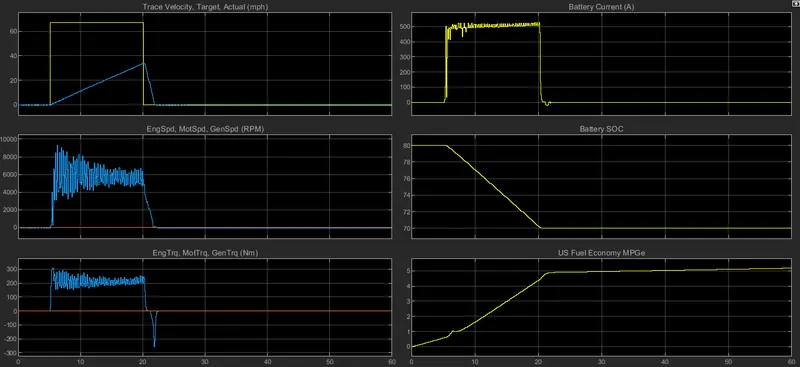
- Due to both grade and wind forces are applied velocity of vehicle decreasesv to 35mph.
- Similar to case-2 but there is no regenerative of battery due to wind force is greater than grade force applied throughout the cycle.
- battery current consumed is 500A in WOT range.
- battery SOC is dropped from 80% to 70%.
- As per fuel cosumption provides 5MPG
- Thus, more battery power and fuel is consumed due to both opposing forces(wind and grade) with less velocity.
Case-5: Grade=15, Wind=10
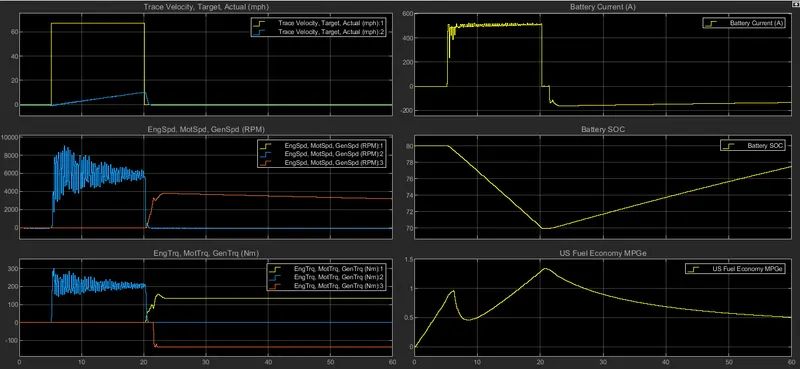
- Similar to case-2, but due to grade force greater than wind force. Regenerative of battery power is obtained.
- Fuel is not linear throughout cycle due to engine supplied power to vehicle and battery, thus more fuel is consumed.
Gases emission:
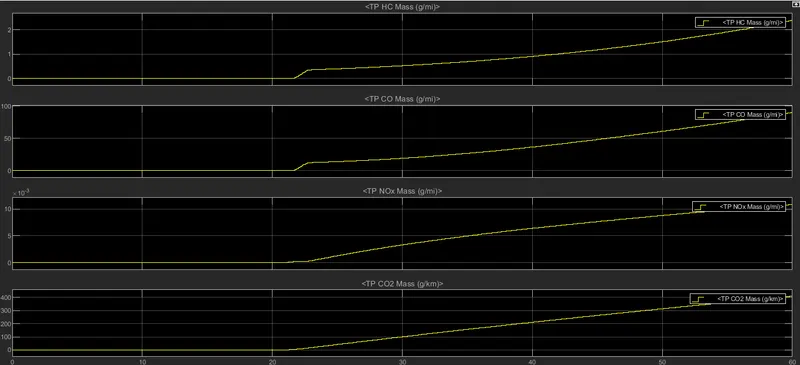
- Gases are emitted according to fuel consumption in vehicle by engine.
4.AIM: Keeping all other parameters same, compare the simulated results of hybrid and pure electric powertrains.
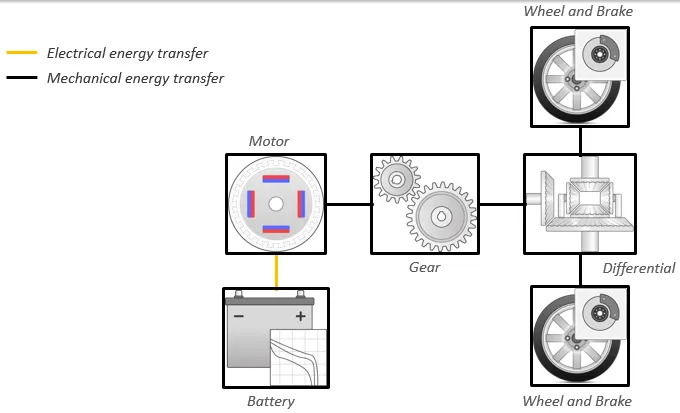
- Vehicle runs only through the battery.
- And battery can be recharged with PLUG-IN or regenerative braking.
SIMULINK Model:
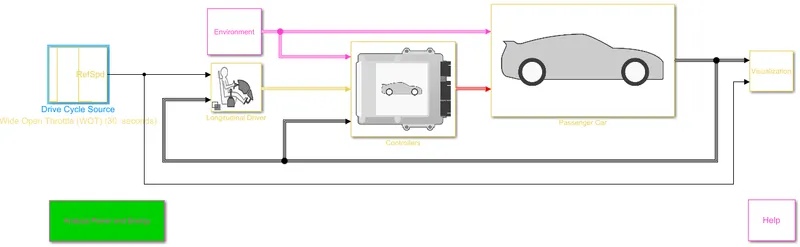
- Changes to made in Drive cycle and application of Grade and Wind velocity are same as HEV.
Case-1: Wind=0,Grade=0
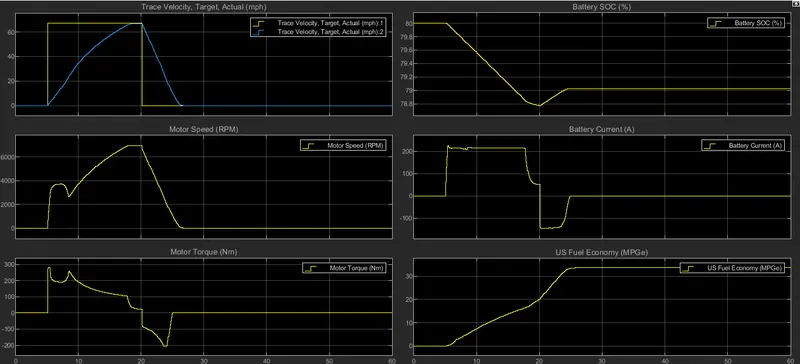
- Velocity is same as HEV and time also same to reach max voltage.
- Starting motor speed is at 4000RPM and linearly increases to its max speed greater than HEV motor speed as its alone run the vehicle.
- Starting motor torque is high and linearly decreases and runs in negative quadrant for some time.
- Battery SOC decreases very less compare to HEV from 80% to 78.8% and finally settles at 79% due to regenerative braking applied after WOT completion.
- Battery current is 200A which is half of HEV current.
- By comparing with fuel consumption it gives more than 30MPG which is double of HEV vehicle.
- Thus, pure EV'S are efficient than HEV.
Case-2: Grade=10,Wind=0
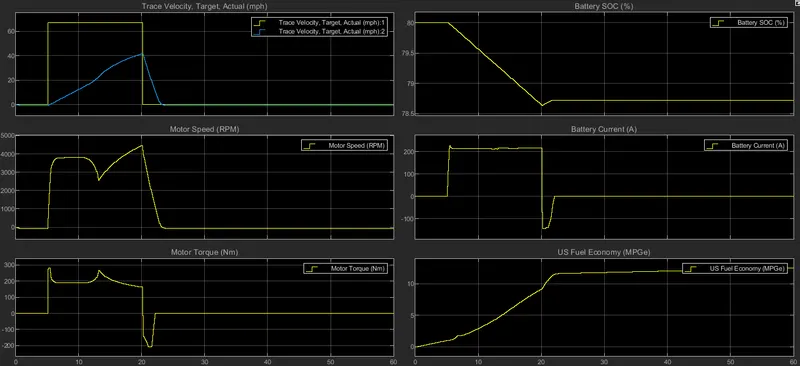
- Velocity of vehicle in pure EV is same as HEV.
- Motor speed and torque are almost same as HEV ,but without any oscillations.
- Battery SOC and Battery current are slightly discharge more than 2% of grade=0.
- Comparing with fuel consumption greatly decreased gives as 12MPG.
Case-3: Grade=15 Wind=10
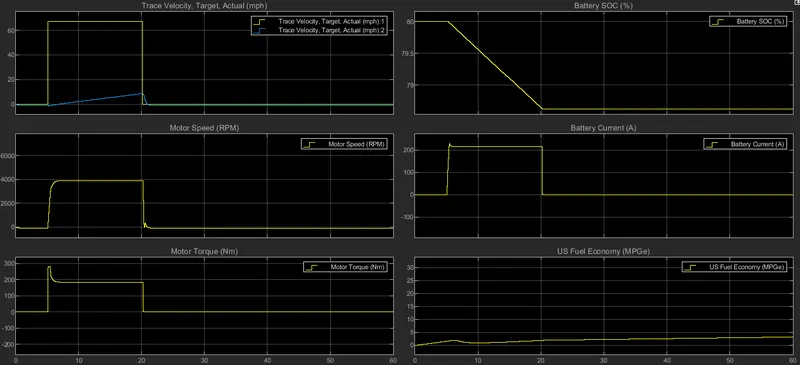
- Vehicle performance in EV is almost same as HEV, But only difference is Motor running speed, torque and battery performance are efficiently working compare to HEV.
- Fuel consumption on application of grade is more.
Conclusion: Pure EVs are more efficient and give great performance compare to HEV.