Week - 4
1.AIM: Plot a Flow chart for Washing machine as per given conditions.
- If the power supply is available, the system gets activated
- If the Water supply is not available, stop the process & indicate through LED
- Soaking time should be 200s followed by Washing time of 100s.
- Then rinsing happens for next 20s & dryer runs for 50s
After all the processes have completed turn on the finished LED.
Procedure: To built a model using Flowchart is giving commands in a chart block Providing input/output ports to it.Then input/output simulink blocks connecting to Chart block.
Chart Block: A Stateflow chart is a graphical representation of a finite state machine.
Library:StateFlow.
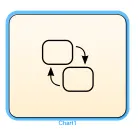
In this,State of a system will be change by providing condition and it is true and if false it will remain in same state. condition will be check throughout simulation running time.
On clicking 'Chart' we will direct to another window as shown below
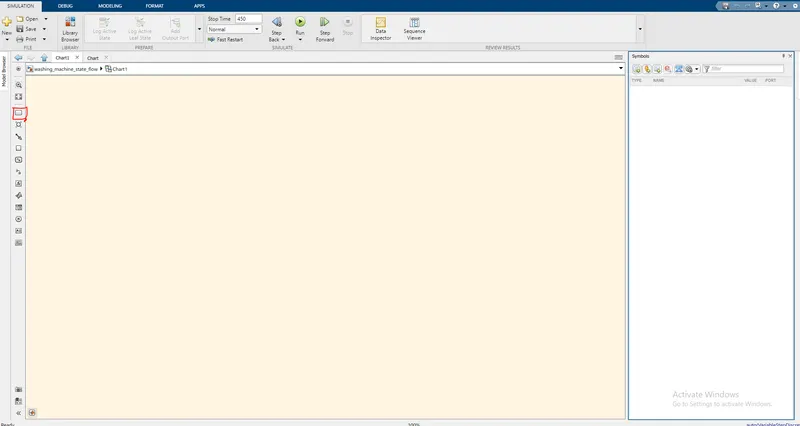
On Chart window Click on 'State' Block and drag to Chart Space.
In this State block commands and inputs are given based on given conditions to the system shown below.
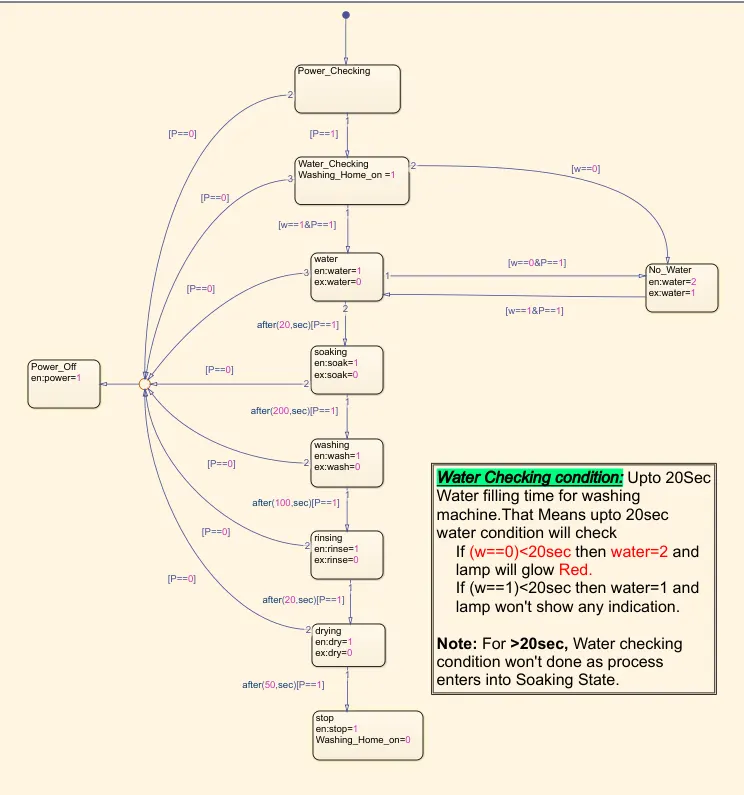
Washing machine process State flow:
Input Ports and Variables:
- 'P & W' are input ports, inputs,conditions and delays are given in between state blocks. As simply define that change from one state to directed state based on given input/condition is true/in given delay time.
Here,P==0 refers Power Off
P==1 refers Power On
W==1 refers Water Available
W==0 refers Water not Available
Each input condition can be checked in every state .
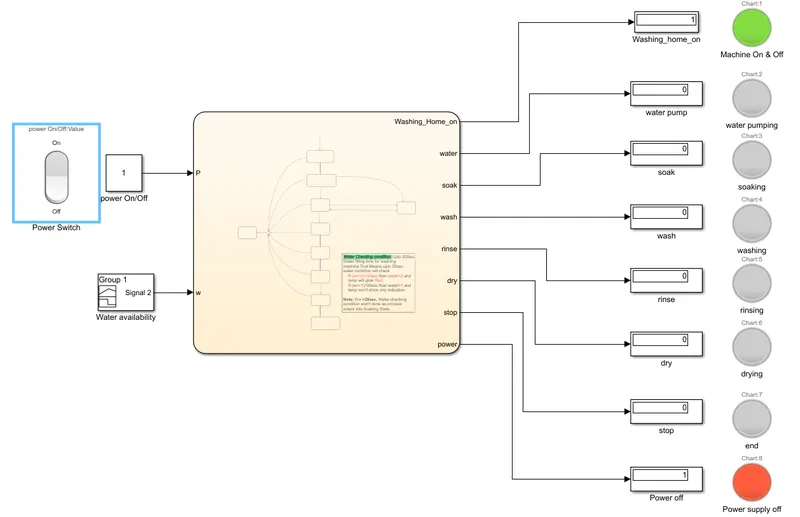
Inputs for State Flow chart are given by Simulink blocks connection with Dashboard blocks shown below.
Output Ports and Variables:
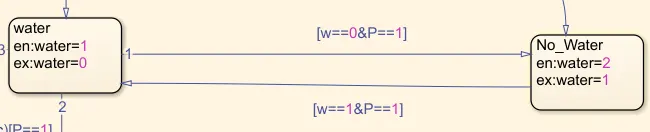
- Output Ports are given inside State block along with numbering for indication of output while entering into state and and exit from the state.
for example, en:water=1, refers system enters into water pumping state and
en:water=2, refers water not available in the system and lamp glows in given colour.
ex:water=0, refers Sytem completed the process and enters into another state based on given condition.
every state output can be declare in another state block by giving that state naming with another numbering as shown in water condition;
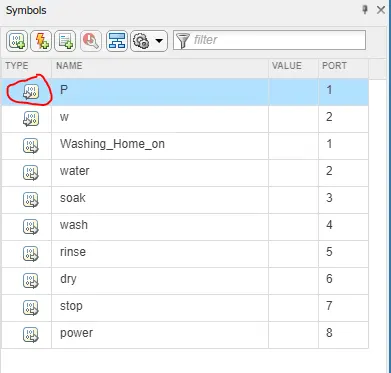
Declaration of all input and output variables in flow chart:
All the inputs and outputs variables are declared in chart by moving to Symbols pane as shown below.
Simulink Flowchart model:
DashBoard Blocks:
Dashboard blocks help you to control and visualize your Stateflow chart during simulation and while your simulation is paused. Dashboard blocks can be used to bind to Stateflow in order to:
-
Monitor Output Data and give input.
To connect a Dashboard block to data or to a Stateflow state, point to the Dashboard block. Above the block, a connect button appears.
Click the Connect button, and navigate to the Simulink block or signal to connect to as shown below
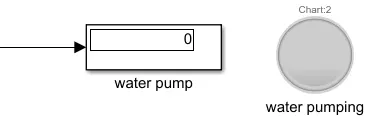
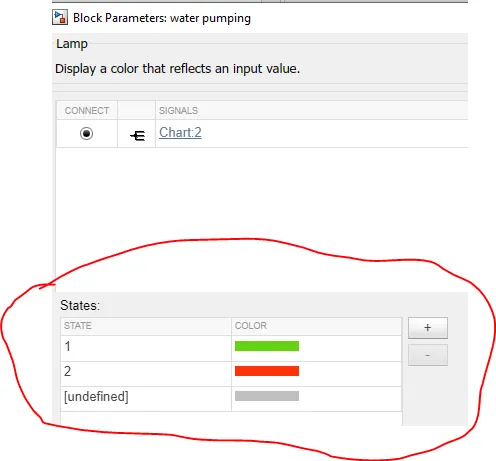
After Connecting to a Signal or Block.Select the state or Transition mode and colour to display the output.
As Per given conditions
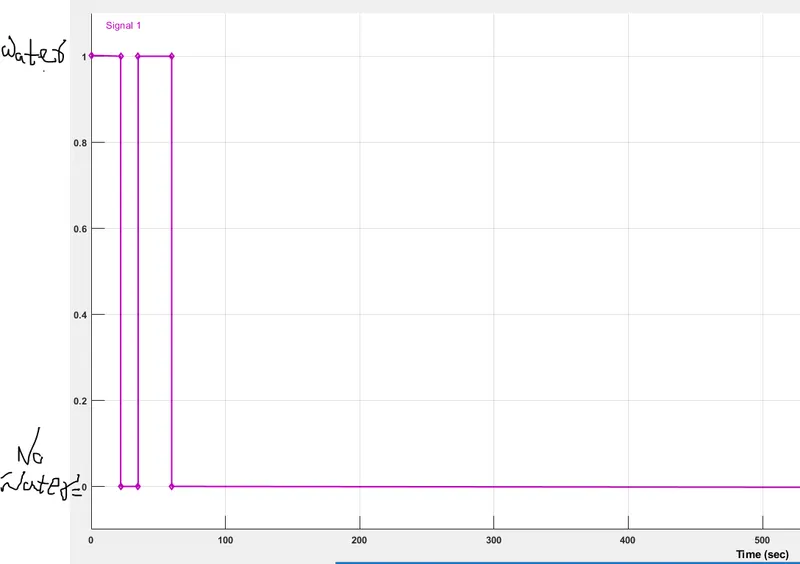
- Water checking condition is checked by signal builder,water will flow upto 20sec in washing machine.If below 20sec water flow is stopped then process will be paused, Water pumping Lamp glows in red and again process will be start from where it is paused and lamp glows green.
- If above 20sec though water level is low process will continue as system enters into soaking state and water pumping lamp doesn't show any indication
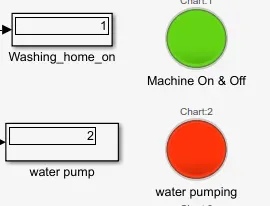
- For Soaking,washing,Rinsing and Drying for every process while running lamp dedicated to that process will glows given to that process and after finishing that lamp will be off.
- At every STATE power condition will be check (P==1) If power off at any state power supply off lamp glows in red colour.
2.Aim: Simulate the chart For "Gear Shift" As per given conditions.
Speed Range(kmph) Gear
0 to 15 1
16 to 25 2
26 to 40 3
41 to 60 4
Above 61 5
As per given conditions flowchart should indicate "as speed increases gear has to be step up and again speed decrease gear has to be step down.
Simulink flowchart:
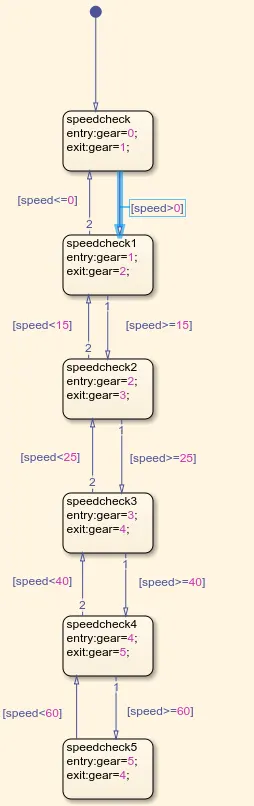
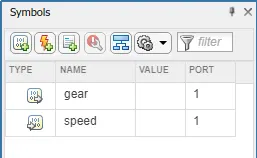
- speed is declared as input variable and gear as output through symbol pane option.
- As per given speed commands are given to speed input.
- Speed will be check at every state and gear number will be given according to it.
Simulink model:
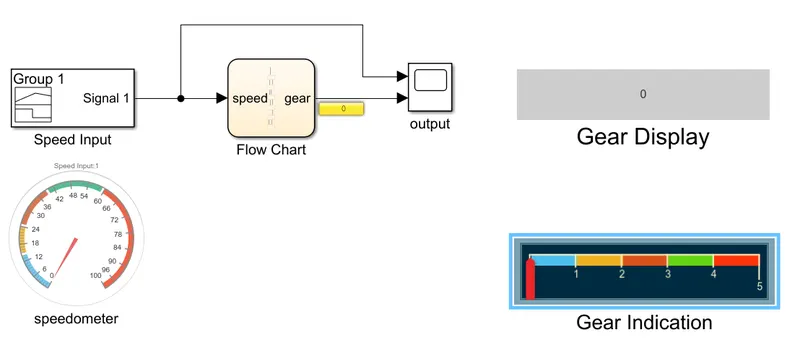
- Speed input is given by signal builder.
Dashboard Blocks:
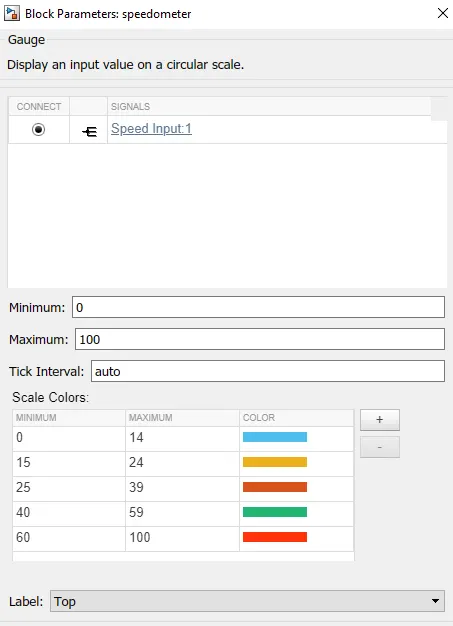
- Full guage block named as Speedometer connected to speed input which shows at what speed system is running and colours also given to it as speed above 60 is RED which indicates Danger/Risky and 41 to 60 as Green which indicates Safe/full efficieny is more.
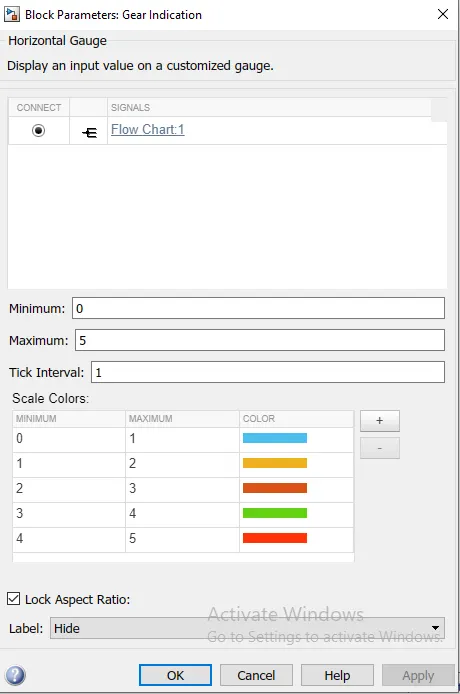
- Display named as Gear Display and Horizantal guage as gear indication connected to output signal to shows the gear number.
- Gear indication colouring also given according to speedometer colouring to knows at what speed range gear has to be kept.