Week-4 Challenge WOT Condition Part-2
AIM:
- What is the difference between mapped and dynamic model of engine, motor and generator? How can you change model type?
- How does the model calculate miles per gallon? Which factors are considered to model fuel flow?
- Run the HEV ReferenceApplication with WOT drive cycle. Change the grade and wind velocity in the environment block. Comment on the results.
- Keeping all other parameters same, compare the simulated results of hybrid and pure electric powertrains.
1)
powertrain blockset:
Powertrain Blockset™ provides fully assembled reference application models of automotive powertrains, including gasoline, diesel, hybrid, and electric systems. It includes a component library for simulating engine subsystems, transmission assemblies, traction motors, battery packs, and controller models.Powertrain Blockset provides a standard model architecture that can be reused throughout the development process. we can use it for design tradeoff analysis and component sizing, control parameter optimization, and hardware-in-the-loop testing. we can customize models by parameterizing components in a reference application with our own data or by replacing a subsystem with our own model.
difference between mapped and dynamic model of engine, motor and generator:
Powertrain Blockset provides two types of combustion engine models: mapped and dynamic. Mapped engines represent macro engine behavior as a set of lookup tables (brake torque, fuel flow, air mass flow, exhaust temperature, efficiency, and emissions) as functions of commanded load and measured engine speed. Dynamic engines decompose engine behavior into individual component models that account for engine dynamics, most notably intake airflow and turbocharger dynamics.
we can switch between engine model types based on your application.
Mapped engine models
1) Mapped engine models are suitable for analysis and design activities that do not require engine subsystem dynamic characteristics, for example, in engine and transmission powertrain matching analysis for fuel economy, emissions, and performance tradeoffs.
2) mapped Model uses a set of steady-state lookup tables to characterize engine performance.
The tables provide overall engine characteristics, including actual torque, fuel flow rate, BSFC, and engine-out exhaust emissions. this model is used if we have engine data from a dynamometer or a design tool like GT-POWER and For quasi steady-state engine simulations.
Dynamic engine models
1) Dynamic engine models are suitable for designing control, estimator, and diagnostic algorithms that depend on dynamic subsystem states, for example, in closed-loop AFR control algorithm development.
2)Model decomposes the engine behavior into engine characteristics that are separated into lower-level components. By combining components in this way, the models capture the dynamic effects. this model is used when we need a more detailed dynamic model and have component-level data and To analyze the impact of individual engine components on the overall performance.
To change the model type:
consider HEV Reference Application model
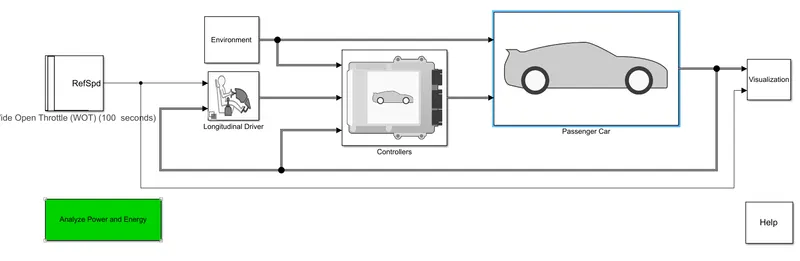
now select passenger car , thus we get this
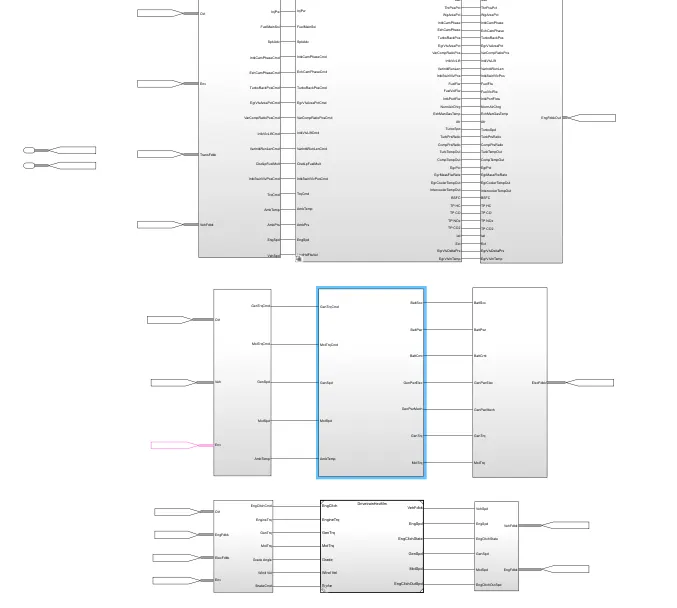
now click the blue highlighted box.
thus we get
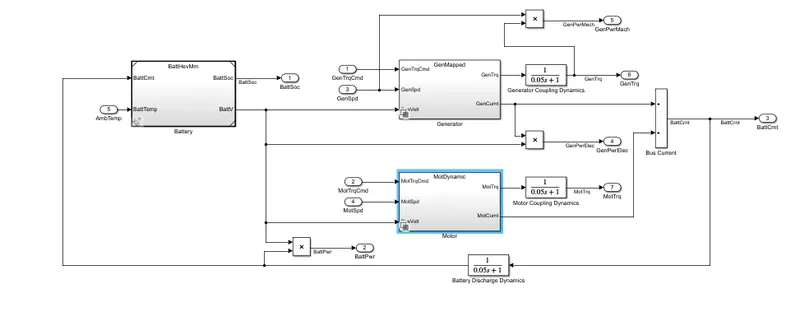
now select blue highlighted motor block
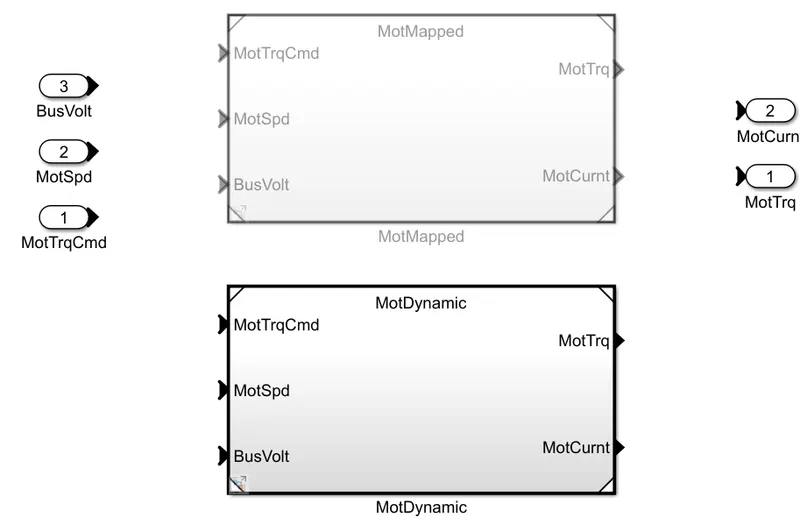
now anywhere on workspace , right click aand then click variant and then label mode active choice and then select whatever required dyanamic or mapped model.
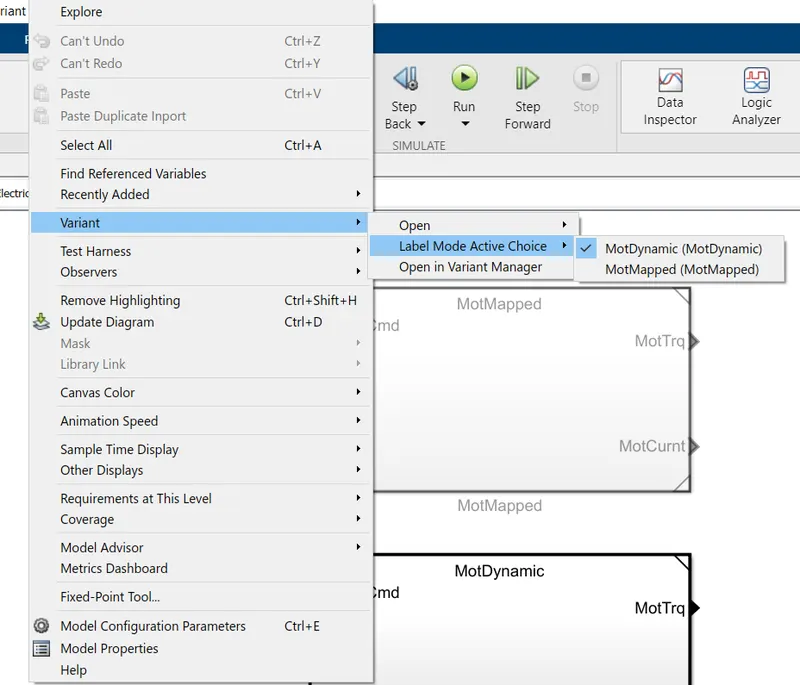
thus the path is

2)
the model for HEV Reference Application is
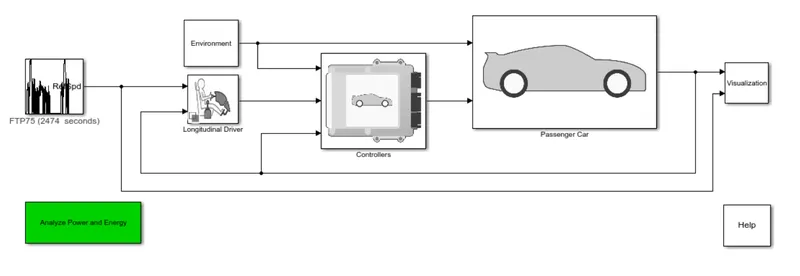
now click on visualization block ,
we get
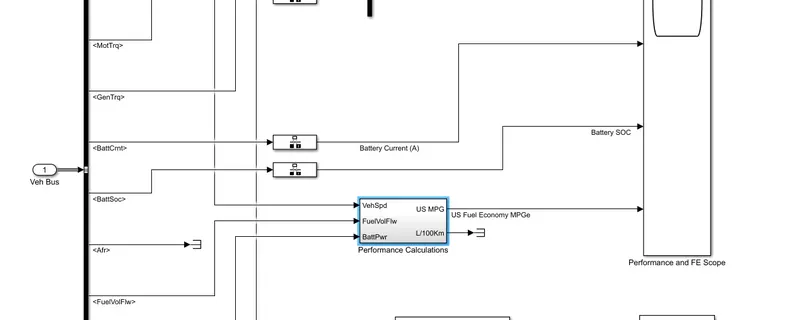
now click on performance calculation block
thus the model in performance calculation block is
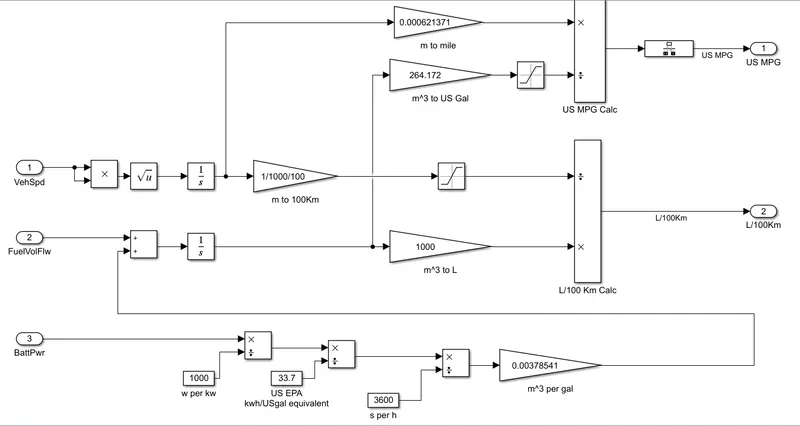
in battery power block , the battery power is converted into watts from kwatts , then US EPA block converts battery to US gallons per hour equivalent. then s per h converts battery power into gallons per second then m^3 per gal block converts to m^3 per gal.
in velocity speed block, integration block is used to get total distance covered , mile to meter block is used to convert meters into miles. the meter^3 to us gal block converts into us gallon and thus we get MPG.
factors considered to model fuel flow are:
1) vehicle speed
2) battery power
3) fuel flow
3)
to open HEV Reference Application model , go to help section of MATLAB and then go to power train blockset and the energy storage option .
thus the HEV Reference Application looks like
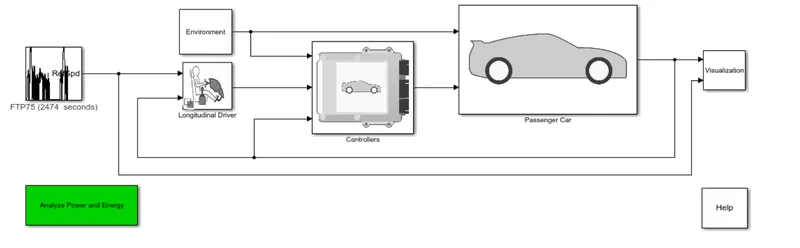
now as we have to operate model on WOT , thus click FTP75 block and select drive cycle as WOT
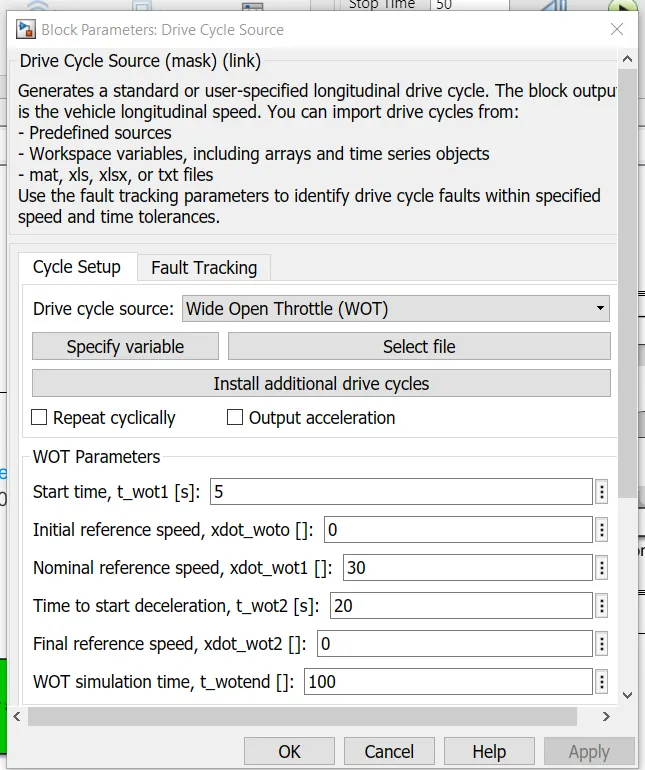
and let us select simulation time as 100 seconds.
thus model looks like
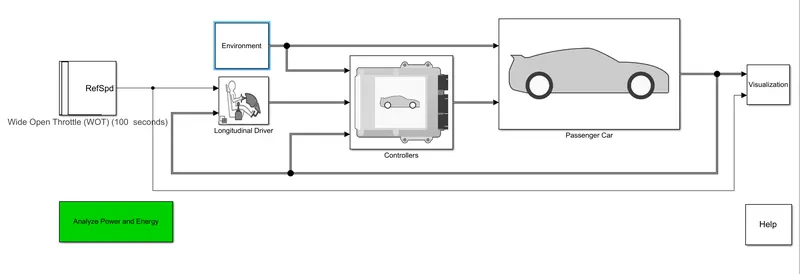
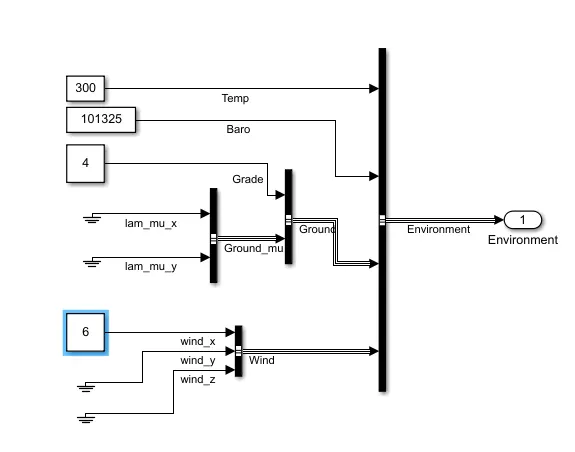
now as per question we have to change the grade and wind velocity in the environment block thus click environment block and change grade as 4 and wind velocity as 6.
now thus the graphs obtained as
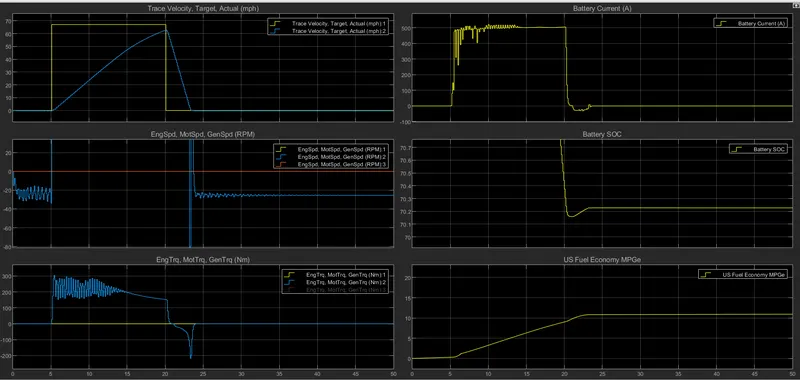
trace velocity , target , actual graph: the yellow graph shows the desired path and the blue line shows the actual path. as blue line didnt go till max yellow line thus we find that power of the battery is not enough to meet the desired requirement of grade and wind velocity.
battery current graph: as vehicle starts from time=5 , the speed of vehicle increases and thus battery current also increases.
at 5 to 20 time , the speed of vehicle is increseing thus battery current have transient at starting and then battery current gets stable at some constant value. after 20 time , the speed of vehicle decreases thus battery current becomes negative . this is called regenerative braking.
SOC graph: at start SOC is 80 and then SOC reamins 80 till time=5 . after time=5 , as battery curent is almost constant thus SOC decreases and after time=20 as speed =0 and thus battery current is negative and thus SOC then will decrease and then remain constant at 70.3.
engine , motor, genrator speed graph:at starting that is at time=0, the motor speed oscillates and at time=5 , the motor speed increases and after time=20 the motor speed is negative because of moment of inertia.
engine , motor , generator torqur graph: a speed varies the motor torque also varies and at time =20 , as speed is negative thus torque is also negative because of moment of inertia.
4)
now consider pure electric powertrain:
model is
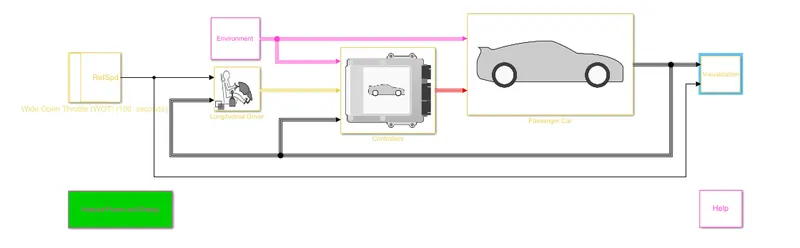
all parameters are kept same as above.
the graphs obtained is
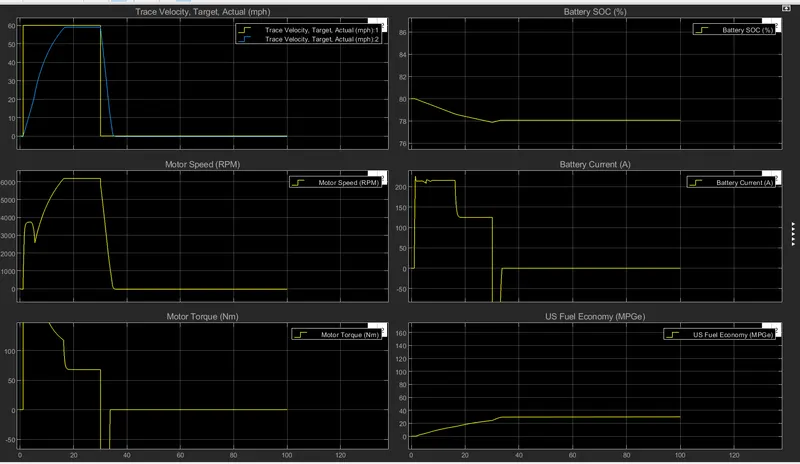
trace velocity graph: yellow line sjows the target and blue line shows the actual graph.
we see that blue and yellow line is meeting nearby at top speed thus the battery power is suficient for the given grade and wind velocity.
battery current graph: the variation of battery current is shown in graph .at time t=25 , the battery current becomes negative .thus regenerative braking occurs and then as motor stops the battery current also becomes zero.
SOC graph:the soc reduces as battery current varies till t=25 and after time=25 as battery current is zero , the SOC remains constant.
motor speed graph: the motor speed varies as shown in graph.
motor torque graph: the motor torque varies as shown . at time =25, the motor torque is in negative direction because of moment of inertia.
CONCLUSION:
Thus the various objectives are achieved.