WOT drive cycle Condition
Objectives:
- What is the difference between mapped and dynamic model of engine, motor and generator? How can you change model type?
- How does the model calculate miles per gallon? Which factors are considered to model fuel flow?
- Run the HEV ReferenceApplication with WOT drive cycle. Change the grade and wind velocity in the environment block. Comment on the results.
- Keeping all other parameters same, compare the simulated results of hybrid and pure electric powertrains.
#1 Difference between mapped and dynamic model of engine, motor and generator? How can you change model type?
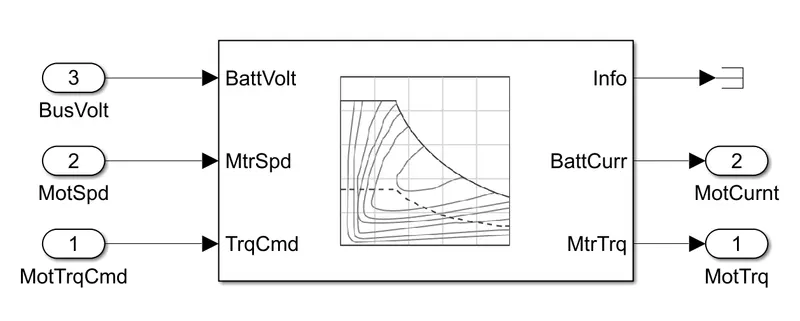
Mapped Models:
- Model uses a set of steady-state lookup tables to characterize engine performance.
- The tables provide overall engine characteristics, including actual torque, fuel flow rate, BSFC, and engine-out exhaust emissions.
- For quasi steady-state engine simulations.
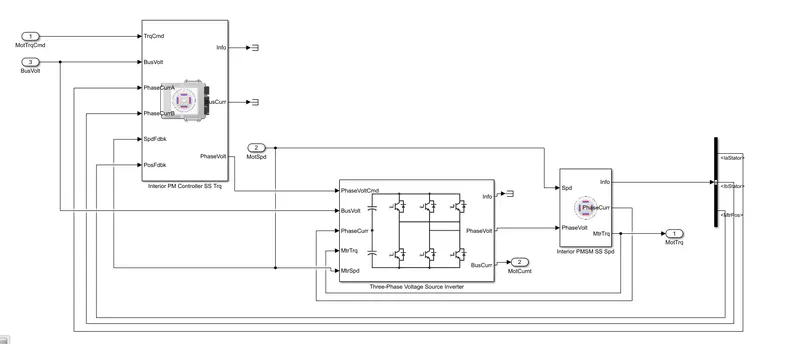
Dynamic Models:
- Model decomposes the engine behavior into engine characteristics that are separated into lower-level components. By combining components in this way, the models capture the dynamic effects.
- it gives a more detailed dynamic model and have component-level data.
- To analyze the impact of individual engine components on the overall performance.
- it takes more time to analyse as all the induvidual components systems will be running.
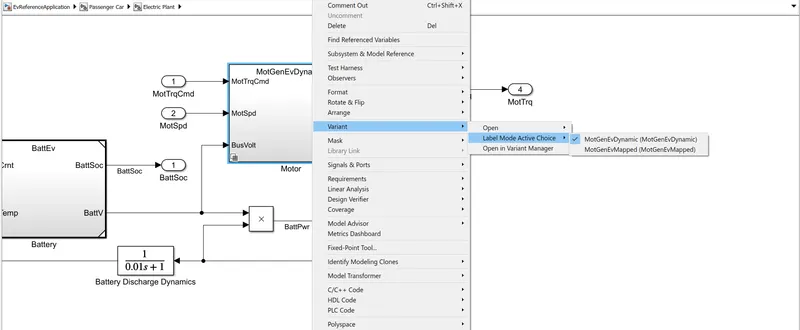
Steps to change the model type:
- In powertrain blockset module and load the required vehicel model (Full Electric, Full IC engine, Any configuration of hybrid vehice)
- After the simulink model is loaded, with all the blocks loaded.
- In that we need to go to Passenger car -> Electric Plant.
- Right on the Engine/Motor/Generator block. Then, In variant -> Label Mode Active Choice -> select the required configuration.
#2 How does the model calculate miles per gallon? Which factors are considered to model fuel flow?
Calculating Miles per Gallon: 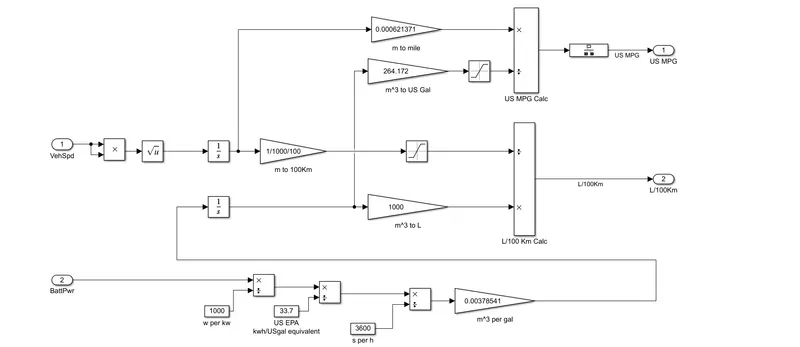
- The above figure shows the model used to model calculates miles per gallon. This model can be found in the "Visualization Block" of the Model and in the "Visulization Block" click on the "Performance Calculation" block.
- The factors that are considred for calculation are Vehicle Speed, Fuel Volume Flow and Batter power.
- Working of model:
- First, the velocity of the vehicle is converted into distance by integrating. The obtained distance is converted to the repective units either miles or km.
- Similarly battery power is converted into kW, then a factor is used to convert kwh to US gal equivalent, sec are converted to hr. As it is flow rate, it is integrated to the volume of fuel consumed overtime.
- Now the distance and volume of fuel is divided to get the performance results either in miles per gallon and liters/100km.
- The factors that are considred for calculation are Vehicle Speed, Volumetric Flow Rate and Batter Power.
#3 Run the HEV ReferenceApplication with WOT drive cycle. Change the grade and wind velocity in the environment block. Comment on the results.
HEV Powertrain configuration:
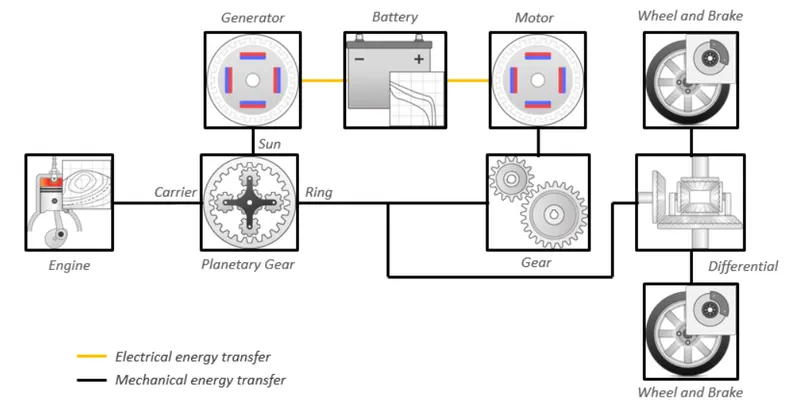
HEV Blockset:
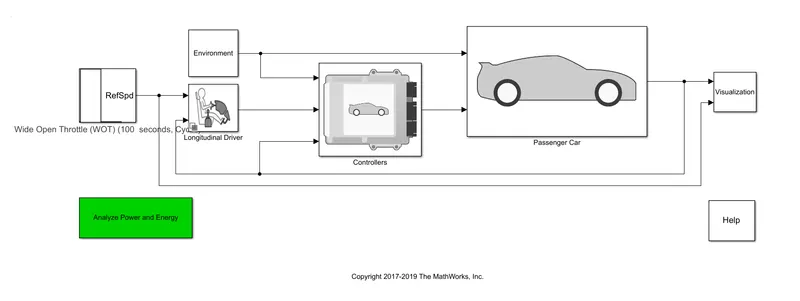
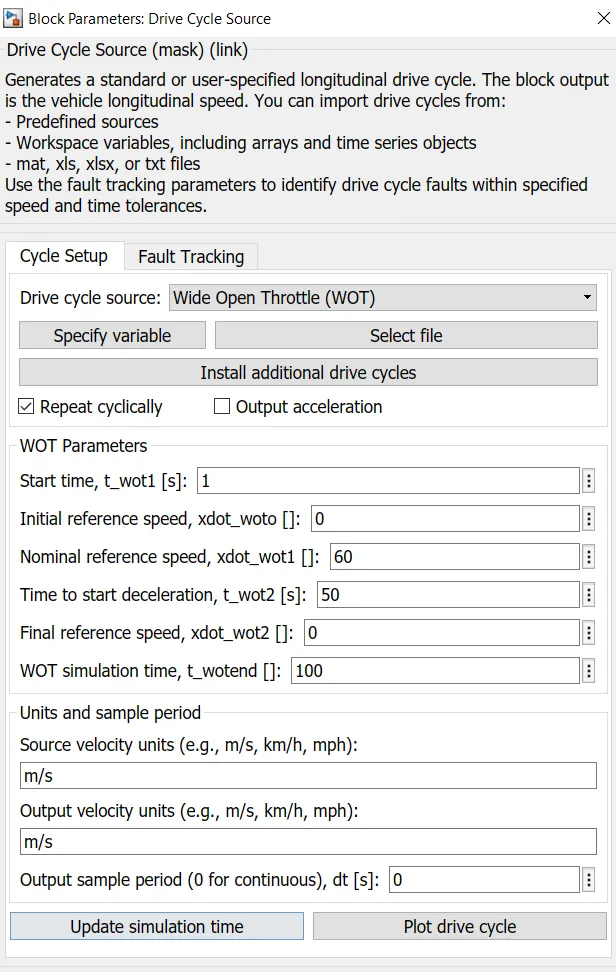
Drive Cycle: WOT
Case 1: (0 deg gradient, and 0 m/s wind velocity):
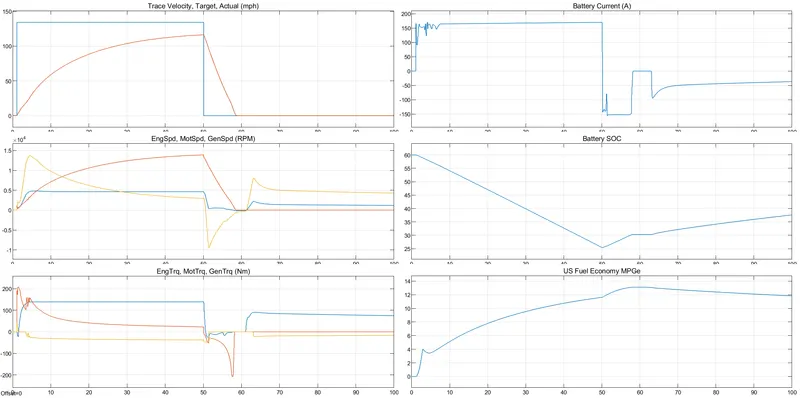
Plot 1:
- Blue line: Reference Velocity
- Orange line: Vehicle Velocity
Plot 2 &3:
- Blue Line: Engine Parameter
- Orange Line: Motor Parameter
- Yellow line: Genarator Parameter
Case 1: (10 deg gradient, and 5 m/s wind velocity):
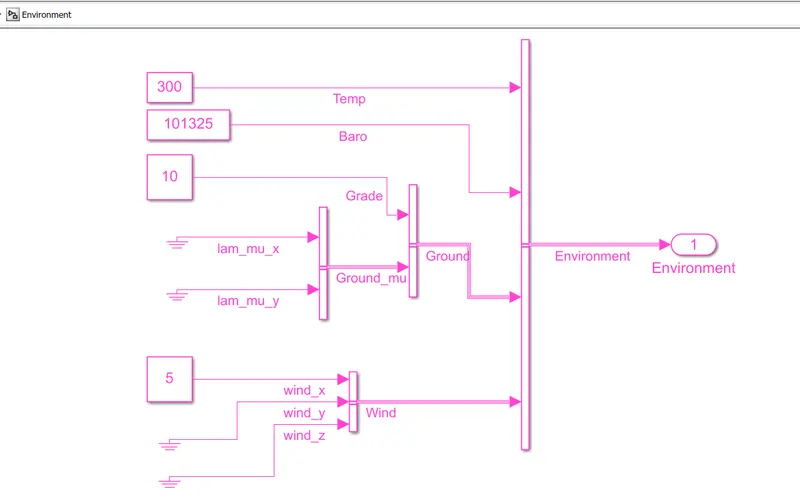
Changing the parameters in Environment Parameters:
Output:
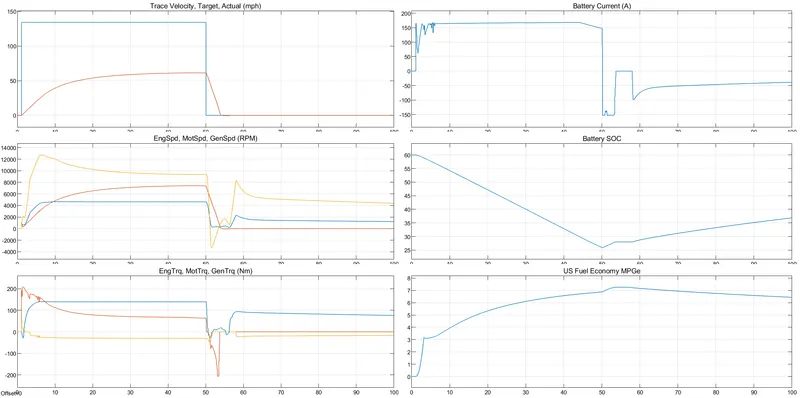
Plot 1:
- Blue line: Reference Velocity
- Orange line: Vehicle Velocity
Plot 2 &3:
- Blue Line: Engine Parameter
- Orange Line: Motor Parameter
- Yellow line: Genarator Parameter
Comparision:
| Case 1 | No gradient, No Air velocity | ||
| Case 2 | 10 deg gradient, 5m/s Air velocity | ||
| Case 1 | Case 2 | ||
| Grade (deg) | 0 | 10 | |
| Air Velocity (m/sec) | 0 | 5 | |
| Max Speed (mph) | 116 | 61.2 | |
| Peak Engine Torque (Nm) | 139 | 139 | |
| Peak Motor Torque (Nm) | 204 | 207 | |
| Max Current drawn from battery (A) | 169 | 168 | |
| Battery SOC (%) | 60%-25% | 60%-20% | |
| Fuel Economy (MPG) | 13 | 7.26 | |
Conclusion:
- There is a significant drop in top speed of the vehicle due to gradient and wind speed from 116 mph to 61.2 mph.
- The reason for the vehicle to not reach the reference velocity is due to the limitation of power the electrical enery source.
- As more power is required in second case, both Battery SOC and Fuel Economy Drop by the end of the simulation.
#4 Keeping all other parameters same, compare the simulated results of hybrid and pure electric powertrains:
Hybrid Power Train: Same as the previous model (#3 Model)
Pure Electric Power Train:
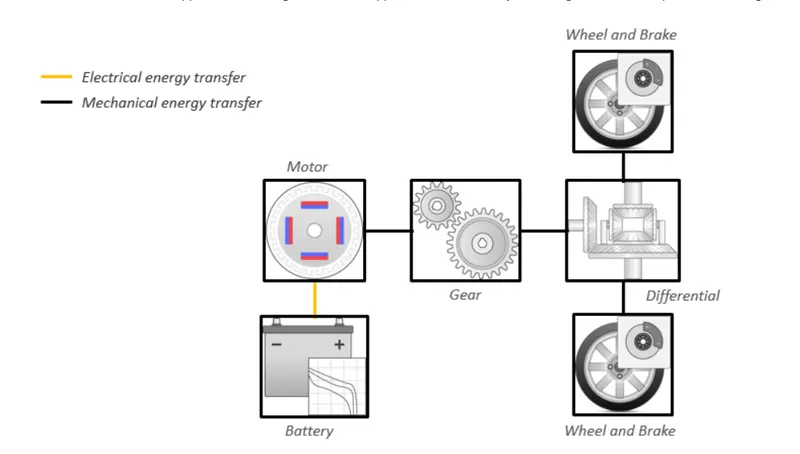
Pure Electric Model Block set:
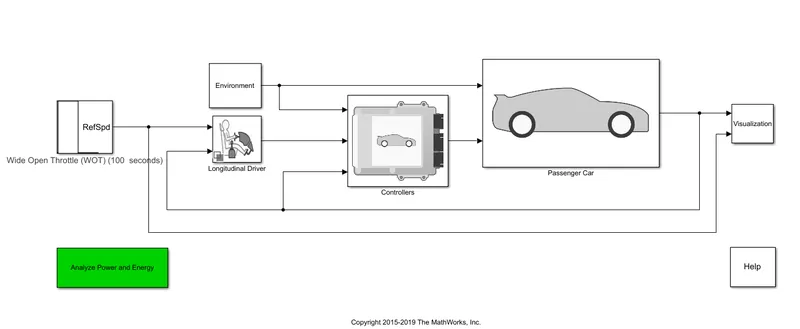
Environment:
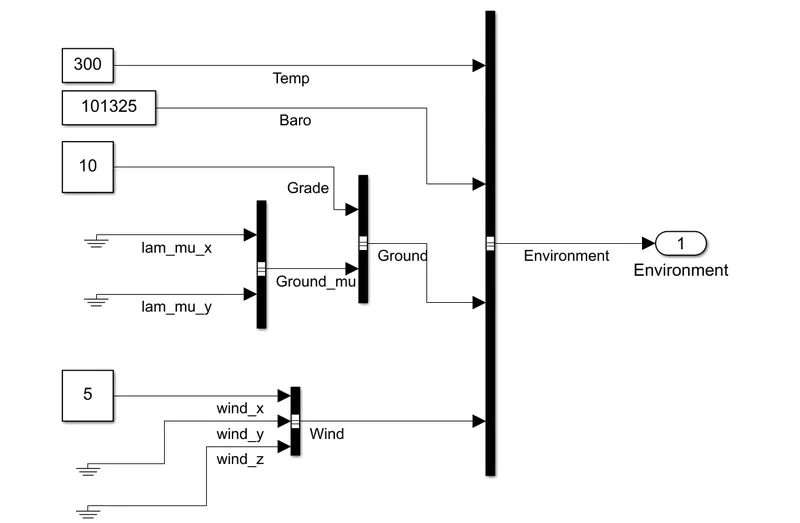
Case 1 (Grade 10 deg, Wind Velocity 5m/s):
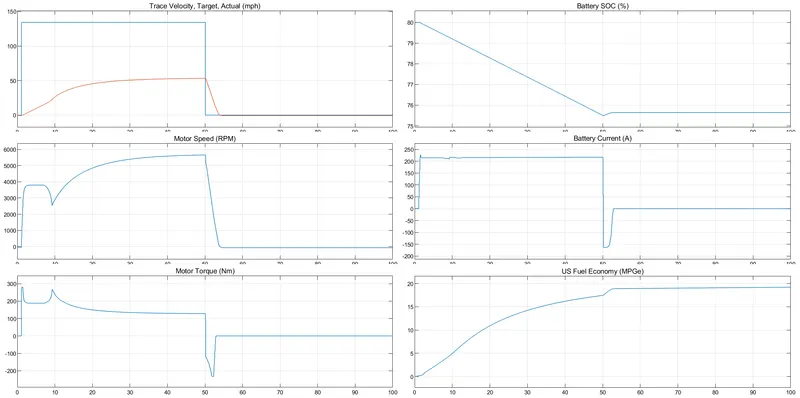
Plot 1:
- Blue line: Reference Velocity
- Orange line: Vehicle Velocity
Results Comparision:
| Case 1 | 10 deg gradient, 5m/s Air velocity (HEV) | |||
| Case 2 | 10 deg gradient, 5m/s Air velocity (EV) | |||
| Case 1 | Case 2 | |||
| Grade (deg) | 10 | 10 | ||
| Air Velocity (m/sec) | 5 | 5 | ||
| Max Speed (mph) | 61.2 | 53 | ||
| Peak Engine Torque (Nm) | 139 | NA | ||
| Peak Motor Torque (Nm) | 207 | 280 | ||
| Max Current drawn from battery (A) | 168 | 226 | ||
| Batter SOC (%) | 60%-20% | 80%-75% | ||
| Fuel Economy (MPG) | 7.26 | 19 | ||
Observation:
- A low top speed is observed for EV compared to HEV.
- Hign Motor Peak torque, as it is the only proplusion unit in EV. It is of high power.
- EV has higher fuel economy compared to HEV.
- As the battery in EV is of Higher Energy Density, The decrease in SOC is less compared to HEV.
References:
- Powertrain Blockset documentation by Matlab.