Week-4 Challenge WOT Condition Part-2
AIM
1. Explain the difference between mapped and dynamic model of engine,motor and generator and explain how to change the model type
mapped model
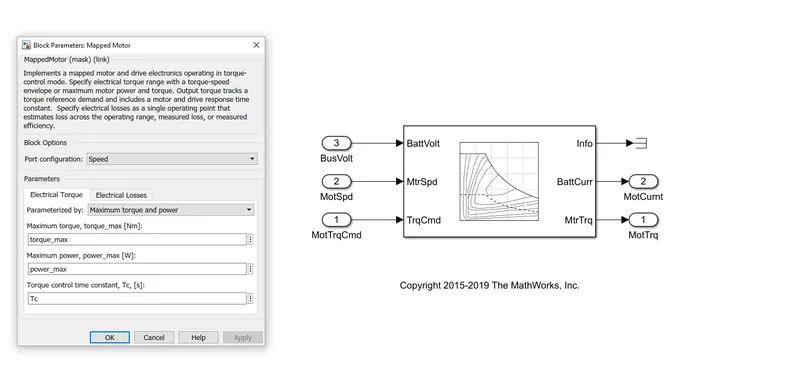
. the mapped model is a simulation model which uses pre determined datas of particular models,
. the datas are contained in the form of lookup tables
. mostly used when indepth data of the model to simulated isnt available
. as its lookup table based it simulates faster
. usually inacccurate results as all of the theory is based on assumptions and realtime scenario isnt considered
Dynamic model
. dynamic model is realtime model which represents actual components, it validates every single component in the system and its behaviour to produce an output
. accurate results based upon realtime scenario
. high accuracy of the results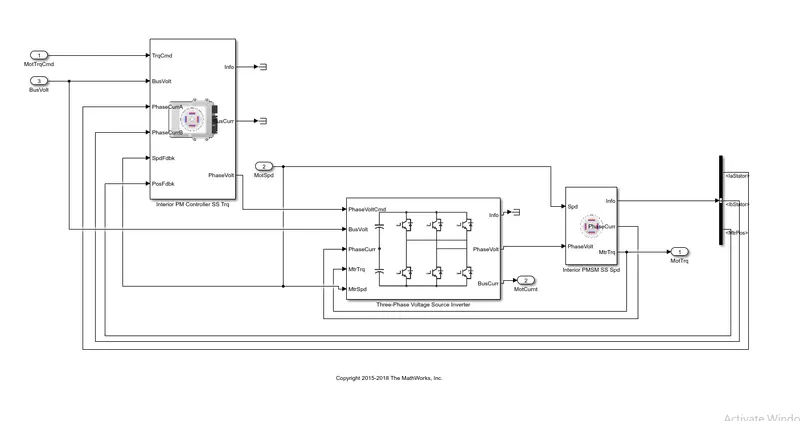
. changing the model type
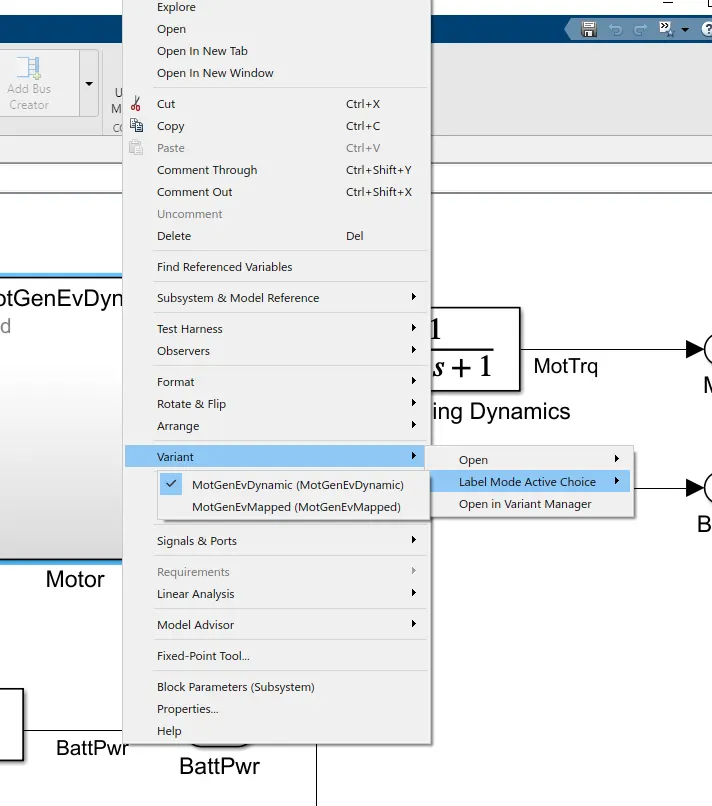
following this path [passenger car- Electric plant] left click on the motor block and select the variant
2 . how does the model calculate miles per gallon, which are the factors considered to model fuel flow
. The factors considered while calculating miles per gallon are battery power and the vehicle speed
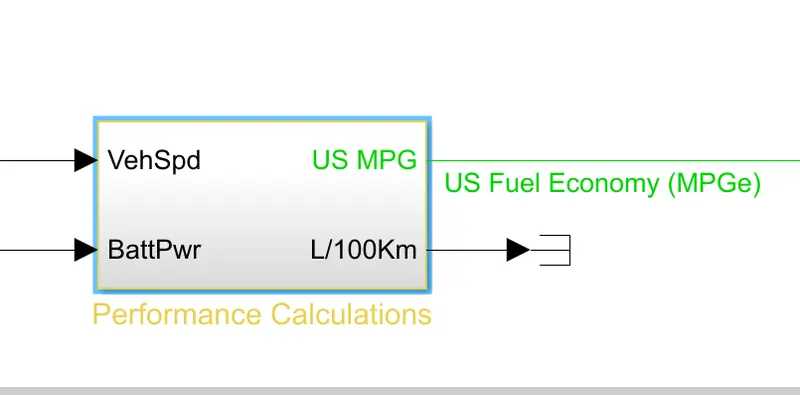
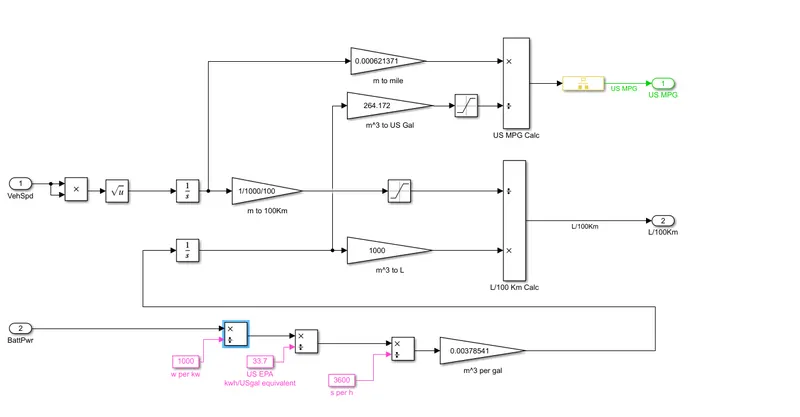

. vehicle speed values are taken and are squared and square rooted, and integrated with respect to time, again its multiplied with (0.000621371) constant to convert from meter to miles
. battery power value are taken and are divided by 1000 then divided by 33.7 to convert to us gal equivalent, then by 3600 to seconds per hour,
. then multiplied by a constant(0.00378541) converting into m^3 per gallon , then the value is integrated w.r.t time, and again converted to us gallon
. the vehicle speed and battery power values after unit conversion are given as inputs to product block and the outputs from the block is fed to a rate transition block which handles block datas operating at different rates
3. Run the HEV refernce application with WOT drive cycle, change the grade and wind velocity in the enviornment block
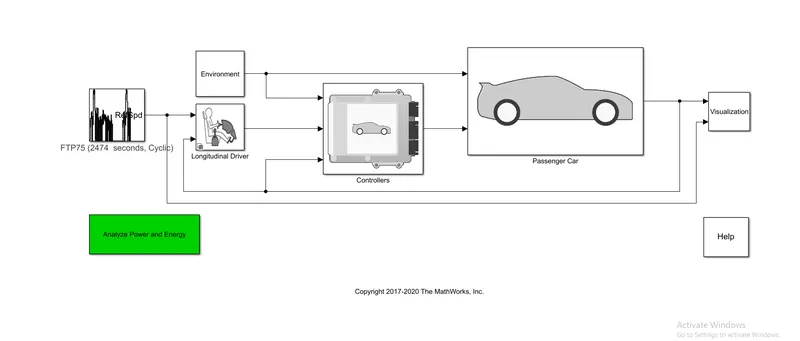
. The HEV reference application is selected and the drive cycle is determined according to user desired inputs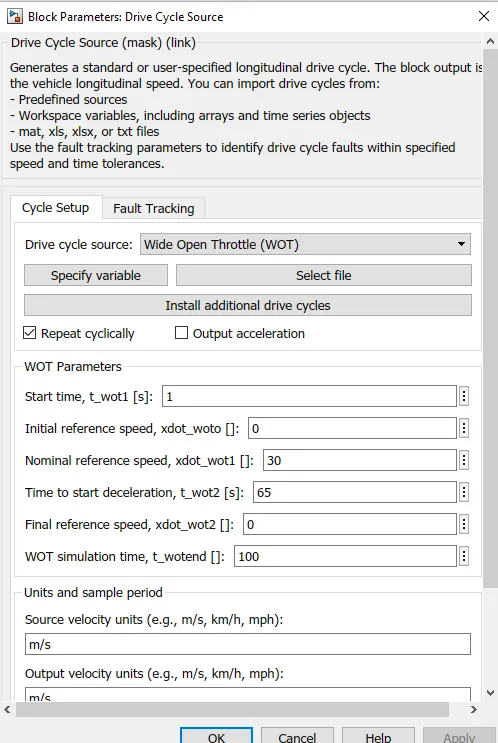
once the drive cycle is determined , the simulation is run for further analysis
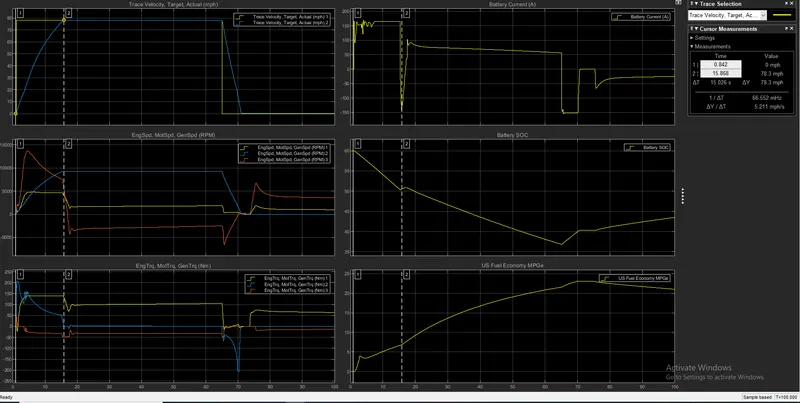
. The acceleration time taken for the HEV is 15.02 seconds to reach its top speed of 78.3mph
. the motor speed is max at 13
. the battery current spikes up during the time of acceleration from 0 to a peak value of 166A,
. In the RPM slot its seen that the generator rpm spikes up to its peak, and falls down, which is due the power demanded by the motor to assist the IC engine for sudden acceleration
. as time progresses the generator slows down as the motor and stabilize their o/p which helps in maintaining the achieved speed untill it decelerates
. while decelerating the engine stays idle and the motor generator works due to regenerative braking
. the motor torque spikes it max at the start and as the engine reaches its efficient operating range it climbs down as the engine dominates for the needed torque requirement, this depends upon the drive cycle and the design nature by the manufaturer
. once the vehicle attains max speed, the battery current drops down to a -ve value and bounces back again around an average of 75A, and remains in that range untill the vehcile decelerates
. once deceleartion starts its observed that the -ve values again start up, which is due to the deceleration and the regeneartive breaking in action
. the battery state of charge initially on 60% falls down to 40%, this rapid energy consumption is due to the acceleration of the vehicle and it improves later on while decelerating,
. the miles per gallon at acceleration time was around 5 to 6 mpg, which improves as the vehicle attains to speed and maintains the momentum, thus not much of current is required or consumed, which also refelects on the better mpg's
HEV reference application with changed gradient and wind velocity in WOT drive cycle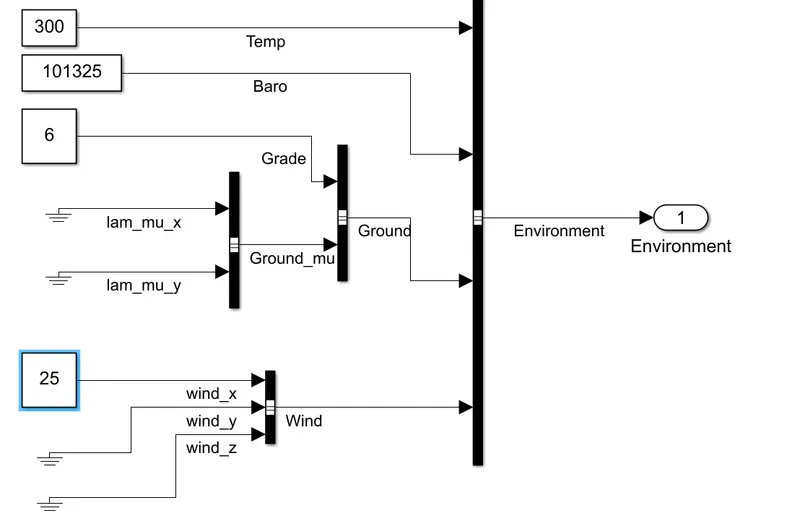
. The environment parameters are selected from the environment block and the parameters like wind velocity and gradient are changed
. a gradient of 6 degree and wind velocity of 25m/s is added and simulated to observe the results
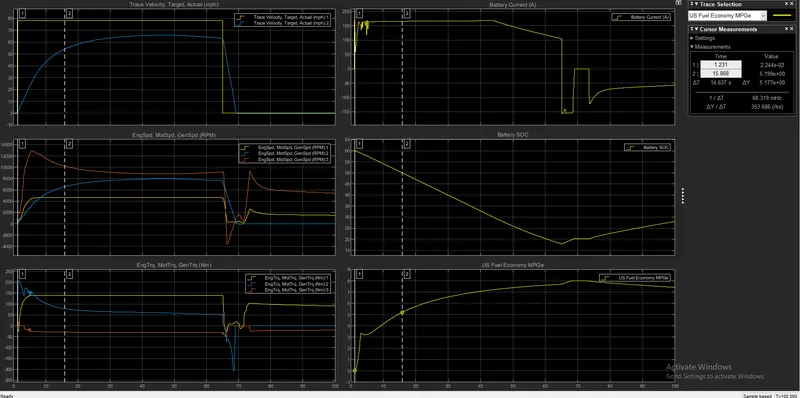
. within a time frame of 15sec HEV attained a speed of 57.3mph
. max battery current during the time is 165A , 10% of battery SOC is depleted
. drastic change in the MPG max around of 7,
. As observed the signifiacant change are due to the change in the environment parameters,
. as the gradient changes the hill climbing force requirment increases, and the wind velocity increases the rolling resistance force, which all sum up to a larger tractive force and power required to move the vehicle
. this results in the lower top speed, acceleration time and higher depletion of battery charge and current and lower MPG's
.
4. keeping all other parameters same, compare ths simulated results of hybrid and pure electric powertrains
. Pure EV powertrain . HEV powertrain
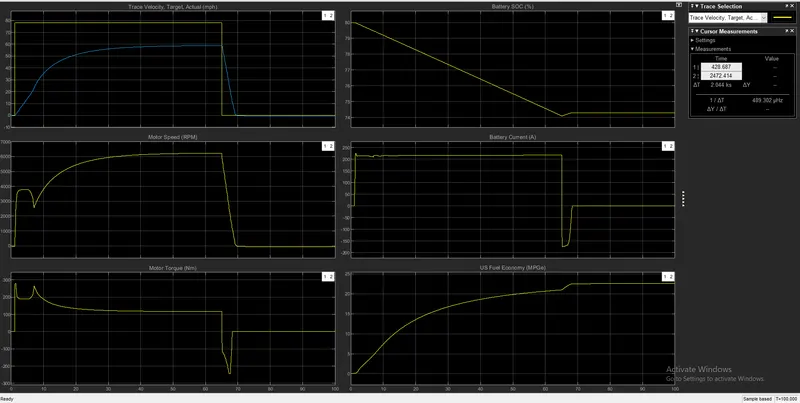
. the max speed achieved is 63mph . max speed achieved is 65.7mph
. the max battery current discharge is 225A . max battery current discharge is 167A
. battery SOC depletion for the cycle is 6% ie from 80% SOC to 74% SOC . battery SOC depletion for the cycle is 43% ie from 60% SOC to 17% SOC
. max MPG achieved is 20mpg . max MPG achieved is 7.5mpg
. when observed in efficency POV pure electric drivetrain is better, as it returns better MPG's than of an HEV powertrain
. when observed in performance POV the HEV performs better than pure EV, as it takes more time to accelerate and attained top speed during the drive cycle is also lesser than of HEV