Study and Compare the Powertrain of Hybrid Electric Vehicle and Pure Electric Vehicle using simulink model.
AIM : Study and Compare the Powertrain of Hybrid Electric Vehicle and Pure Electric Vehicle using simulink model.
Powertrain :
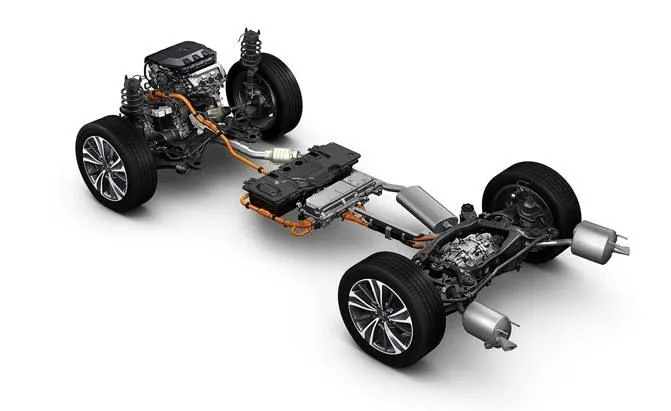
Powertrain systems include propulsion, drivetrain, and transmission subsystems. To configure the drivetrain subsystem, you can use the limited slip or open differential blocks. The propulsion blocks include mapped motor, compression-ignition (CI) engine, and spark-ignition (SI) engine blocks. For the transmission subsystem, you can use the ideal fixed gear transmission block.
Powertrain Blockset :
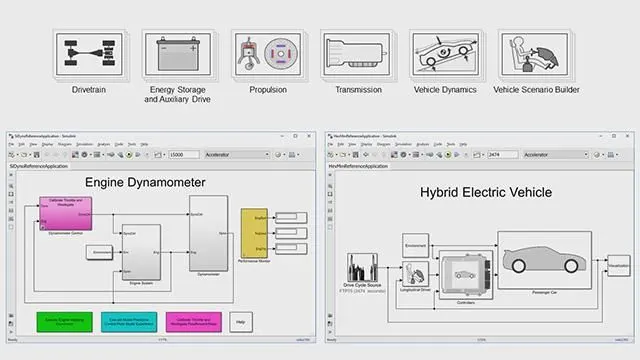
Powertrain Blockset™ provides fully assembled reference application models of automotive powertrains, including gasoline, diesel, hybrid, and electric systems. It includes a component library for simulating engine subsystems, transmission assemblies, traction motors, battery packs, and controller models. Powertrain Blockset also includes a dynamometer model for virtual testing. MDF file support provides a standards-based interface to calibration tools for data import.
Powertrain Blockset provides a standard model architecture that can be reused throughout the development process. You can use it for design tradeoff analysis and component sizing, control parameter optimization, and hardware-in-the-loop testing. You can customize models by parameterizing components in a reference application with your own data or by replacing a subsystem with your own model.
OBJECTIVE :
-
What is the difference between mapped and dynamic model of engine, motor and generator? How can change model type?
-
How does the model calculate miles per gallon? Which factors are considered to model fuel flow?
-
Run the HEV ReferenceApplication with WOT drive cycle. Change the grade and wind velocity in the environment block. Comment on the results.
-
Keeping all other parameters same, compare the simulated results of hybrid and pure electric powertrains.
STUDY - 1 :
DIFFERENCE BETWEEN MAPPED AND DYNAMIC MODEL :
|
BASIS OF DIFFERENCE |
MAPPED MODEL |
DYNAMIC MODEL |
|
FEATURES |
|
|
|
ENGINE |
|
|
|
MOTOR |
|
|
|
GENERATOR |
|
|
|
ADVANTAGES |
|
|
|
DISADVANTAGES |
|
|
STEPS TO CHANGE THE MODEL TYPE :
To change the model type of motor or generator from mapped model to the dynamic model the following steps are to be followed :-
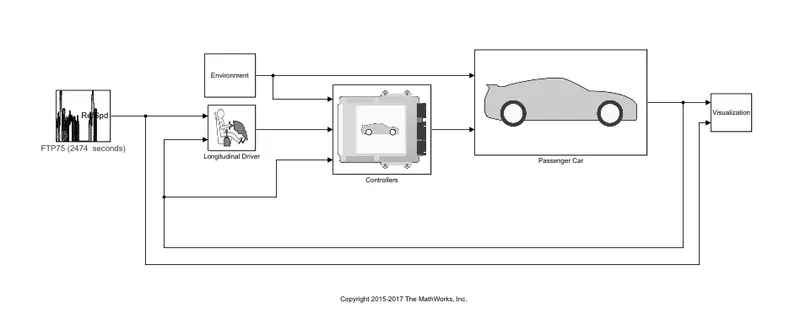
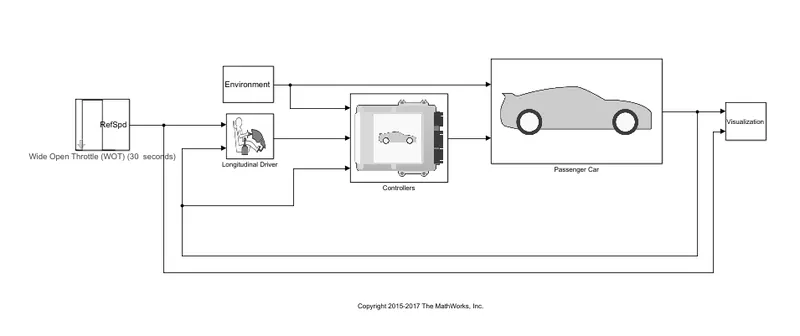
- Firstly we select the hybrid reference application model in Simulink from the powertrain blockset which consists of the drive cycle, longitudinal driver, environmental conditions, controllers and passenger car as shown below -
- Then clicked on passenger block it consists of engine, electric plant, drive train and their respective inputs and outputs as shown below -
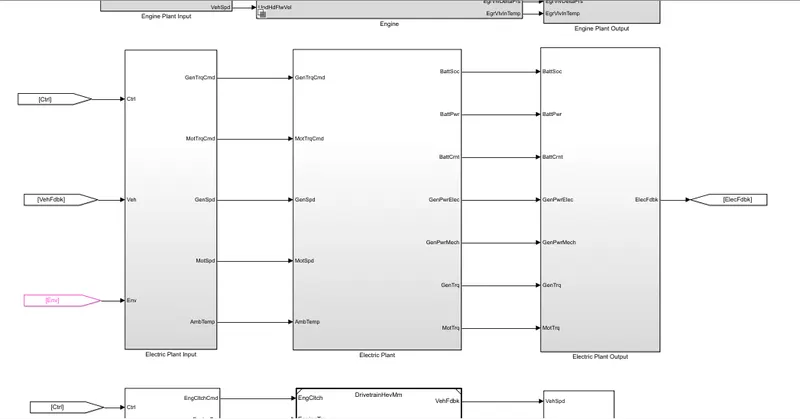
- Once the electric plant is opened it consists of battery, generator and motor which can be seen below -
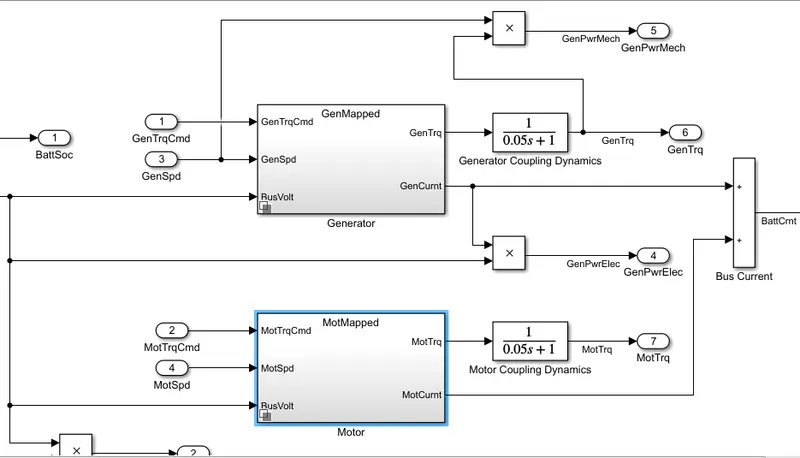
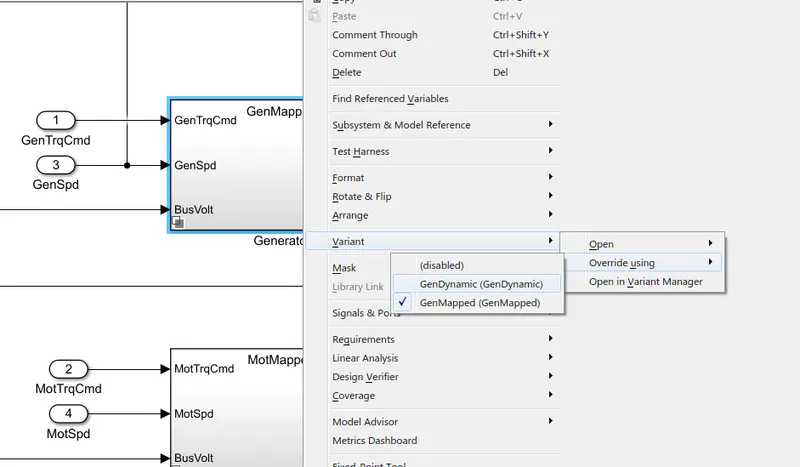
- After that we select Either the generator or the motor block, to change the model type. By default mapped generator block is selected. Right click on that go to Variant option after that go to Override using option there alredy GenMapped type model selected We select GenDynamic option to chance model type as Dynamic model as shown below -
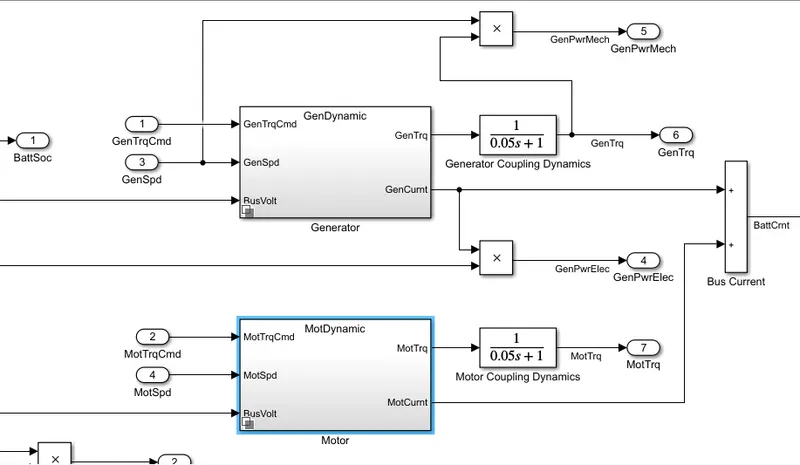
- It is observed that model is changed from mapped generator to dynamic generator as shown below -
STUDY - 2 :
MILES PER GALLON :
- Miles per Gallon is a fuel economy rang determined by how far a car can travel on a gallon of petrol or Diesel for a Engine powered car.
- In case of an electric vehicle it tells us the energy which is equivalent that of a engine powered carto propel the car through a distance.
- The amount of Fuel Energy required to move a engine powered car through a distance is determined and then it is compared to the eqivalent amount of electric energy required to move the car throgh the same distance and is expressed as the miles per gallon.
- The powertrain blockset has a model that calculates the miles per gallon for all kinds of vehicle.
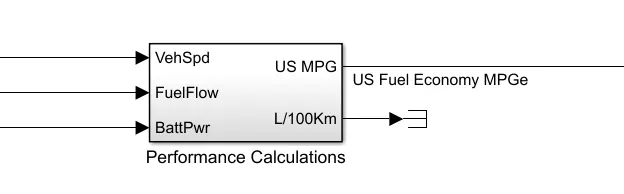
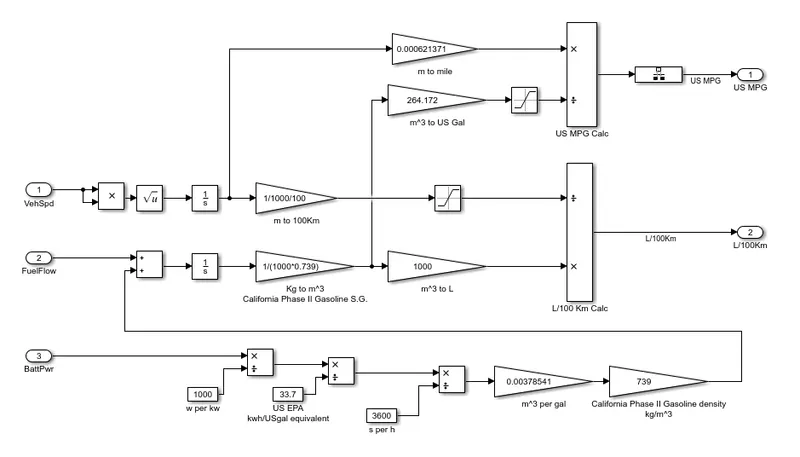
- The above model takes the input of the Vehicle speed, Fuel flow and Battery power to calculate the fuel consumpon and the equivalent battery consumpon and calculates the miles per gallon.
- For the calculating MPG following parameters are taken into consideration :
A. VEHICLE SPEED
B. FUEL FLOW
C. BATTERY POWER
VEHICLE SPEED AND FUEL FLOW :
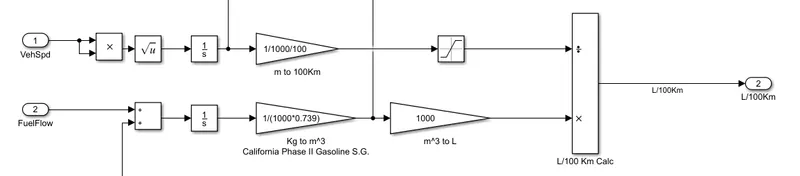
- The Vehicle speed is a important factor while considering the fuel consumpon at that particular time,so to determine the fuel consumpon throughout the drive cycle.
- To convert speed to Distance we can Integrate with time and we are doing the same of converng the velocity to get distance covered by integrang.
- Then the Fuel flow is expressed as the mass flow rate (i.e) the amount of fuel at each moment in Kg/Sec. Now integrang this will result in the mass of the fuel and by using this 1 we convert it to the volume and by mulply by 1000 to get it in Litres.
- By comparing the two results we can get the amount of litre consumed to Run for 100km.
BATTERY POWER :

- The amount of Energy from battery power required to propel the vehicle Equivalent to that of the Engine is calculated here.
- The battery power is given in watts and it is converted to Kw by dividing with 1000.
- Then we convert the power into energy by mulplying with the me into KWh.
- Then we convert the Energy from kWh to equivalent energy in US gallon of automove gasoline by dividing with 33.7. since we get the energy in US Gallons equal in KWh we are trying to get the energy of equivalent LIS Gallons per seconds and we do this by dividing with 3600 and we convert the hour to seconds.
- Then mulplying with 0.00378541 we convert the US Gallons per sec to the volume of the fuel flow in (mA3/ s) and then we mulply with 739 (California Phase Il Gasoline density) (i.e) mA3/s * kg/mA3 which gives the result as mass flow rate kg's.
- Then finally the Battery energy equivalent in kg/s is given as a input for the fuel flow parameter in order to find the equivalent US Gallons enegy and estimate the Miles per Gallons.
CALCULATING MILES GALLON :
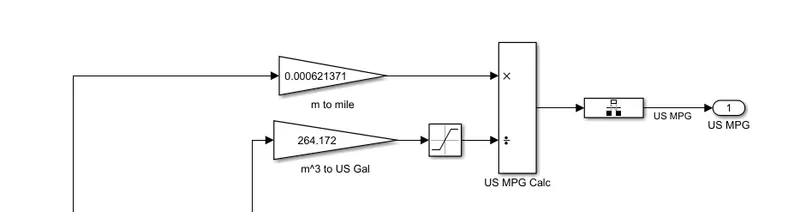
- Then the inputs from the vehicle speed (i.e) the Distance we found (in meters) is taken into the calculaon and it is converted to the miles by mulplying with 0.000621371.
- Then the inputs from fuel flow (Battery energy + Fuel energy) taken in mA3 and is converted into equivalent US Gallons by mulplying with 264.172.
- Then the two inputs Miles covered and equivalent US Gallon is further divided and the result is got in Miles / Gallon.
STUDY - 3 :
Run the HEV Reference Application with WOT drive cycle
By Taking the HEV model reference the model is opened and drive cycle is changed as WOT that flow diagram are given below :
Block for Drive Cycle parameters :
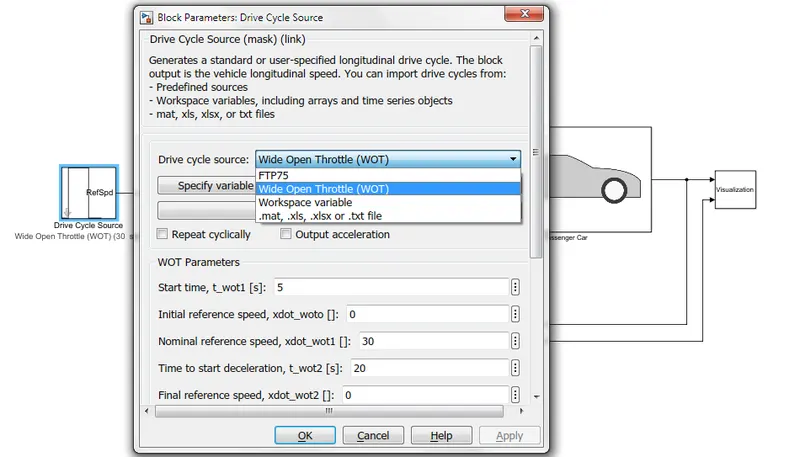
- For drive cycle as we know starting time, final time, initial speed and final speed are the basic and important parameters to be taken into the consideration.
- As study proceeds Time to start acceleration, Initial reference speed, Time to start deceleration and Final reference speed are the parameters which can be easily given for cycle setup.
Inside setup of an Environmental Block where values of 'Grade' and 'Wind' are kept as zero for the analysis :
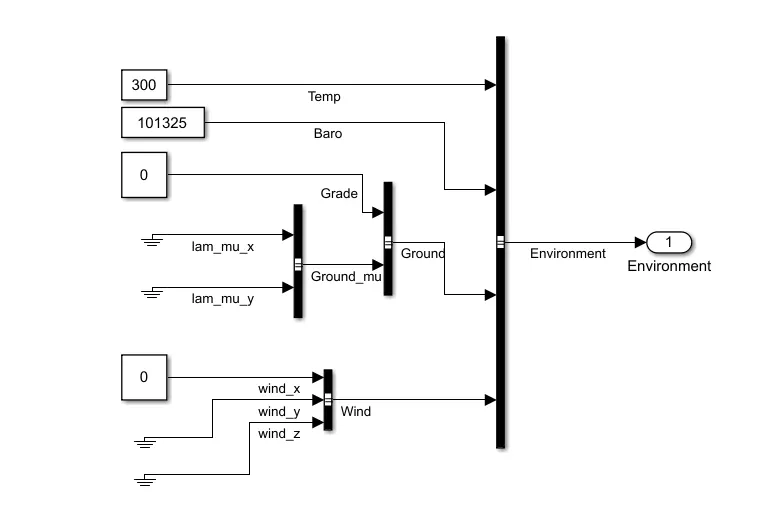
Simulation results for the drive cycle where 'Grade' and 'Wind' are kept as zero :
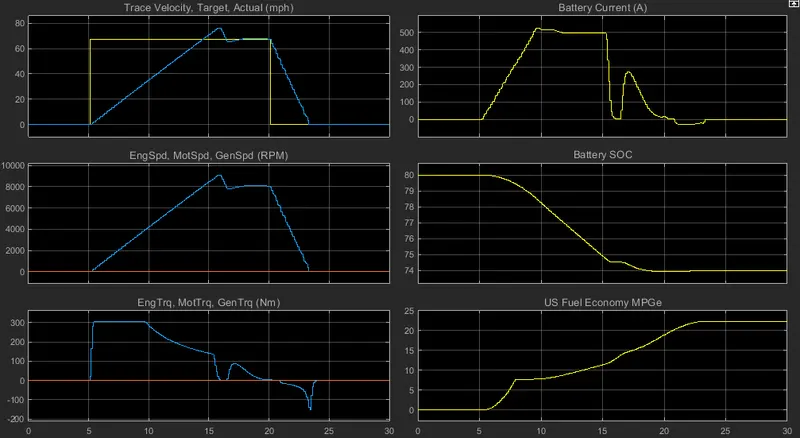
- The above figure shows the results for the simulaon and there are totally six plots in them.
- Each plot shows a particular result and the plots are made in such a way that ,there is a cursor measurement. The cursor enables us to study the behaviour of other result parameters corresponding to the acceleraon of the vehicle.
Plot -1 ( Trace Velocity, Target Actual 'mph' )
- In this plot the velocity is raised by the torque for certain limit of speed and power is transformed by accleration force.
- Then speed of vehicle is driven in constant speed.
Plot -2 ( Engine Speed, Motor Speed 'Rpm' )
- Here the plot initiate speed of motor and engine speed by RPM. The supply of power from the battery is observed and distributed by control system that power is generated to the motor.
Plot -3 ( Engine Torque, Motor Torque 'Nm' )
- This plots shows the engine torque, motor torque and the generator torque of vehicle. The raise of velocity in vehicle at initial stage is driven by this supply of torque.
- Velocity range to attain the maximum torque is applied for this system. An battery supplies the power to motor and that conversion of energy is transmitted into torque.
Plot -4 ( Battery Current 'A' )
- A battery capacity of the vehicle is varied depends upon the drive cycle of engine system. In this plot shows that the engine starts and battery power is also generated so graph points are increased in intital point.
- The torque is produced by battery so the level of power transmission is high in that state when it reaches maximum velocity limit it will interchange the engine system and battery becomes low on that stateflow. when the gear shifted is happen the torque will raise again so that portion power transmission become high.
Plot -5 ( Battery SOC )
- The State Of Charge refers to the recharging condition of battery during an deacceleration process. Here the plot shows that same system battery flow is rasied while supplying the power and it will low by insufficient power when it raise again during the deacceleration process.
Plot -6 ( Fuel Economy MPGe )
- This plot shows the fuel consumption of vehicle per distance. This calculates the mileage of vehicle during the acceleration of vehicle.
WOT Cycle with changes in Grade and Wind Velocity
Inside setup of an Environmental where values of 'Grade' and 'Wind' are kept as 7 and 21 respectively :
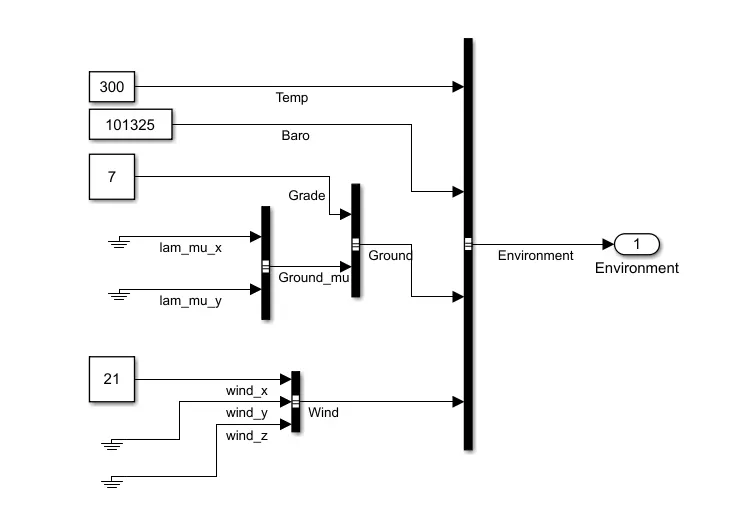
Simulation results of drive cycle where values of 'Grade' and 'Wind' are kept as 7 and 21 respectively :
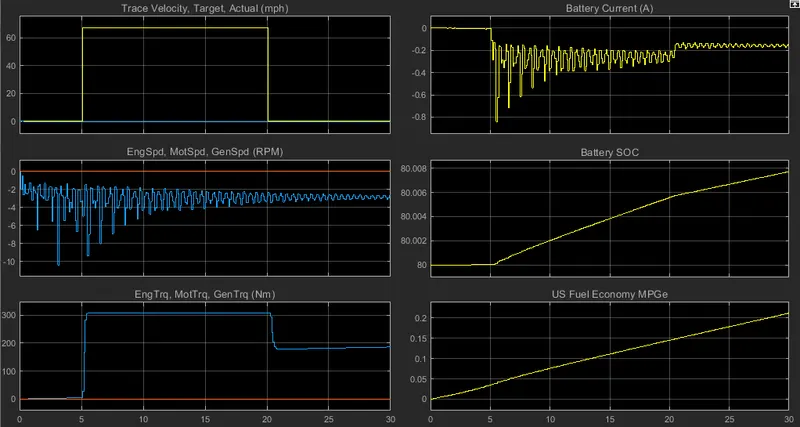
- In all the results we can observe some changes from the previous case.
- Though the vehicle parameters and the drive cycle are the same, here we have considered some changes in the environment blocks by adding some hill climb angles and wind velocity.
- By changing the grade and wind values in the default model some changes are obtained in results they are shown as below.
Plot -1 ( Trace Velocity, Target Actual 'mph' )
- The torque of vehicle to obtain the velocity will be low when compared to default model velocity.
Plot -2 ( Engine Speed, Motor Speed 'Rpm' )
- In this plot engine speed and motor speed are getting high compared with the default model because the grade value is denoted and that gradeability of vehicle is obtained. To archive the speed the motor will take more power to run the generator.
Plot -3 ( Engine Torque, Motor Torque 'Nm' )
- Torque is raised in this system due to wind energy is applied in this model so frictional force will get more pressure by this condition hence torque of vehicle is more than comparing with default model.
Plot -4 ( Battery Current 'A' )
- Battery current supply is also high by giving the more power to torque the battery power is transmitted to torque and that should be passed to genertator. some times the generator is acting as recharging system of battery.
Plot -5 ( Battery SOC )
- State of charge is not possible in the intial state by the continous acceleration of vehicle and raise in torque the SOC is not acting for some point when the slope portion is obtained and torque will reduce then constant power will acted that portion state of charge will acting.
Plot -6 ( Fuel Economy MPGe )
- Fuel economy is very high in this drive condition due to the wind and gradeability. The torque is gradually increased so that fuel consumption is also become high.
CONCLUSION :
- The vehicle was not able to achieve the required top speed though using the highest possible current discharge of that same battery used before.
- The state of charge also shows that the discharge is also high compared to the simulaon 1.
- The Fuel Economy is also down to half of the previous simulaon.
- So one can say, it is evident that the efficiency of no load vehicle is high compared to the vehicle with additional loads acting on them and also we have visualized this using the Powertrain blockset.
STUDY - 4 :
Hybrid electric vehicle (HEV)
Hybrid Electric Vehicle Multimode Reference Application Simulink Model :
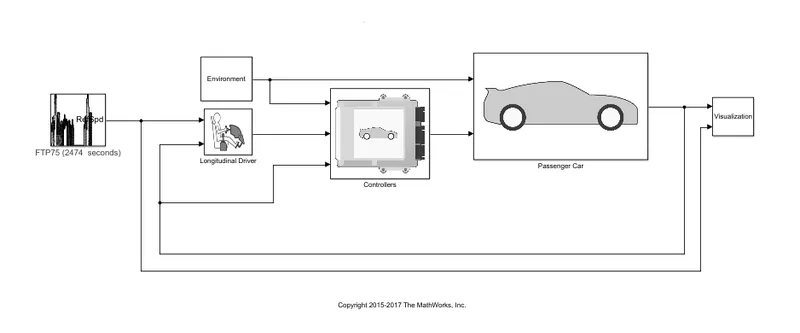
- The hybrid electric vehicle reference application represents a full multimode hybrid electric vehicle (HEV) model with an internal combustion engine, transmission, battery, motor, generator, and associated powertrain control algorithms.
- Use the reference application for powertrain matching analysis and component selection, control and diagnostic algorithm design, and hardware-in-the-loop (HIL) testing.
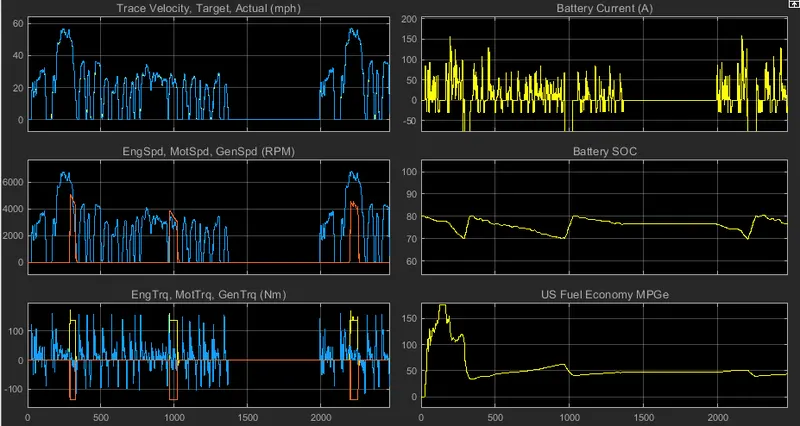
Simulation results of Hybrid Electric Powertrain for Drive cycle FTP75 :
Full Electric Vehicle (EV)
Electric Vehicle Reference Application Simulink Model :
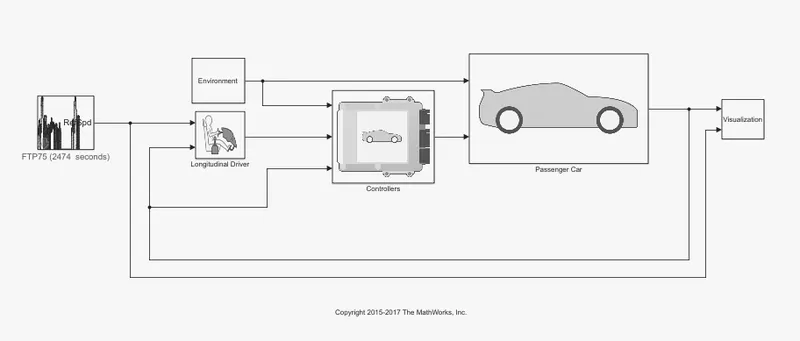
- The electric vehicle reference application represents a full electric vehicle model with a motor-generator, battery, direct-drive transmission, and associated powertrain control algorithms.
- Use the electric vehicle reference application for powertrain matching analysis and component selection, control and diagnostic algorithm design, and hardware-in-the-loop (HIL) testing.
Simulation results of Pure Electric Powertrain for Drive cycle FTP75 :
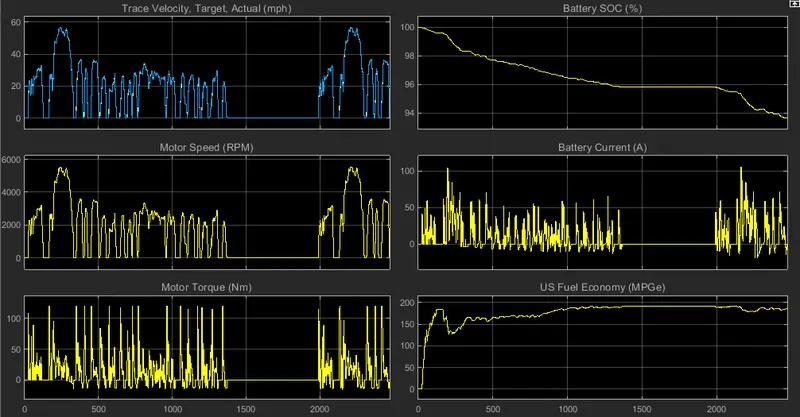
Comparison of Hybrid Electric Vehicle with Pure Electric Vehicle Powertrain
Trace velocity, Target, Actual (mph) :
- The results for both HEV and Pure EV are same. It's simply the plot of the drive cycle FTP75 where both actual performance of the vehicle matches with the ideal performance for the models of the vehicle.
- In both of the cases 57 mph is the top speed achieved by the vehicle during the span of a drive cycle for both actual and ideal performance of the vehicle.
Engine speed, Motor speed, Generator speed (RPM) :
- Pure electric vehicle plot shows only the speed of the motor because in that combustion engine are not used.
- The speed of the motor varies in praportion with the power requirements of the vehicle. As the speed of the vehicle increases power requirement increases and as the speed of the vehicle decreases power requirements also decreases.
- Plot for the simulation results of PEV shows the graph where motor and operates as per the requirement of the power to deliver the accepted performance.
- Where as in HEV we have three components Engine, Motor and Generator.
- In HEVs the engine (Blue line) is the main source of the power and whenever during the operation vehicle has to power up motor comes into the action to fulfill the power and torque requirements of the vehicle.
- we can observe the vehicle needs the power to achieve top speed or to achieve maximum speed possible within shortest period of time electric motor (Orange line) cope up with the engine to enhance the performance by providing the necessary power as the output.
Engine torque, Motor torque, Generator torque (Nm) :
- In case of HEV the torque of the engine (Blue line) shows the positive increasing values during acceleration of the vehicle whereas the engine torque decreases during the deceleration of the vehicle.
- The motor torque (yellow line) shows the positive values as the motor comes into the action wherever the vehicle needs extra power for the instantaneous acceleration.
- The generator torque (Orange line) shows the negative values whenever the motor will came into the action because the generator will not be able to generate the charge that is required to charge the battery as it becomes passive.
- Whereas in case of pure electric vehicle the results shows the torque values for motor itself and those values increases and decreases indirect proportion with the speed of the vehicle.
Battery current (A):
- In both HEV and PEV the battery current increases (shows positive values) as the speed or power requirements of the vehicle increases (during acceleration) and decreases (shows negative values) as the speed or power requirements of the vehicle decreases (during deceleration).
Battery SOC :
- The battery keeps on losing its state of the charge as the cycle proceeds. Where there are less power requirements there the plot becomes stable but it cannot be improved as in case of HEV.
- In HEV the SOC of the battery is maintained between the upper and lower limits of the SOC of the battery to keep the battery always prepared for the instantaneous performance requirements.
- In such cases whenever the battery falls below the critical level the generator comes into action to restore the charge into the battery.
Fuel Economy (MPGe) :
- Fuel economy of an EV is inversely proportional to the speed of the vehicle as the speed increases the fuel economy decreases and as the speed decreases the fuel economy of the vehicle starts being stable and becomes stable at zero speed.
- In HEV whenever the generator will come into action the fuel economy of the vehicle seems improving and plot shows the positive change.
CONCLUSION :
- The Hybrid vehicle allows the battery to compensate the required power by the vehicle and generators helps to charge the battery at faster rate which allows the vehicle to travel over the long distances.
- In electric vehicle the power requirements are satisfied by using battery only therefore the overall range of the vehicle gets compensated.
- The wind velocity and the grade degrades the performance of the vehicle as the power requirements are increased which results in the more consumptiion of the battery power.