WOT Condition HEV and EV
AIM-
- What is the difference between mapped and dynamic model of engine, motor and generator? How can you change model type?
- How does the model calculate miles per gallon? Which factors are considered to model fuel flow?
- Run the HEV ReferenceApplication with WOT drive cycle. Change the grade and wind velocity in the environment block. Comment on the results.
- Keeping all other parameters same, compare the simulated results of hybrid and pure electric powertrains.
EXPLANATION-
STUDY->1
Mapped model:
- The mapped model is the one where the data points are preassigned and a lookup table are also available.
- The engine or motor torque required is sensed and the motor engine blocks generates the required torque output just as required sumply without considering the real time motor engine parameters.
- In mapped model the accuracy is not that hgh but the simulation is done with very less time as it does not run by real time parameters.
- The output values are stored for the corresponding input values the engine motor and the generator.
Dynamic model:
- The dynamic model uses the combination of the outputs from various subsystems to generate the output.
- It runs by real time simulation where the required put from the drive cycle is taken and for that individual real time simulation is done and all the results of the he subsystems gives the output of the simulation.
- In the drive cycle of the dynamic model, the bus voltage and current is is given along with the vehicle feedback so that it runs the actual simulation at that particular moment through the drive cycle.
HOW TO CHANGE MODEL TYPE:
- First we have to open the powertrain module blockset of the required vehicle.
- Second we have to double click on the passenger car vehicle block and afer the subsystem gets opened we have to select engine or electric plant.
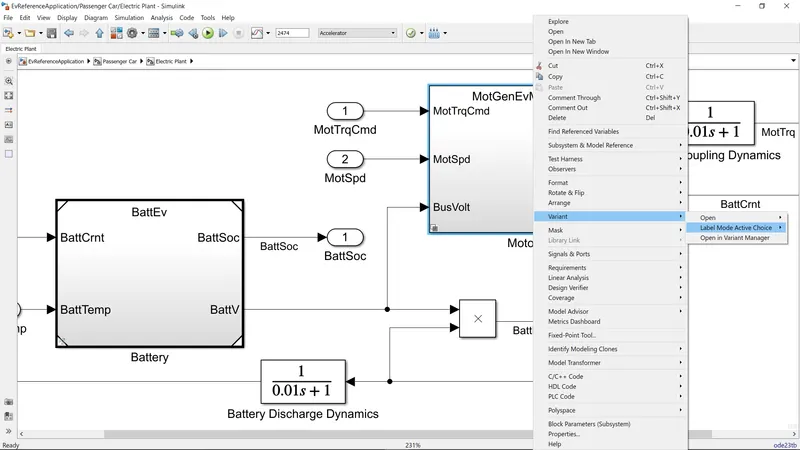
- Right click on the engine exitari generator based on vehicle model and select the vaiant.
- Under variant scroll tolabel model active choice and hoose mapped or dynamic as per your requirement.
- fig-1>
STUDY->2
Miles per gallon(mpg)
Miles per gallon is a unit which is used to show how far you vehicle is about to travel for every gallon of fuel it uses. As an exampe ,if we own a car with 50mpg ,then we should be able to travel 50 miles before it runs out of fuel.
In this figure i have selected the EV reference applcation model and selected the performance calculations block.
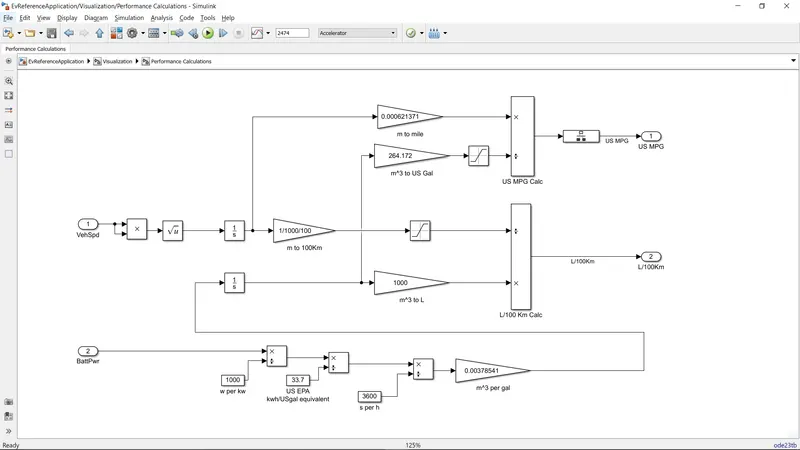
In this visualization block, the model takes an input of vehicle speed, fuel flow and battery power to calculate fuel consumption and equivalent battery consumption. The inputs from the vehicle speed and the distance are taken into calculations and it is converted to miles by multiplying with 0.000621371. Then the inputs from the fuel flow taken in m^3 and are converted into equivalent US gallons by multiplying with 264.172.
Then the miles covered and equivalent US gallon are further divided and the result is obtained in mile per gallom(mpg).
Factors to consider to model fuel flow
- Fuel economy
- Weight
- Displacement
- Aerodynamic efficiency
- mechanical resistance
- Fuel consumption
STUDY->3
Hybrid electric vehicle- These type of vehicle combines the benifits of gasoline engines and electric motors and can be configured to meet differrent objectives such as improved fuel efficiency ,fuel ecnomy, increased power. HEV's run on fuel alone and dont get plugged into electric outlet to rechare the battery. ex- Toyota prius(widely driven HEV with 2 million units sold)
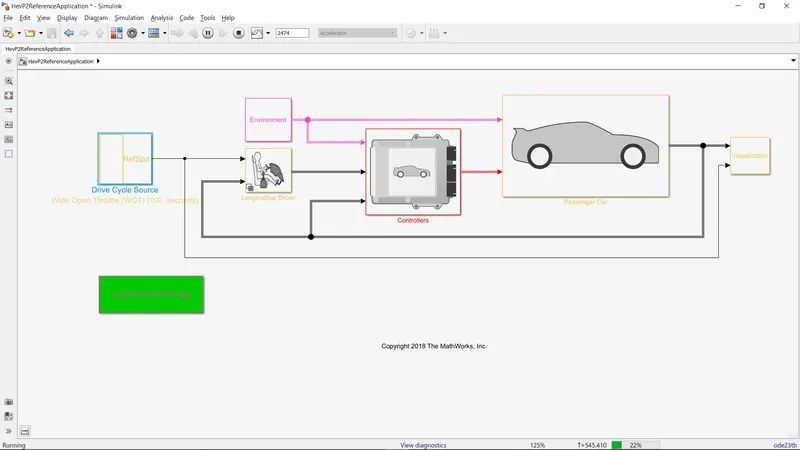
SIMULINK MODEL Of HEVreference application :
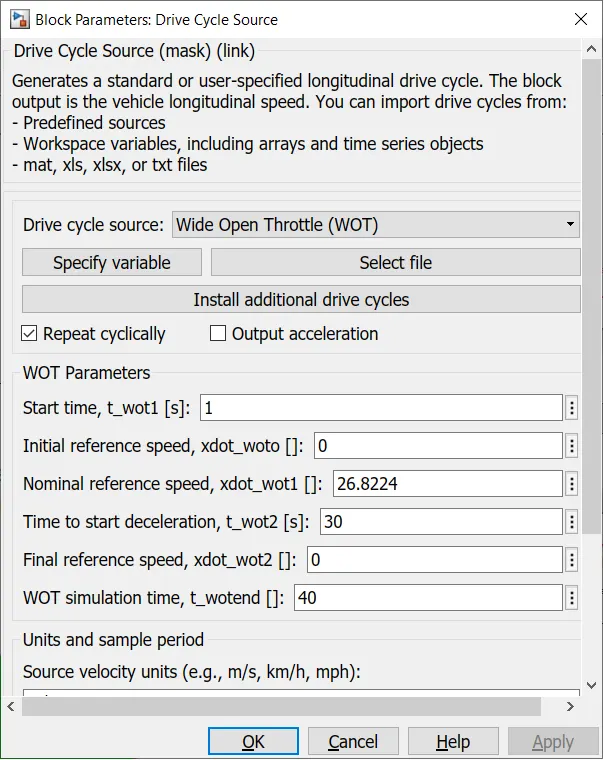
WOT CONDITION:
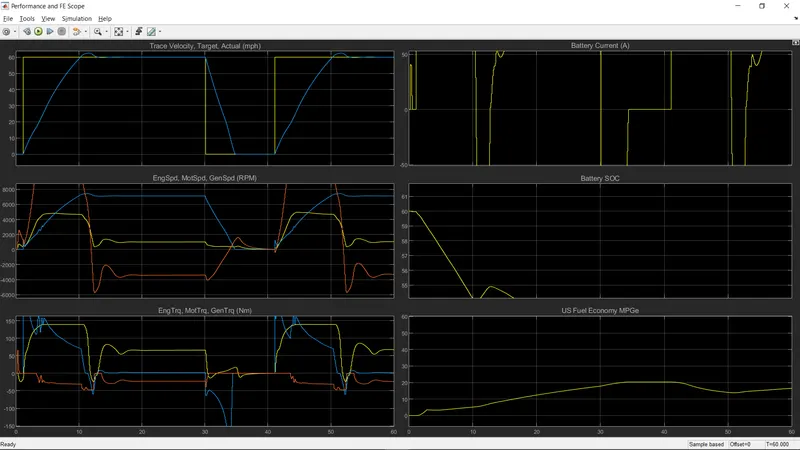
CASE-1
Wind velocity and grade are kept zero
Nominal reference speed=50 km/hr
Deacceleration time =60 km/hr
Simulation time= 60secs
RESULT->
CASE->2
Keeping the grade angle 8 degree and wind velocity 1om/sec and keeping all others parameters same.
RESULT->
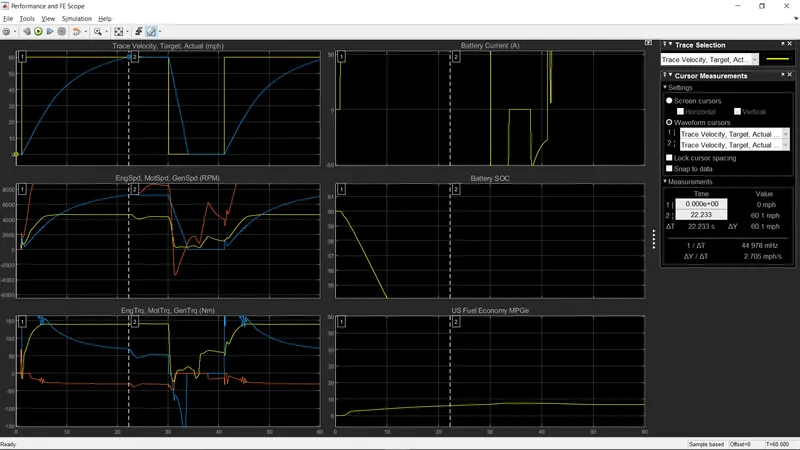
RESULTS COMPARISION:
| Parameters | case-1 | case-2 |
| Grade(deg) | 0 | 8 |
| Wind velocity | 0 | 10 |
| Top speed | 62.5mph | 60.6mph |
| Acceleration time to reach 60mph | 11.301secs | 23.301secs |
| Deceleration time from 60 to zero mph | 5.507secs | 4.109secs |
| Peak engine speed | 4787rpm | 4636rpm |
| Peak motor speed | 7437rpm | 7299.233rpm |
| Peak generator speed | 14610rpm | 12595rpm |
STUDY->4
Keeping all other parameters same,compare the simulated results of hybrid and pure electric powertrains .
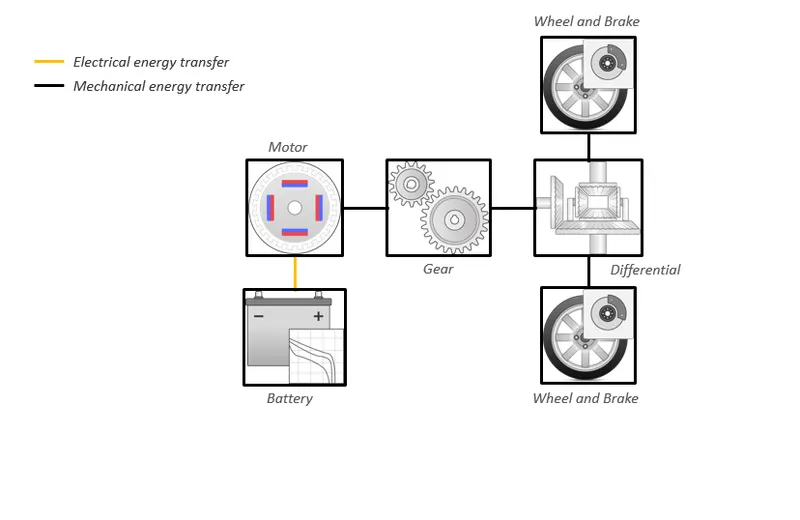
PURE ELECTRIC VEHICLE
Powertrain configuration-
Simulation model-
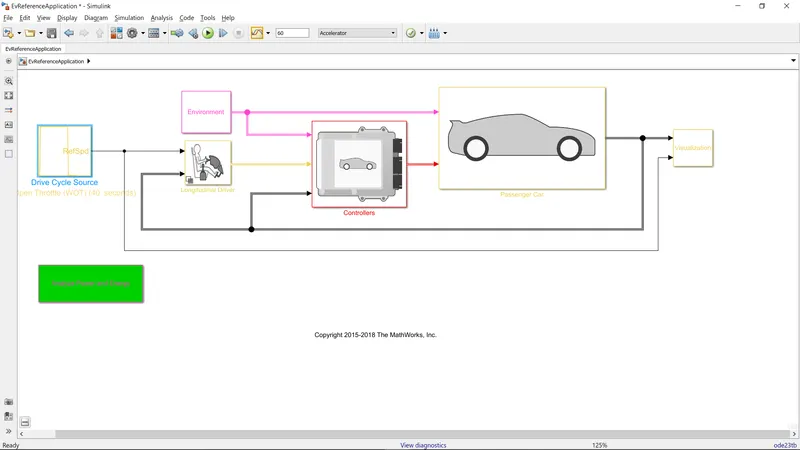
Keeping grade angle 8 degrees and wind velocity 10m/s.
Results-
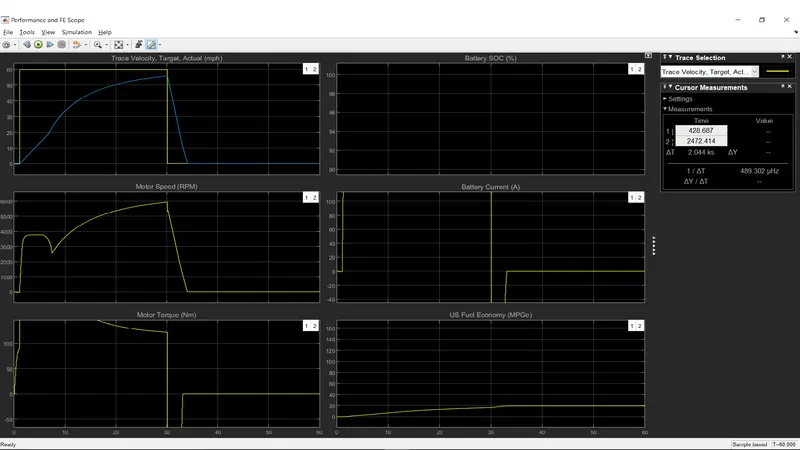
COMPARISION-
| Parameters | HEV | EV |
| Grade(deg) | 8 | 8 |
|
Wind velocity(m/s) |
10 | 10 |
| Top speed | 60.6mph | 55.3mph |
| Acceleration time to reach 60mph | 23.301secs | 30secs |
| Deacceleration time from 60 to min | 4.109secs | 3.3sec |
| Peak motor speed | 7299.233rpm | 5940rpm |
| Peak motor torque | 202Nm | 268Nm |
| Battery state of charge | 60to 28%in 60sec | 80 to 77.8%in 60 sec |
CONCLUSION ->
From the above comarision table , we can say that HEV is more efficient than pure EV vehicle.