Week-4 Challenge WOT Condition Part-2
Question 1:
a)Solution:
Mapped Models:
Mapped Models are used to analyse the performance of the subsystem during its steady state operation. This operation is basically implemented using the Look-Up table blockset, so all the performance charecteristics starting from engine to motor and generator are identified in the form of data set which is then used by the above blockset. This Models are not sufficient to analyse the transient operation of all the subsystem perfomances where we have to take into account every changes in the parameters w.r.to time instantaneously.
Dynamic Models:
Dynamic Models handles the transient operation of all the subsystem performances efficiently. In this category, all the Models charateristics are decomposes into respective lower-level components so as to identify every single relationship of a parameter in a way such that any changes of its value can be monitored easily w.r.to time. So by this way all the minute changes of a respective subsystem component can be easily get analysed and we can visualize its impact on the overall performance of the system. The only problem of this category is it takes huge amount of time to fully analyse the system and to show the respective output.
b)Solution:
In the HEV application of the Powertrain Blockset, both the Model options are available for the subsystem components starting from engine to motor or generator. So the user can easily choose between the two models according to its criteria. The models are shown in the following way:
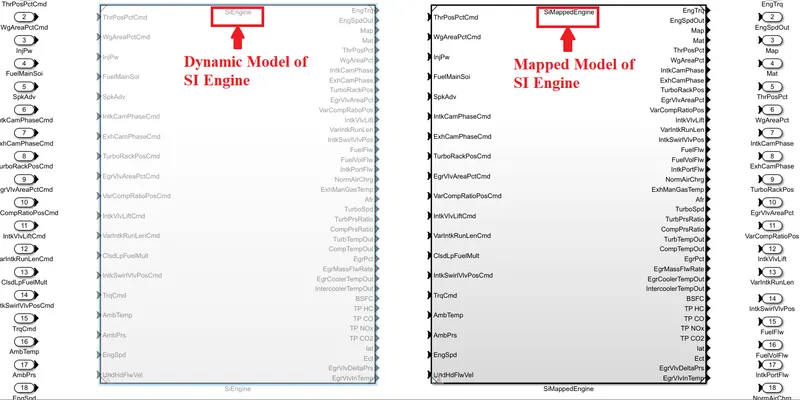
So in the engine subsystem, both the models are shown but here the Mapped SI engine Model is acivated. So in order to change the type of the Model we have to use the Variant Subsystem as instructed in a powertrain blockset summary given below:
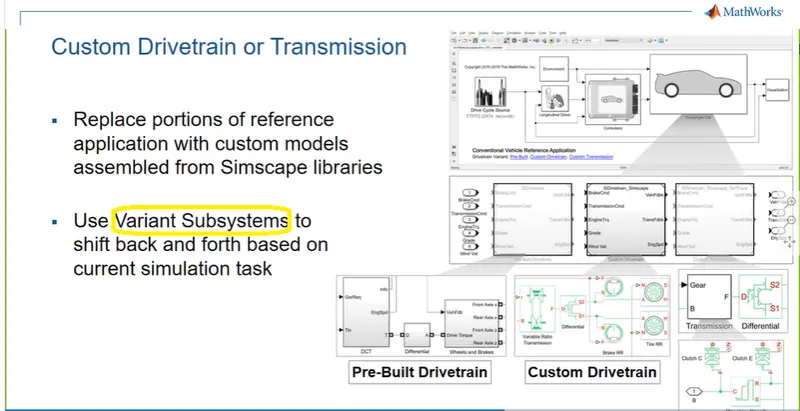
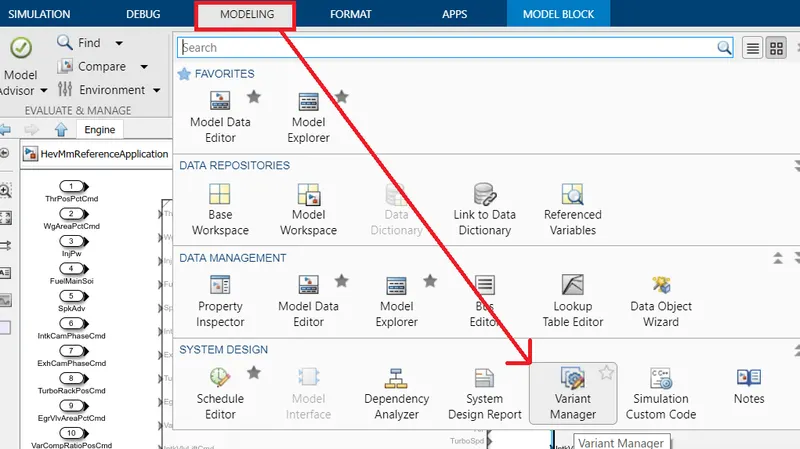
So this variant subsystem is nothing but the Variant Manager which can be found in the Modeling tab of the Simulink under the System Design section as shown below:
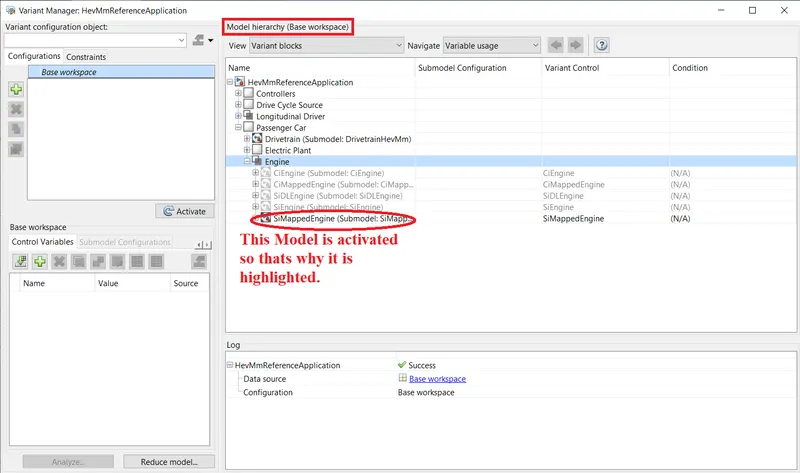
After clicking the Variant Manager option, a window will appear where in the Model Hierarchy we will get to see all the Models under the Engine Subsystem and the one which is activated wil be highlighted in Black letters as shown in the figure below:
Now, in order to change the Model type, Right Click on the Model that we want to choose and then click "Set as Label Model Active Choice" so here we want to choose SI Engine so we will do the procedure said above:
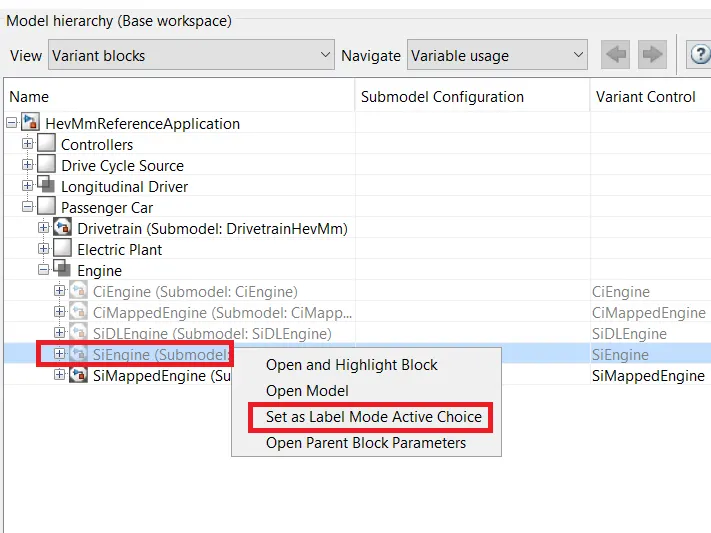
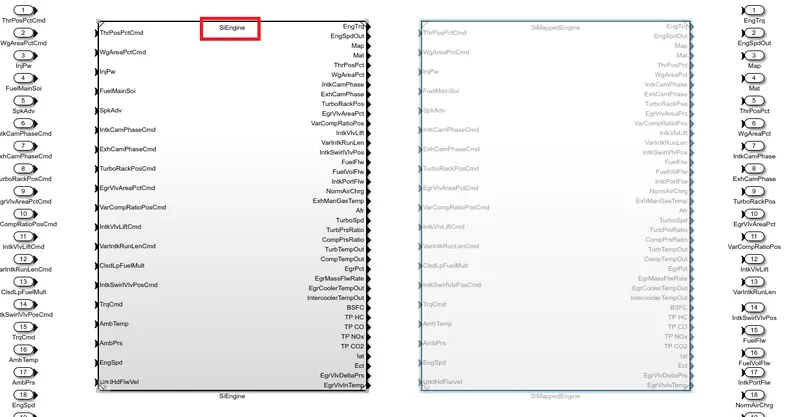
So now our Model get changed from SIMappedEngine to SIEngine(Dynamic) as shown below:
Question 2:
a)Solution:
Miles Per Gallon(MPG) stands for the distance measured in miles that a vehicle can travel w.r.to per gallon of fuel consumption. This is important from the perspective of the vehicle's efficiency, so therefore if a vehicle has a higher MPG then it will be more fuel efficient.
So here in this project it is calculated using this subsystem as shown below:
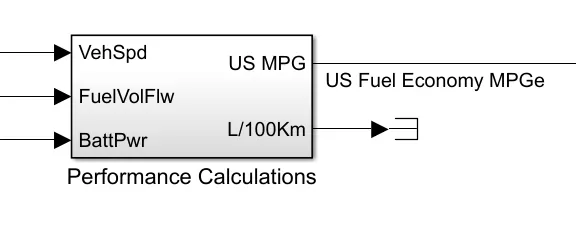
This MPG measurement is basically used in USA where the fuel efficiency of the vehicle is constantly monitored by checking the consumption of litres per 100km or 1/100km, and then dividing it with a constant value of 264.172(for measurement in gallon) to get the ultimate MPG.
So inside the subsystem there is a part which is used for the calculation of the the MPG as shown below:
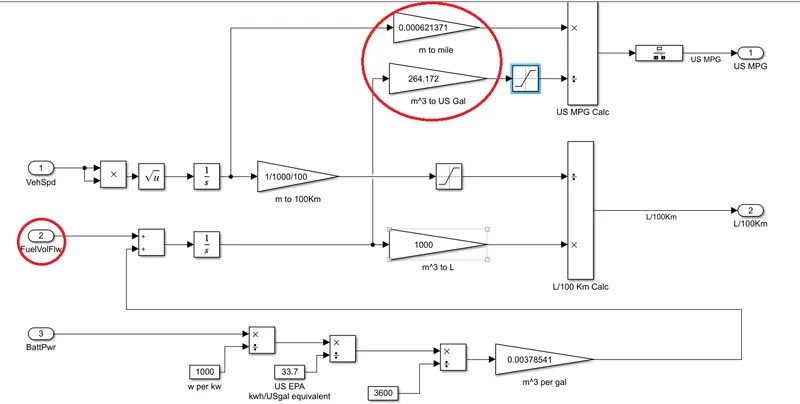
From the above discussion, we can see from the diagram that the Fuel Volume Flow rate is integrated to get the volume which is then converted to Gallon as highlighted. And on the other hand the vehicle Speed is integrated to find the Distance that is divided by the Gallon to ultimately get the MPG.
b)Solution:
The factors which are considered to Model fuel flow are as follows:
- SI Engine(Mapped/Dynamic)
- Engine Control Module(ECM)
- Engine Temperature
- Mass of the Fuel
Question 3:
Solution:
The Block Diagram of the HEV Reference Application of the Powertrain Blockset is given as follows:
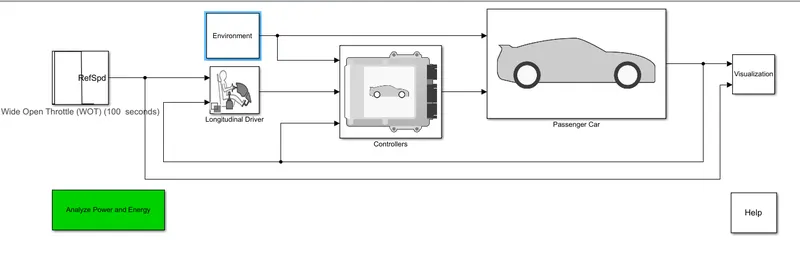
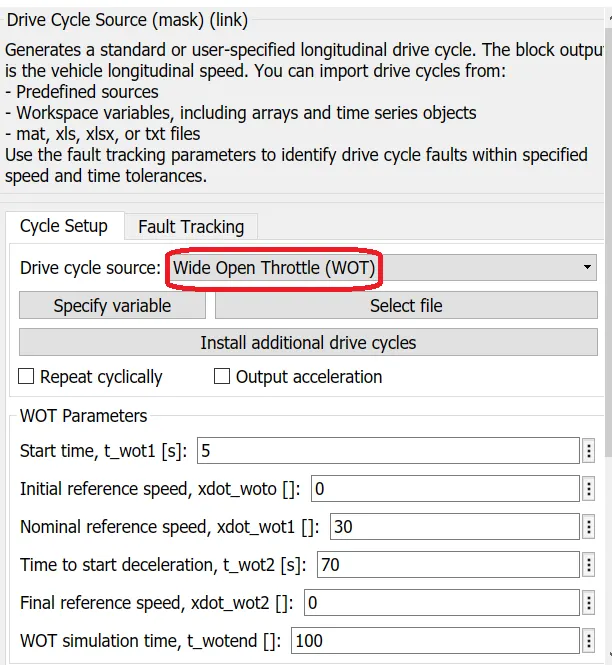
In this application we choosen the Drive Cycle as a Wide Open Throttle(WOT) with the following specifications:
Now as per the question we have to change the Grade and the Wind Velocity which we will be doing by changing the parameters of the Enviroment Block(as per the Block Diagram) as shown below:
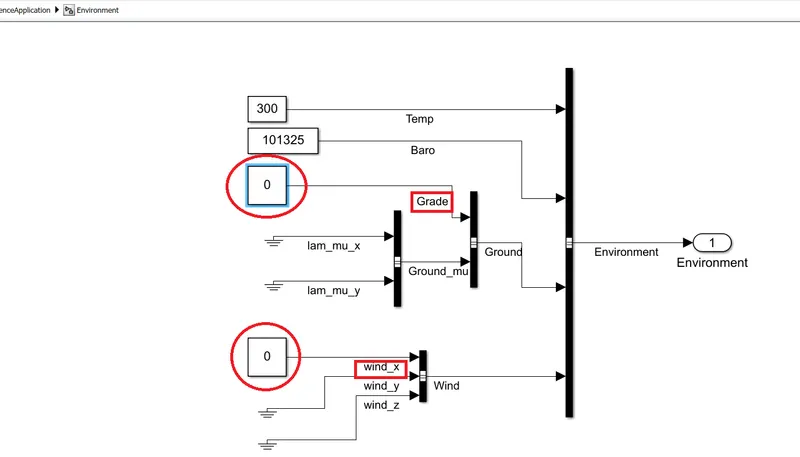
So here the parameters marked by "Red" are the one we are handling with. So by changing the values of the parameters we will be able to see the changes in the output and so for that we have taken three conditions as following:
Condition 1: Taking both the values of the Gradeability and the Wind Velocity as default which is Zero.
In this situation no changes in the Model is required as by default both the Grade and the Wind Velocity is taken as zero. The corresponding result will come as shown below:
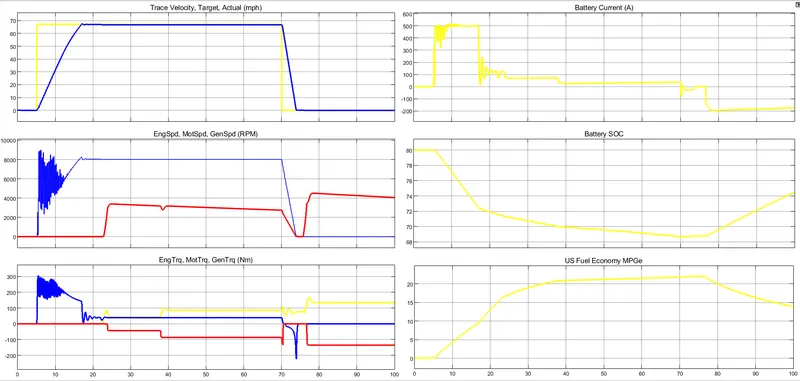
From the above results we can make the following Discussion which are as follows:
- As we have taken Grade and the Wind Velocity as zero so the Actual Velocity is exactly following the Trace Velocity but the Actual Velocity is taking a certain amount of time to reach the Trace Velocity and it is due to the Battery Current Capability as to follow the Steep Slope of the Trace velocity a huge amount of current is required which is not permissible from the battery point of view as the Battery temperature will rise to a great extent which is not desire.
- During the De-acceleration of the Vehicle, the motor torque goes to the negative value which tells that the Regenerative Mode is activated and it can also confirm from the Battery SOC curve which starts increasing as the Motor starts giving energy to the battery.
- After 80 sec we can see that though the Motor Torque and Speed goes to zero but the Engine and the Generator still producing torque and it is due to the reason that Battery SOC doesn't regain its original charge contain. Until and unless the Battery doesn't regain its original amount of charge the Generator will have to supply energy upto that initial point which in this case is 80%.
Condition 2: Taking the Gradeability as 10deg and the Wind Velocity as 10kmph:
In this situation the Result will come out as follows:
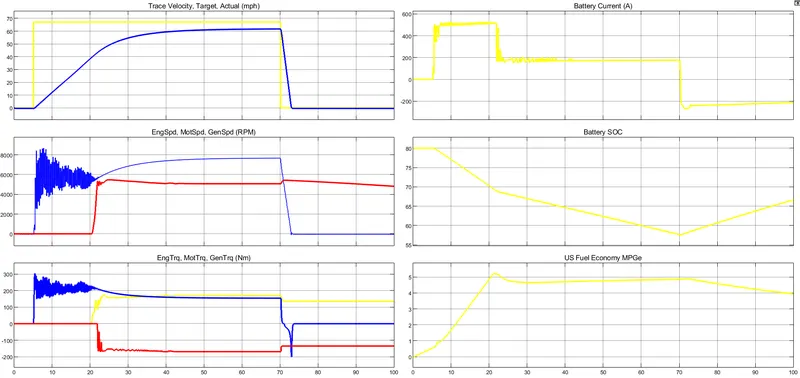
From the above results we can make the following Discussion which are as follows:
- As we increase the Grade and the Wind Velocity, so gradually there will be a fall in the Velocity achieve by the vehicle so this can be seen from the 1st Graph where the Actual Velocity can't able to reach the Trace Velocity.
- Here we can see that both the Generator and the Engine Speed gets increases from the previous condition which is due to the reason that now the Engine has to supply the power to the load in order to maintain the vehicle velocity and the Generator has to supply power to the battery to balance the rapid consumption of the Batter SOC.
- Another thing to be noted that the MPG gets deteriorated from the previous curve which is because the fuel efficiency gets decreases due to the Engine which is supplying more power to the load thereby decreasing the overall efficiency which as an effect can be seen in the Fuel Economy curve.
Condition 3: Taking the Gradeability as 15deg and the Wind Velocity as 15kmph:
In this situation the Result will come out as follows:
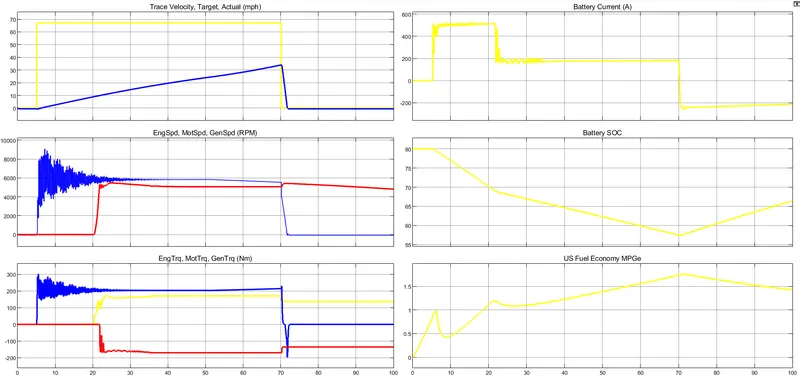
From the above results we can make the following Discussion which are as follows:
- Here we can see that the Actual Velocity reduced further due to the further increase of the Grade and the Wind Velocity.
- Miles Per Gallon gets deteriorated further due to the higher involvement of the Engine thereby decreasing the efficiency to a great extent.
Question 4:
Solution:
Just like HEV application, we have considered the same changes in parameters for EV Model as well. There is basically no changes in the Block Diagram but instead in the EV scenario there is no Engine and Generator subsystem.
So same as HEV model we have taken the same three conditons for EV model as well and wich are as follows:
Condition 1: Taking both the values of the Gradeability and the Wind Velocity as default which is Zero.
In this situation the Result will come out as follows:
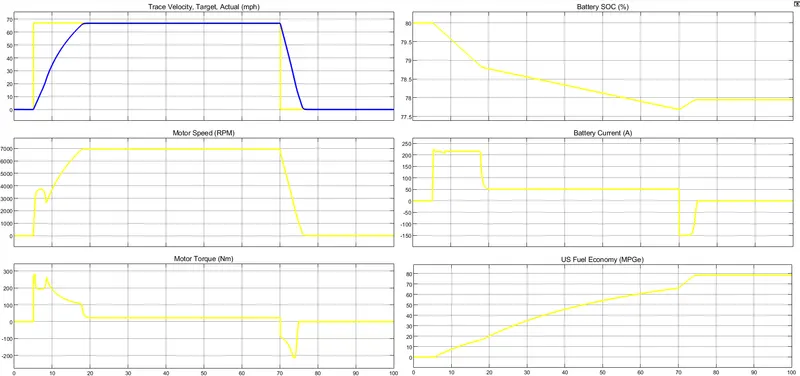
From the above results we can make the following Discussion which are as follows:
- As the Gradeability and the Wind Velocity is zero so the Actual velocity is reaching the Trace velocity after a certain duration as discussed in the HEV Model.
- Unlike HEV Model, the Battery current drawn by the Motor in the EV scenario is less which ultimately helping in less depletion of the Battery SOC.
- The most important advantage of EV model is the presence of the Motor alone which thus helping in the improvement of the vehicle efficiency and ultimately the Fuel Economy as shown from the curve.
Condition 2: Taking the Gradeability as 10deg and the Wind Velocity as 10kmph:
In this situation the Result will come out as follows:
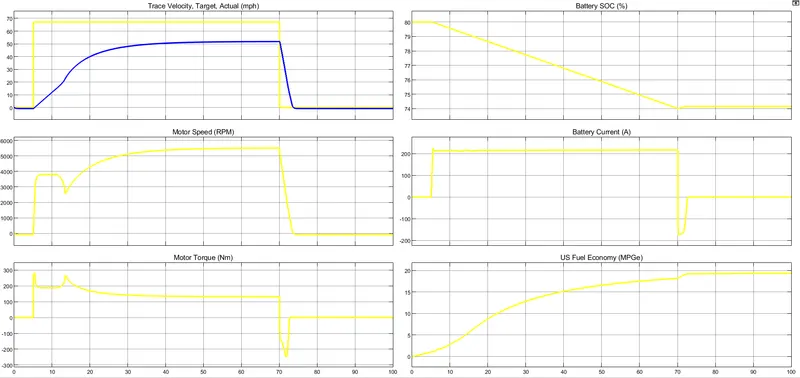
From the above results we can make the following Discussion which are as follows:
- Same as the HEV model the actual velocity will get reduced further from the Trace velocity.
- Though the MPG gets reduced due to the presence of the Grade and the Wind Velocity but overall the nature is the same due to the reason discussed above.
Condition 3: Taking the Gradeability as 15deg and the Wind Velocity as 15kmph:
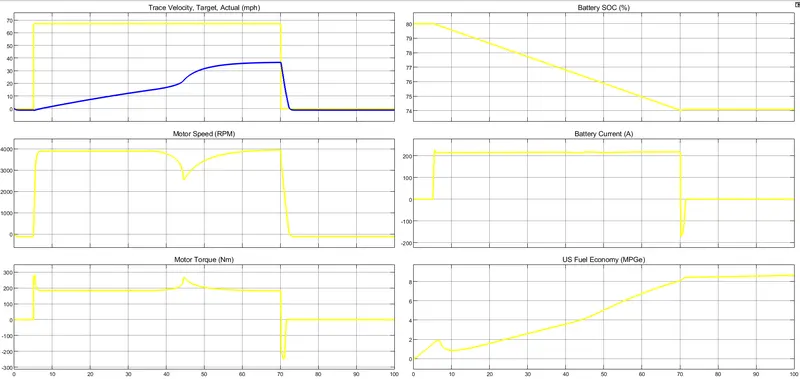
From the above results we can make the following Discussion which are as follows:
- And gradually the Actual velocity decrease further but one thing to be noted is unlike HEV, here though the Miles Per Gallon deacreses due to the increase of the values of the parameters but overall its performance is much better compared to the HEV Model and it is also justify from the subsystem point of view where in the EV subsystem it is only the Motor which is performing the entire operation but in HEV the engine subsystem comes into the scenario which ultimately degrades the fuel efficiency thereby reducing the performance from the Fuel Economy perspective.