Week-4 Challenge WOT Condition Part-2
Aim :- Study of EV & HEV architectures using MATLAB’s Powertrain Blockset.
Objectives:-
- To understand the difference between mapped and dynamic models of engine, motor and generator? How can you change the model type?
- To model calculate miles per gallon? Which factors are considered to model fuel flow?
- To simulate and Run the HEV ReferenceApplication with WOT drive cycle. Change the grade and wind velocity in the environment block. Comment on the results.
- To compare the simulated results of hybrid and pure electric powertrains.
Study 1 :-To understand the difference between mapped and dynamic models of engine, motor and generator? How can you change the model type?
Mapped engine:- It represents engine behaviour as a set of lookup tablets which are pre-fed into the system (brake torque,fuel flow,air mass flow,exhaust temperature,efficiency,and emissions) as functions of commanded load and measured engine speed.
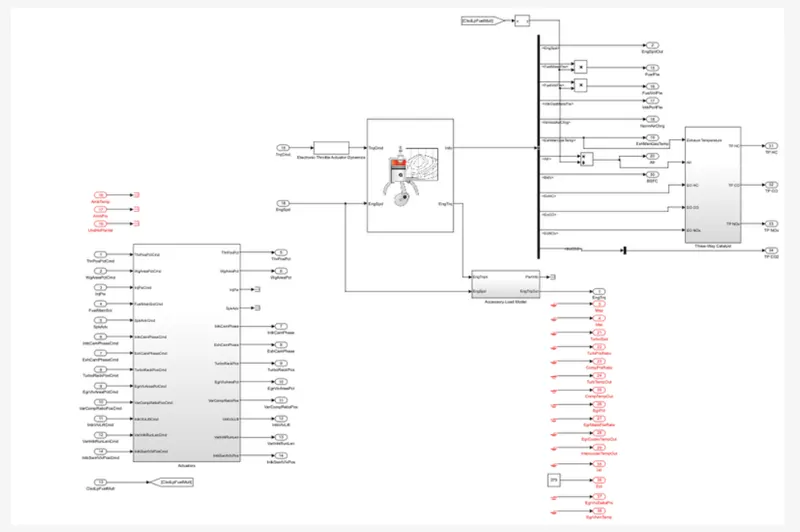
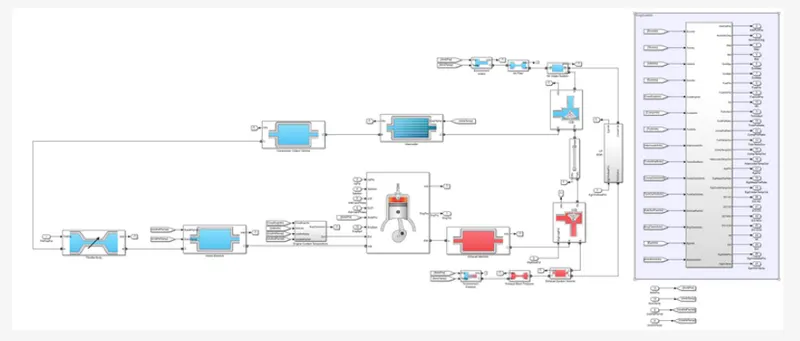
Dynamic engine:- It models engine behaviour into individual component models that account for engine dynamics, most notably intake airflow and turbocharger dynamics.
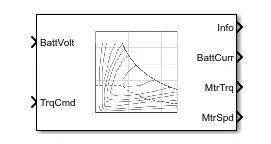
Mapped Motor:-The Mapped Motor block implements a mapped motor and drive electronics operating in torque-control mode. The output torque tracks the torque reference demand and includes a motor-response and drive-response time constant.
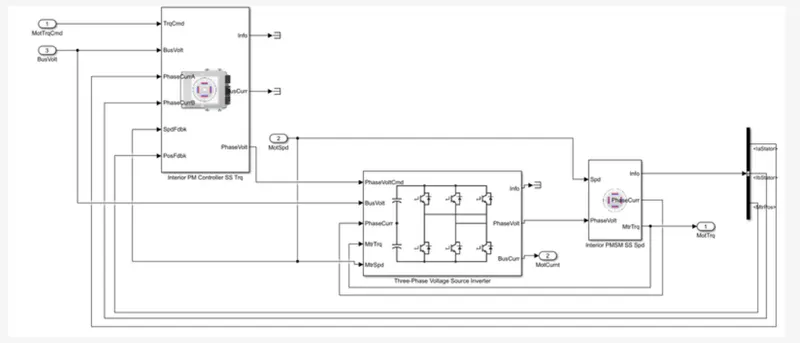
Dynamic Motor:-It represents a 3-phase interior permanent magnet synchronous motor.It uses a 3-phase input voltage source for controlling speed and torque of the motor.
Mapped Generator:-It is exactly similar to a mapped motor with lookup tables.
Dynamic Generator:-It represents a more accurate representation invoving user to input parameters just like the dynamic motor.
To change the model from mapped to dynamic:-
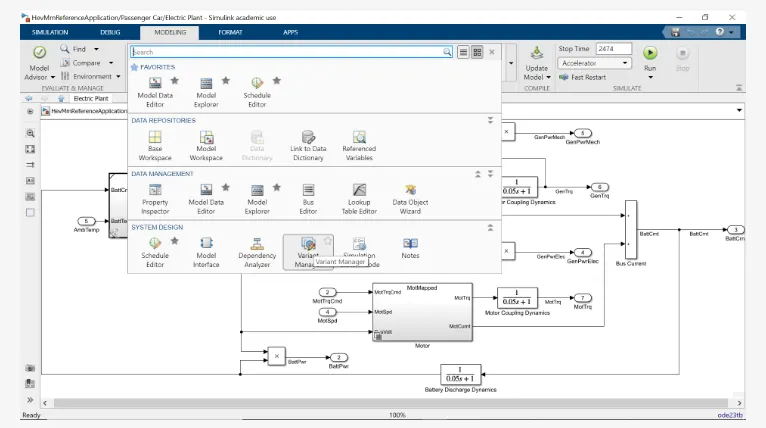
Go to modelling then variant manager.
Suppose we plan to change the generator block from mapped to dynamic. Select GenDynamic then right click,then select ‘Set as Label Model Active Choice.’ Then double click ‘GenDynamic.’
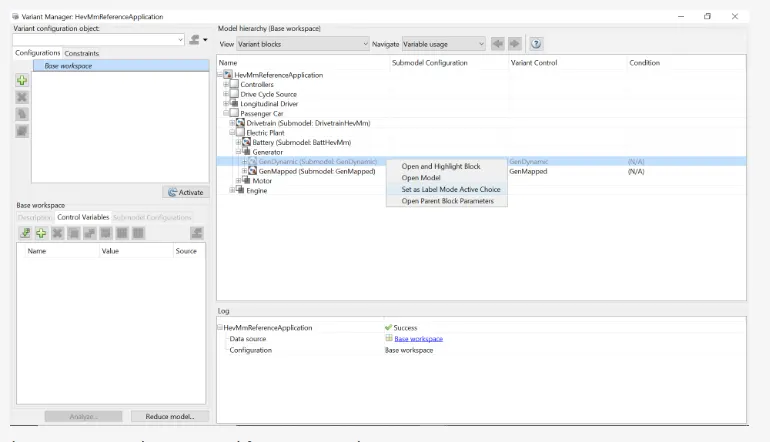
This process can be repeated for motor and engine.
Study 2 :-To model calculate miles per gallon? Which factors are considered to model fuel flow?
The fuel economy is modelled using the performance calculations block in the reference application.
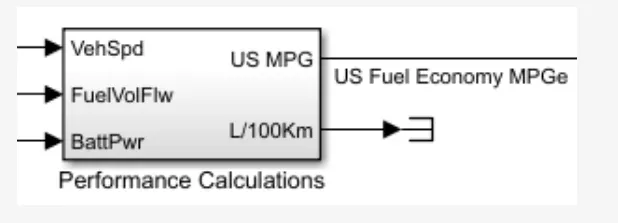
MPG:-
In Conventional IC engine vehicles MPG stands for miles per gallon,used to show how far your vehicle is able to travel for every gallon (4.55 litres) of fuel it uses. So higher a car’s MPG, the more fuel efficient it is.
MPGe:-
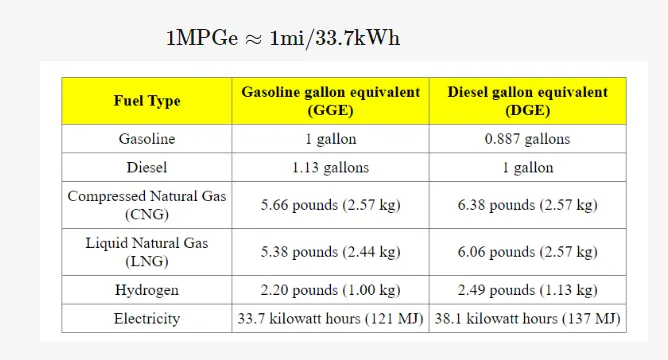
MPGe stands for “miles per gallon of gasoline-equivalent.”It’s an energy efficient metric that was introduced by the Environment Protection Agency (EPA) in 2010 to compare the amount of energy consumed by alternative fuel vehicles to that of conventional fuel vehicles.
According to EPA,burning of one gallon gasoline produces 115,000 BTUs and to generate the same amount of heat we will need 33.7 kwh electricity.
Study 3:-To simulate and Run the HEV ReferenceApplication with WOT drive cycle. Change the grade and wind velocity in the environment block. Comment on the results.
HEV Powertrain Configuration:-
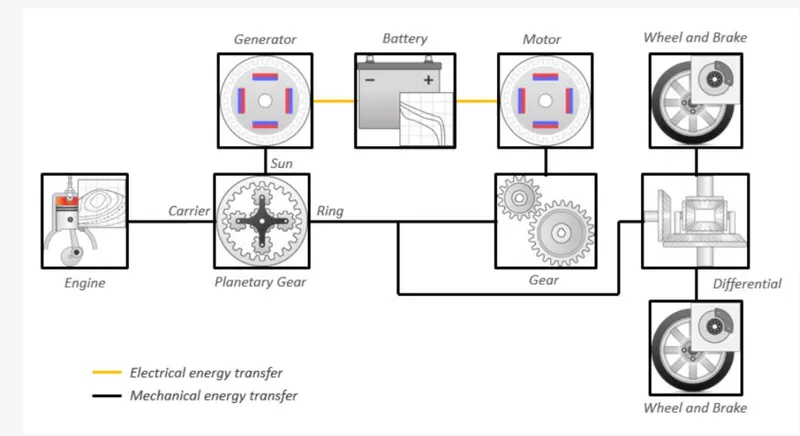
HEV Reference Powertrain Configuration:-
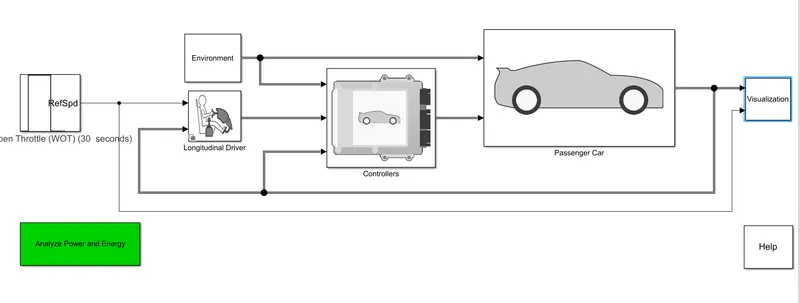
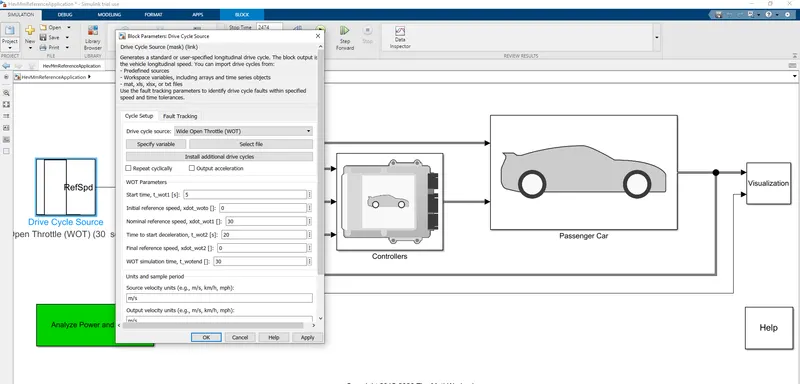
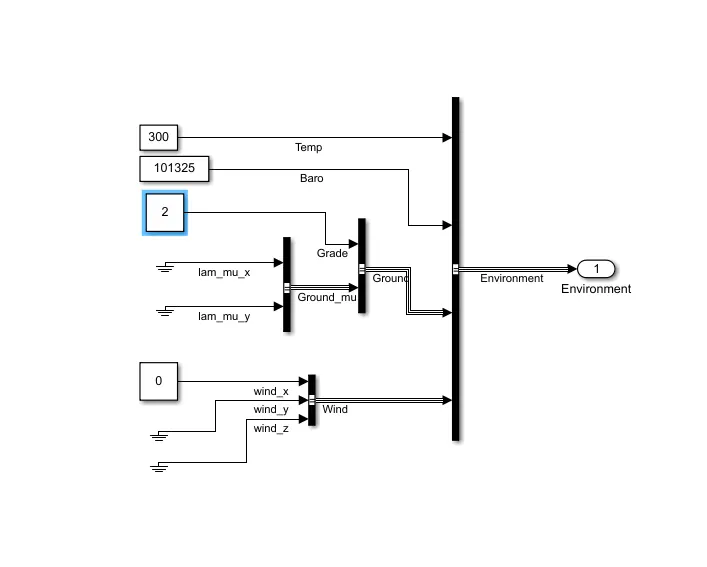
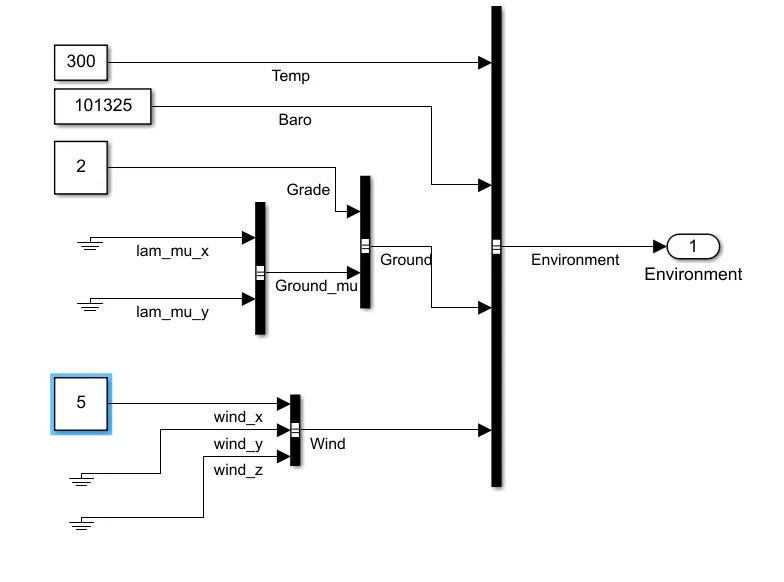
Change the Grade and wind Values
The following graphs output for WOT:-
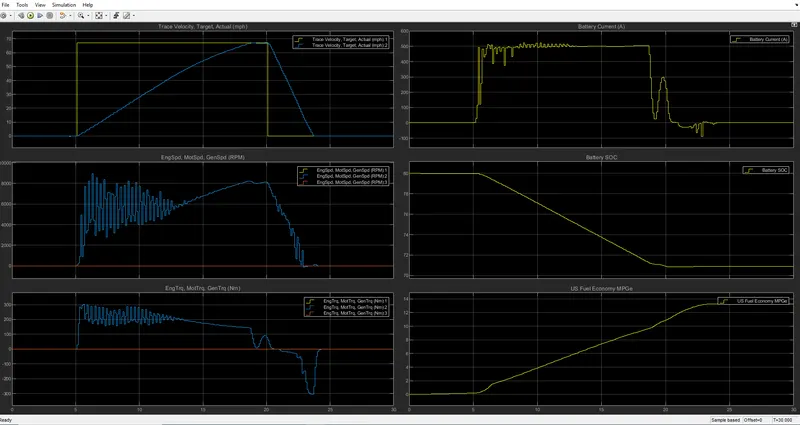
Explanation on the above graph:-
- Trace velocity reaches the maximum waypoint actual graph indicating that the battery power was sufficient to overcome the given gradeability and wind
- The battery current is increasing when the vehicle is accelerating and is constant when the acceleration is constant
- The battery gets discharged while accelerating from SOC from 80 to 70 %
- engine/generator RPMs remains constant throughout the drive cycle.
- MPGe was reduced when the vehicle encountered increased grade and wind velocity.
Study 4 :-To compare the simulated results of hybrid and pure electric powertrains.
Now keeping the EV with WOT drive cycle.Now placing the values Wind velocity 5 m/s and grade 2 degrees
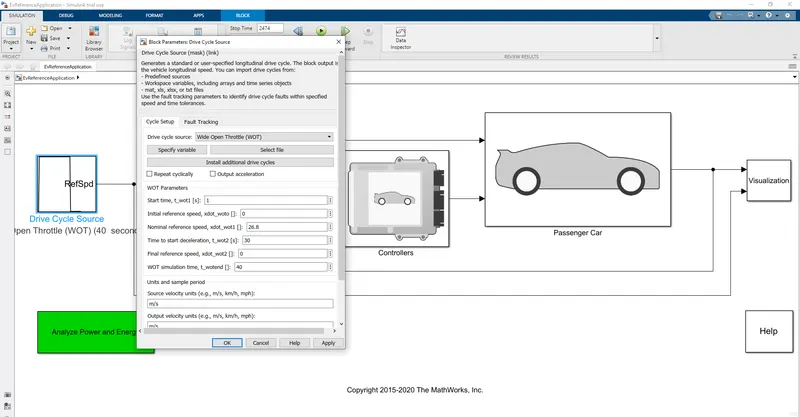
change the grade and wind velocity values
Now the EV graph with WOT is Shown Below:-
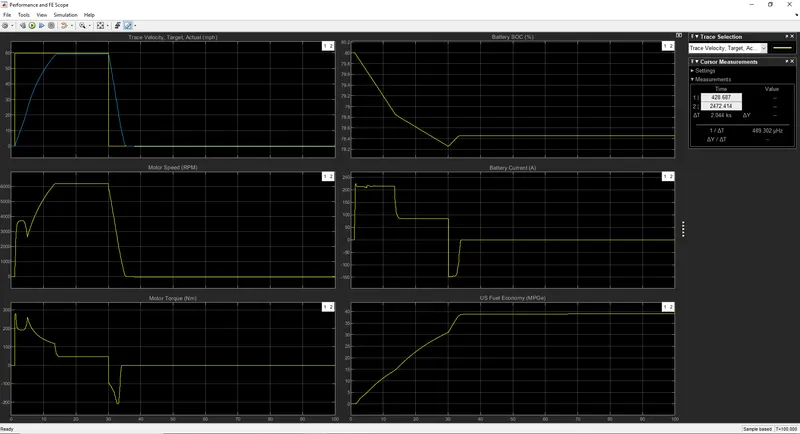
Now comparing the HEV and EV graphs :-
- EVs achieve lower maximum speed than HEVs
- Fuel economy of EV is more than HEVs