WOT Condition
Q1. What is the difference between mapped and dynamic model of engine, motor and generator? How can you change model type?
Ans.
The difference between the mapped and dynamic model of the engine is as follows
| Type | Implementation | When to use | |
|
Mapped
|
CiMappedEngine SiMappedEngine
|
The model uses a set of steady-state lookup tables to characterize engine performance. | If you have engine data from a dynamometer or a design tool like GT-POWER. |
| The tables provide overall engine characteristics, including actual torque, fuel flow rate, BSFC, and engine-out exhaust emissions. | For quasi-steady-state engine simulations. | ||
|
Dynamic
|
CiEngine SiEngine
|
The model decomposes the engine behavior into engine characteristics that are separated into lower-level components. By combining components in this way, the models capture the dynamic effects.
|
If you need a more detailed dynamic model and have component-level data. |
| To analyze the impact of individual engine components on the overall performance. | |||
To change the model type of the engine/motor/generator, the following steps have to be performed in sequence
1. Open the EV reference model
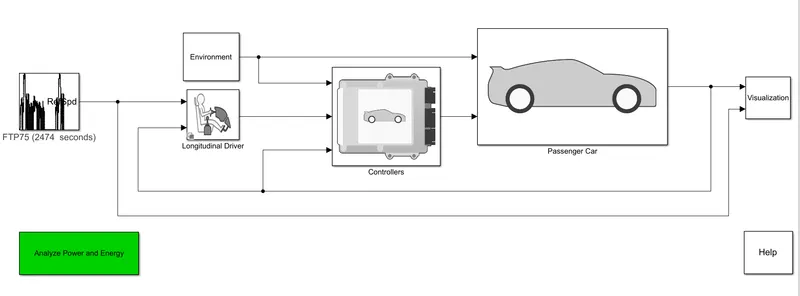
2. Go to Passenger Car subsystem
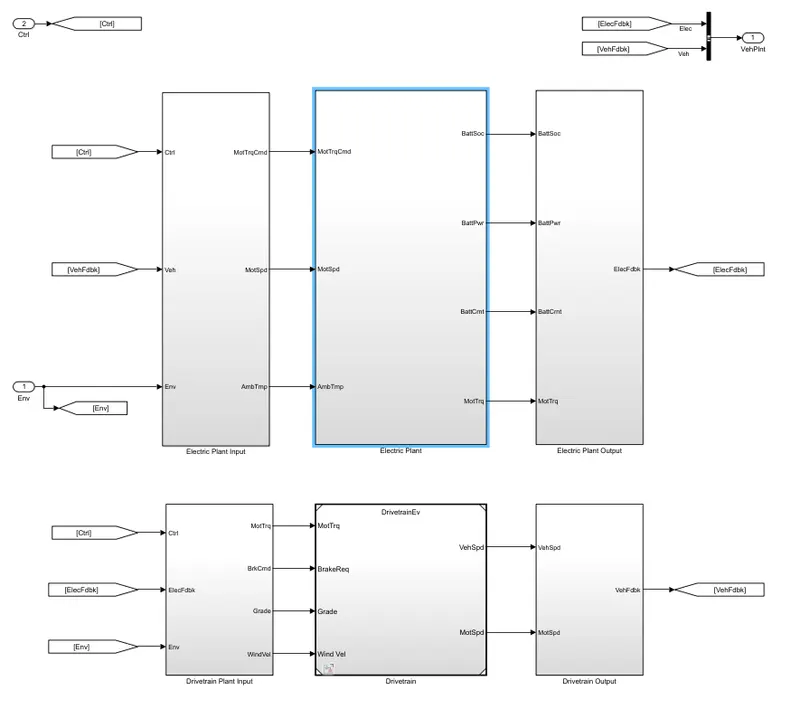
3. Go to Engine Plant subsystem
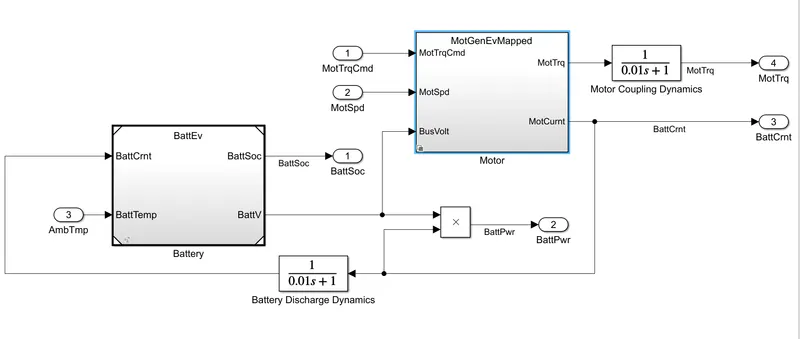
4. Go to Motor subsystem
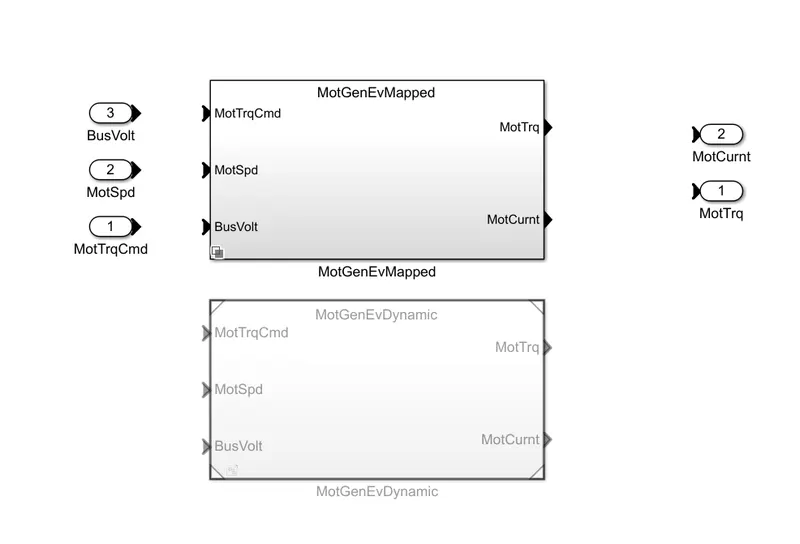
As we can see the model of motor is set as mapped by default, we need to change it to a dynamic model.
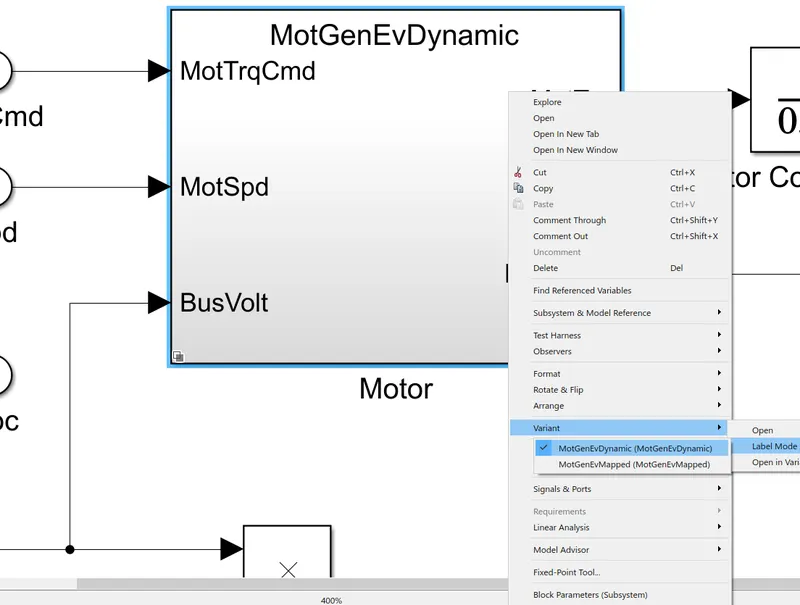
5. Go back to the engine plant subsystem, right-click on the Motor block, go to the variant section, label mode, and finally select MotGenEvDynamic (MotGenEvDynamic) to change the model.
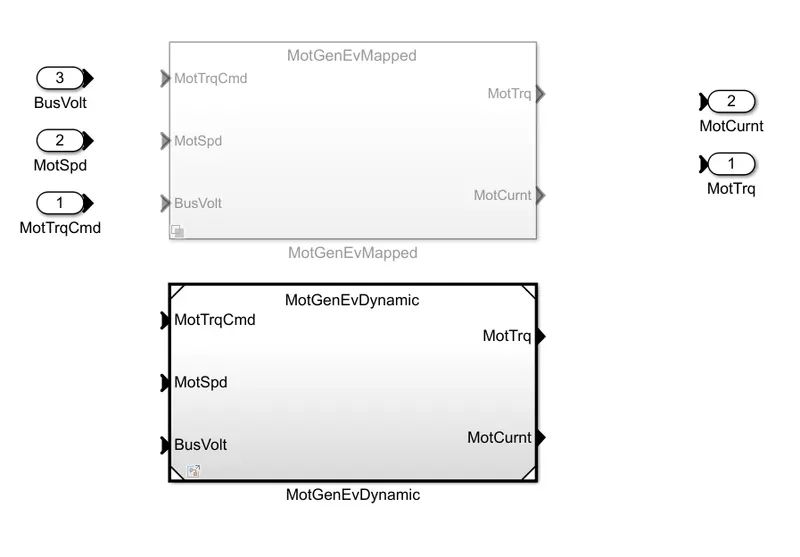
6. Now again go to the Motor subsystem and see that the model is now changed from mapped to dynamic
Q2. How does the model calculate miles per gallon? Which factors are considered to model fuel flow?
Ans.
To calculate the miles per gallon consumed by the HEV, the reference model has a Simulink system for it. To view that system go to the Visualization subsystem and then go to Power Calculations.
The following figure shows the system to calculate the miles per gallon.
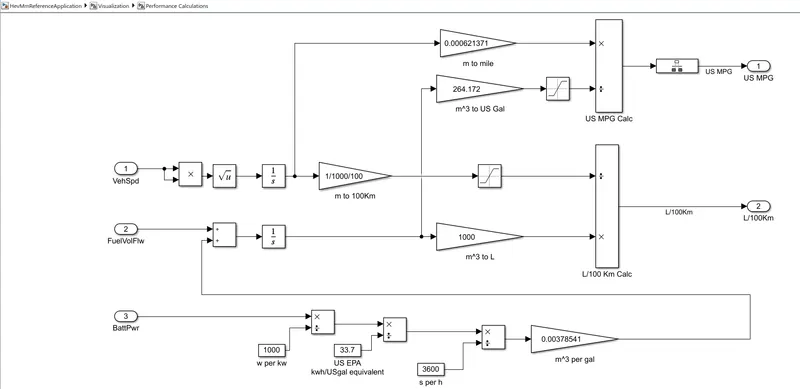
As we can see there are three inputs and two outputs in the system.
1. Battery power input: The power input is in watts, therefore it is first converted into kilowatts by dividing it by 1000 by using a product and divider block and the product is then further divided by a constant of 33.7 by using a product and divider block again and the product is then further divided by 3600, i-e 3600 secs or 1 hr, by using again the product and divider block to convert it into energy represented by KW/Hr and the product is then given to the gain block. The whole operation is then given as an input to the sum block with another following input.
2. Fuel Volume Flow: Fuel volume input is in `m^3`, this input and the battery power output is added with the help of a sum block and the addition is then integrated and a gain is applied to convert `m^3` into liters and is further given to the product and divider block.
3. Vehicle speed input: Speed input is in km/hr, it is then self-multiplied to avoid negative input to the system and then by using square root it is brought back to the initially given input. Then we obtain the displacement after integrating the speed input and further using gain to convert m into km. Finally, it is fed to the product and divider block by passing it through the saturation block and then we obtain the output in L/100 km.
To obtain the output in Miles per gallon, the fuel volume input is converted to US gallon by giving it to gain and the displacement is converted to miles by again using a block. Both are fed to the product and divider block and the output is obtained in miles/gallon.
Q3. Run the HEV ReferenceApplication with WOT drive cycle. Change the grade and wind velocity in the environment block. Comment on the results.
Ans.
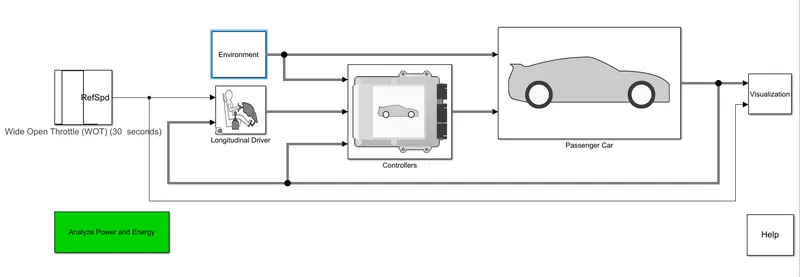
The following figure shows the HEV reference model with WOT drive cycle
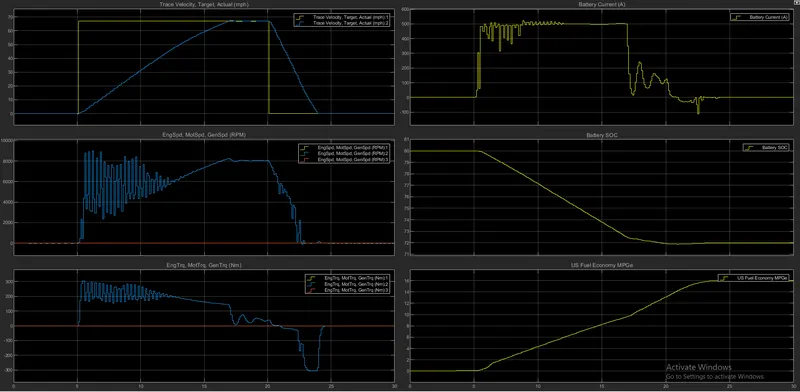
After running the simulation at default conditions, we get the following results
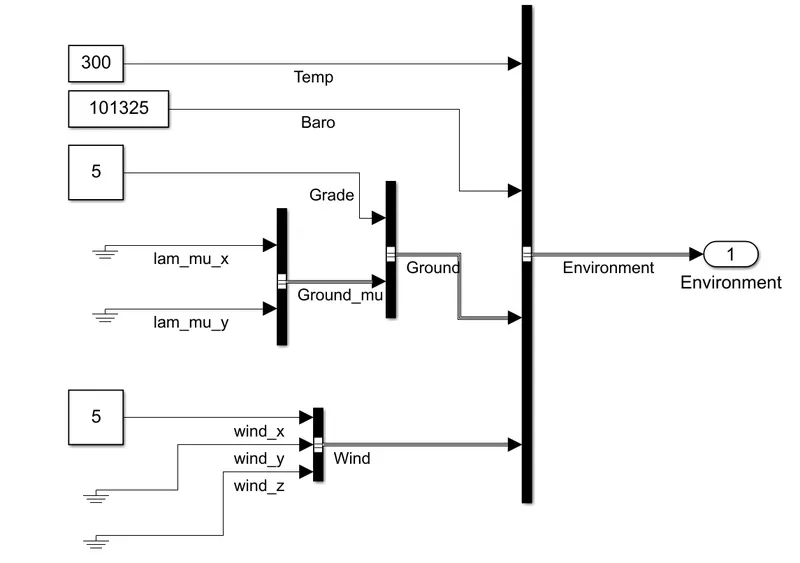
Now, changing the values of wind velocity and grade to 5 each in the environment block.
Now, after simulating these changed parameters, we get the following results
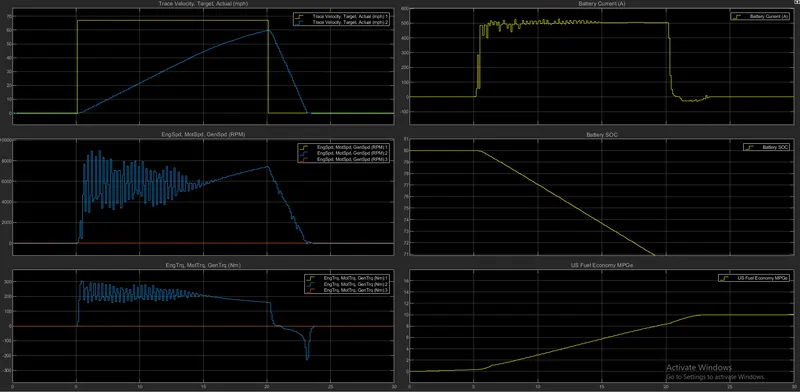
Results:
| Sr. No. | Parameters | Default conditions | With changed environment values |
| 1 | Max Velocity(MPH) | 67 | 60 |
| 2 | Engine speed at 20 secs (RPM) | 8000 | 7200 |
| 3 | Reverse Engine torque (Nm) | -305 | -220 |
| 4 | Battery current | Drops down at 16.5 secs | Drops down at 20.5 secs |
| 5 | Battery SOC(%) | Constant at 72 | Constant at 70 |
| 6 | Max US fuel economy (MPG) | 16 | 10 |
Q4. Keeping all other parameters same, compare the simulated results of hybrid and pure electric powertrains.
Ans.
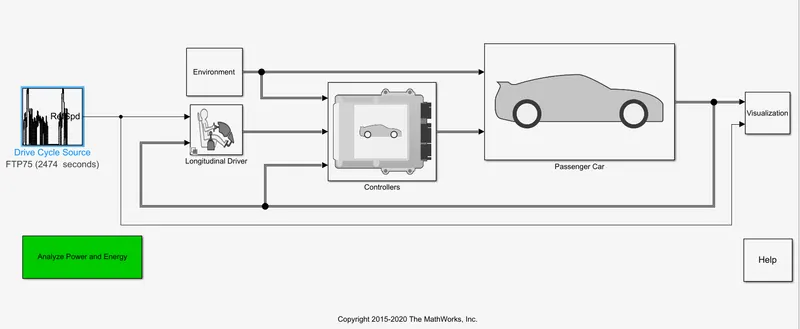
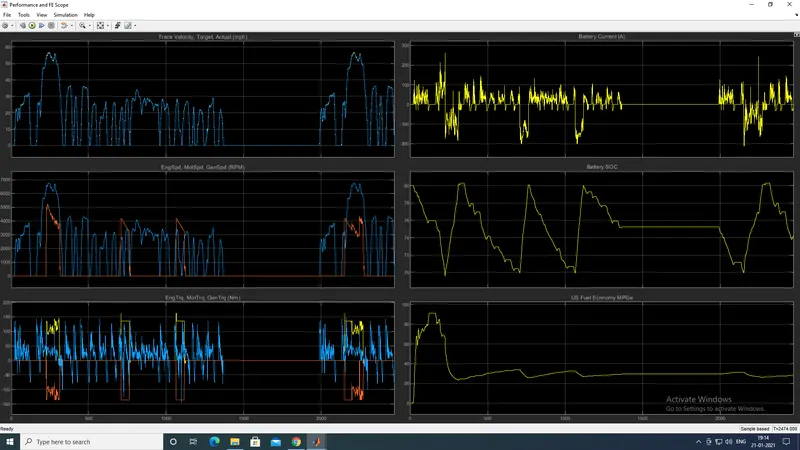
The following figure shows the HEV reference model using FTP drive cycle
The following results are obtained after simulating at default conditions
The following figure shows the EV reference model using FTP drive cycle
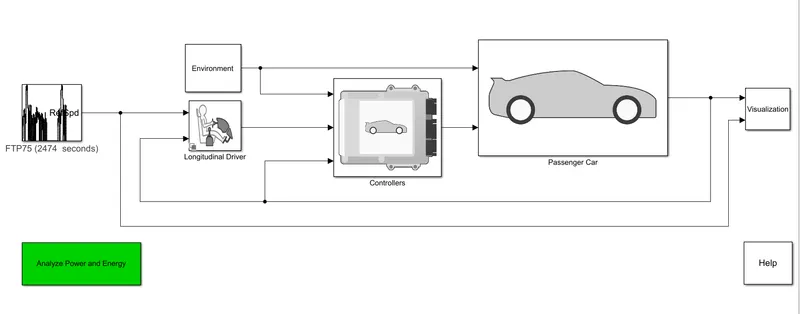
The following results are obtained after simulating at default conditions
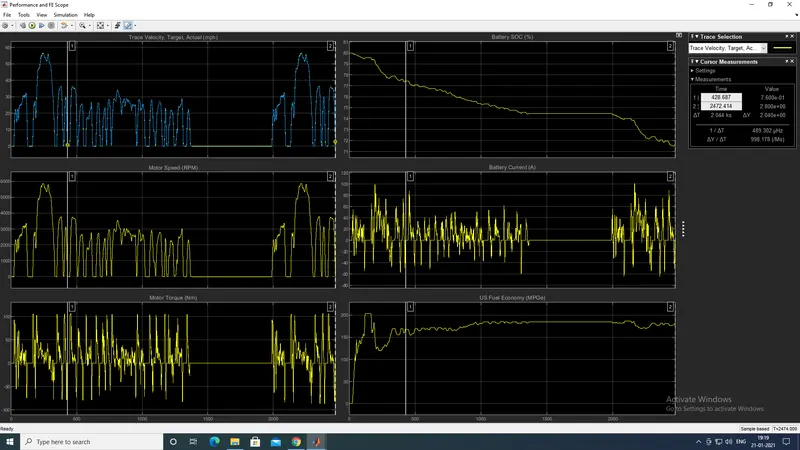
Results:
| Sr. no. | Parameters | HEV | EV |
| 1 | Max Velocity (MPH) | 58 | 57 |
| 2 | Max Engine speed (RPM) | 5950 | 6900 |
| 3 | Max Engine torque (Nm) | 0 | 148 |
| 4 | Max motor torque (Nm) | 105 | 160 |
| 5 | Max battery current (A) | 100 | 260 |
| 6 | Battery SOC | Drops down to 70.5% | Constantly charging and discharging between 70-80% |
| 7 | US fuel economy (MPG) | 205 | 90 |