Gear Shifter Simulator
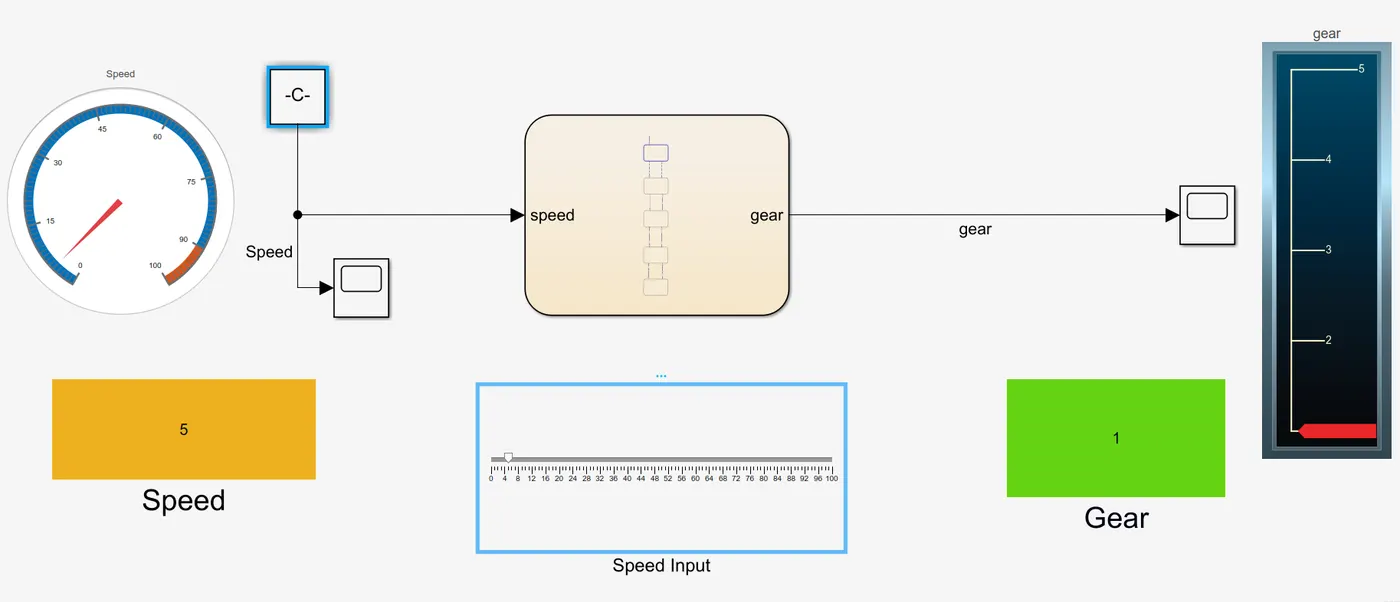
1) Aim - To simulate a gear shifter by giving speed as input.
Objective - Make a Simulink chart to simulate a gear shifter as per below conditions:
| Speed Range (kmph) | Gear |
| 0 to 15 | 1 |
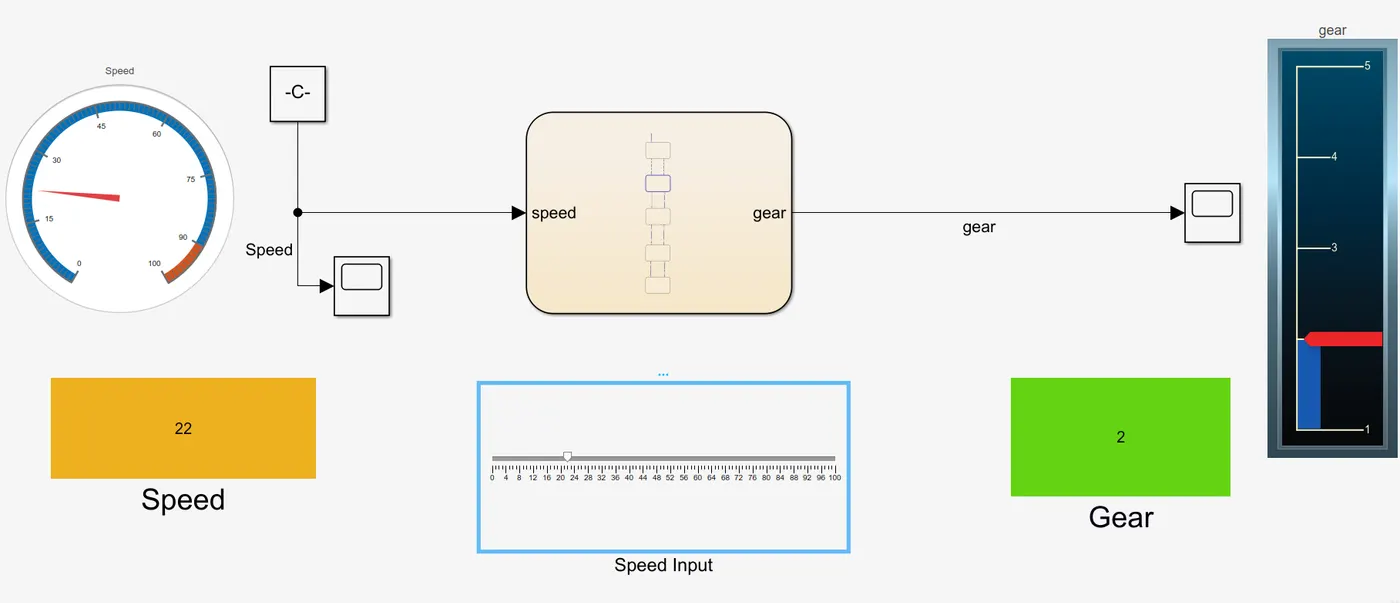
| 16 to 25 | 2 |
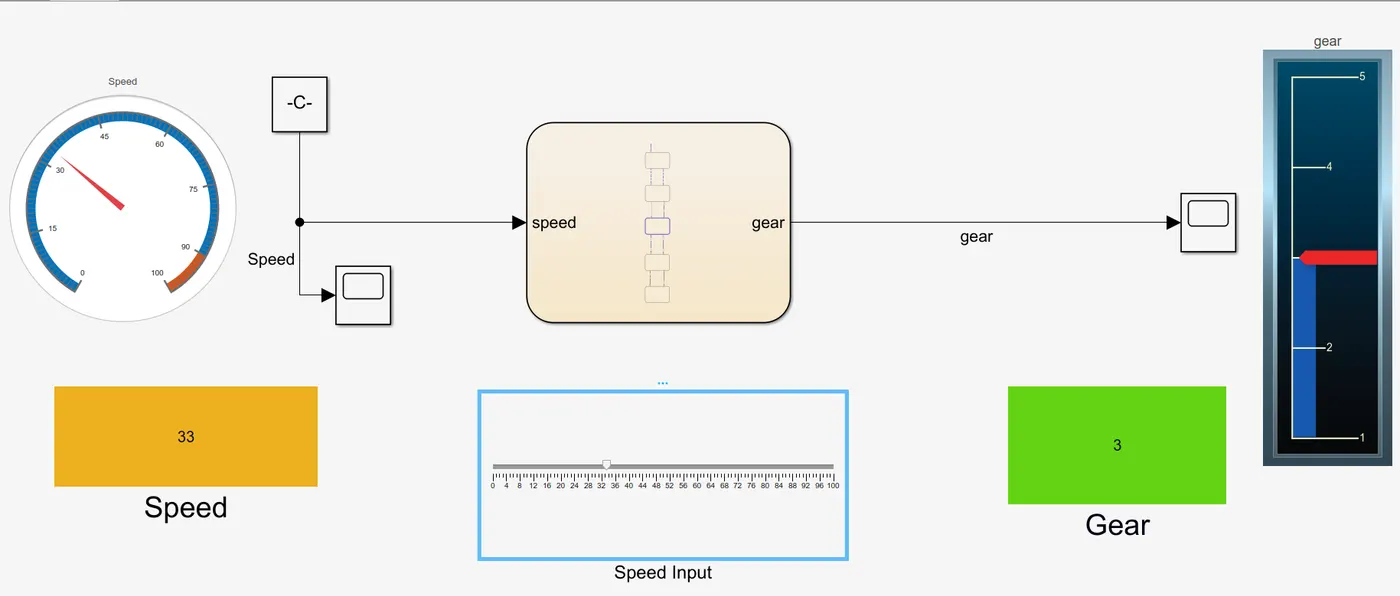
| 26 to 40 | 3 |
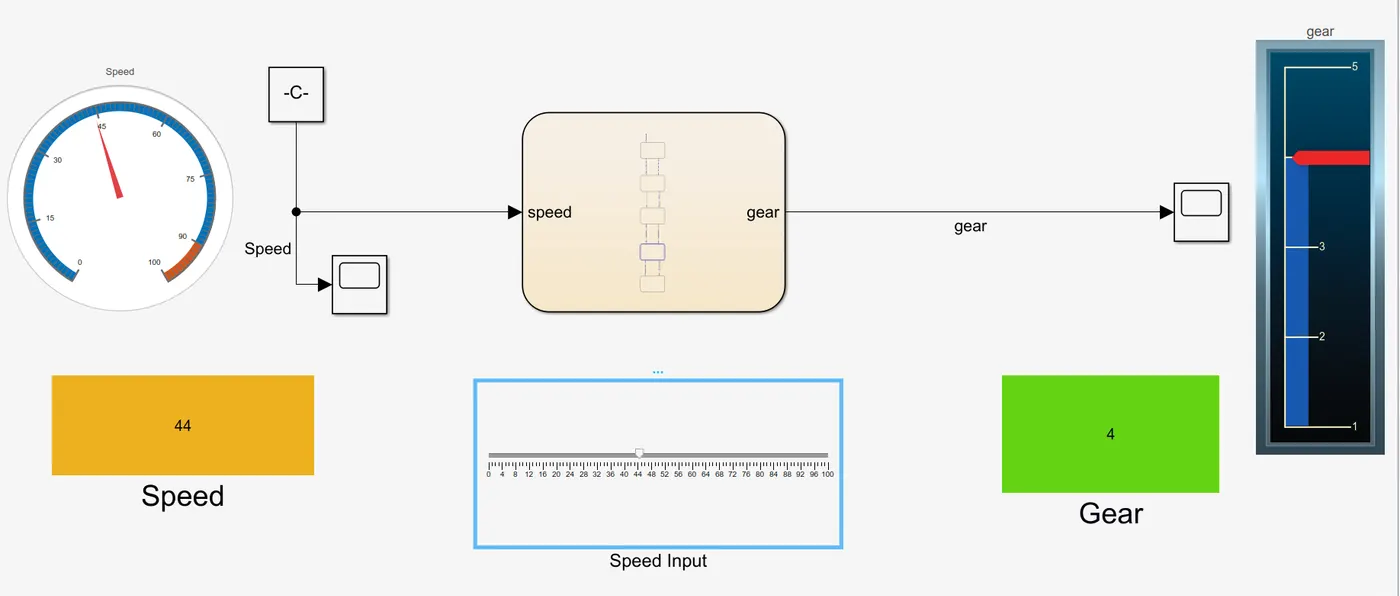
| 41 to 60 | 4 |
| Above 61 | 5 |
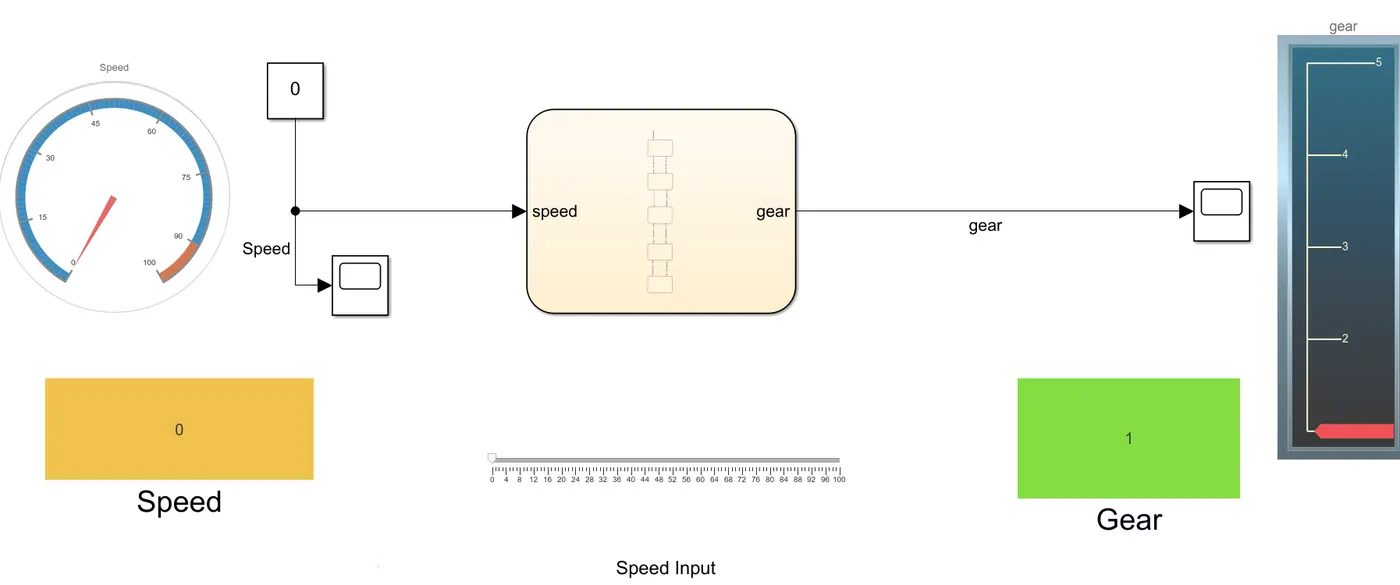
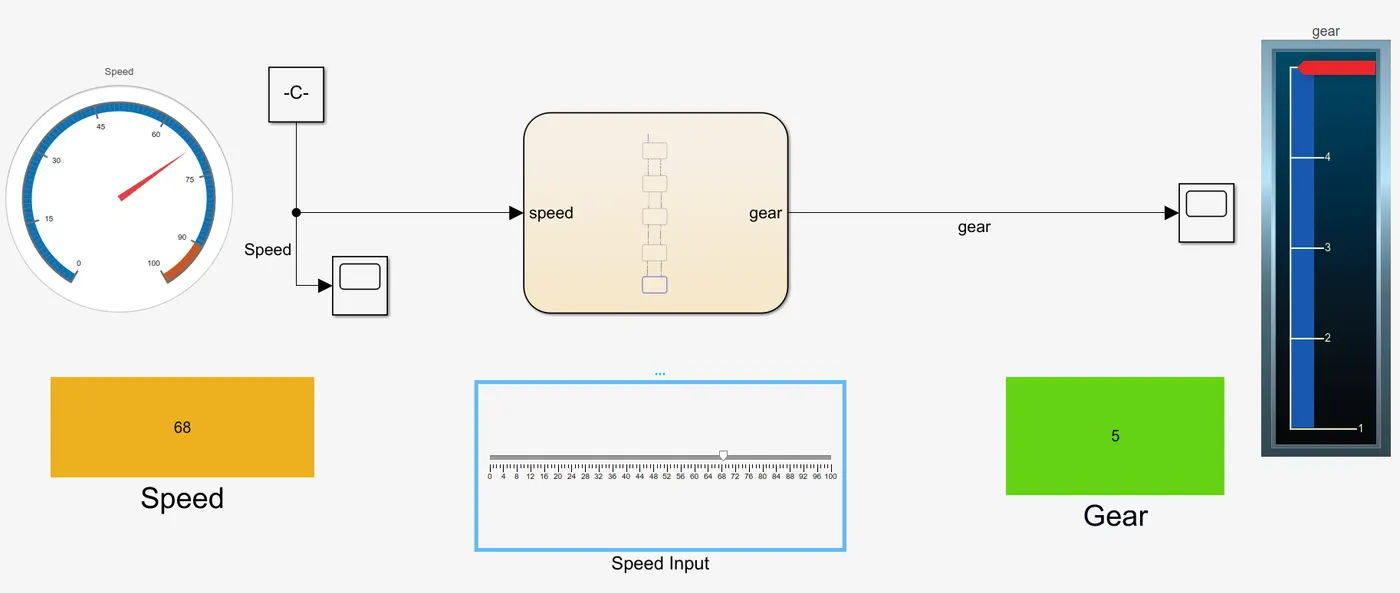
Final Model :
Simulink Model :
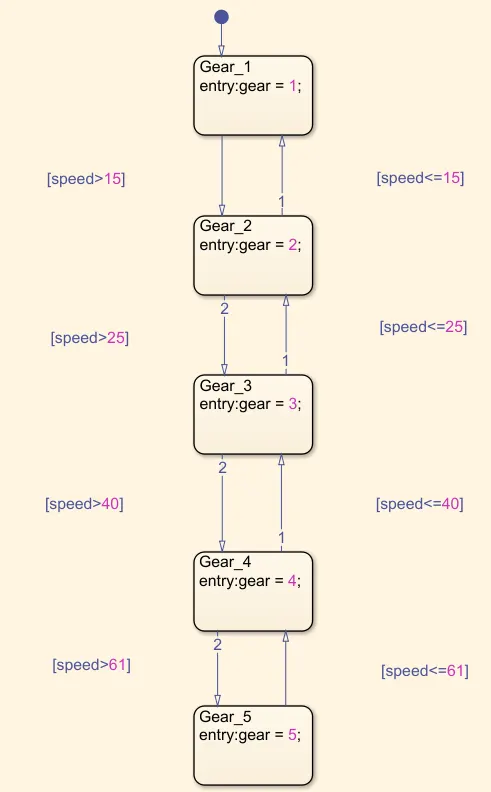
Stateflow Chart :
Procedure :
- Create a Stateflow chart for the given speed and gear correlation, such that speed (kmph) is the input and gear is the output value.
- Connect a slider gain to chart's input, ranging from 0 to 100 along with a constant.
- Connect a Gauge and a Display for displaying the speed data.
- Connect a Vertical Gauge and a Display for the gear data.
Explanation :
- The simulation time is set to 'inf' (infinity).
- After starting the simulation, the slider gain is used to give the input (speed).
- This speed data is displayed by a Display and a Gauge.
- This input goes to the Stateflow chart which gives the output in form of gear's numerical value according to its logic.
- This output data is displayed by a Display and a Vertical Gauge.
- The simulation is manually stopped when desired.
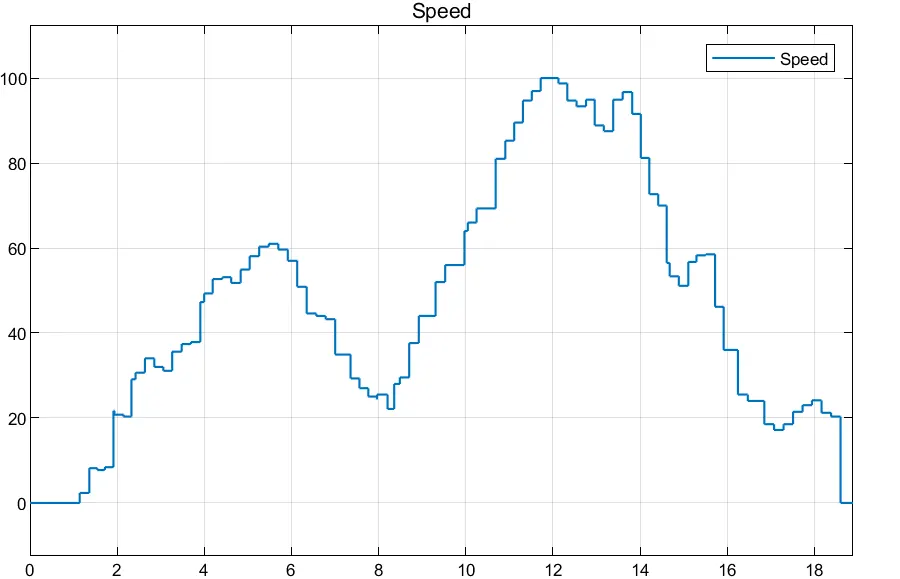
Input (Speed) :
Here is the speed input from the slider as observed from a scope:
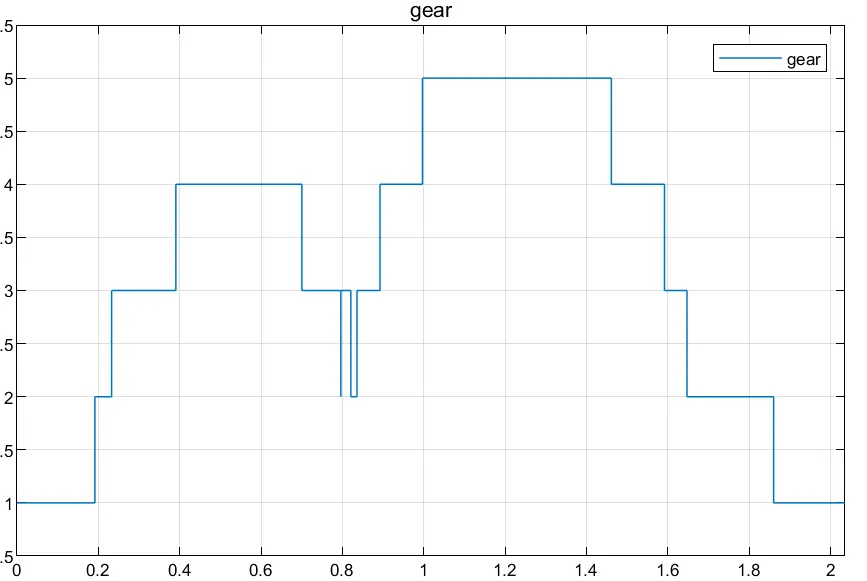
Output (Gear) :
Here is the output (gear) as observed from a scope:
Result :
Gear 1: (Speed 1 to 15)
Gear 2: (Speed 16 to 25)
Gear 3: (Speed 26 to 40)
Gear 4: (Speed 41 to 60)
Gear 5: (Speed above 71)
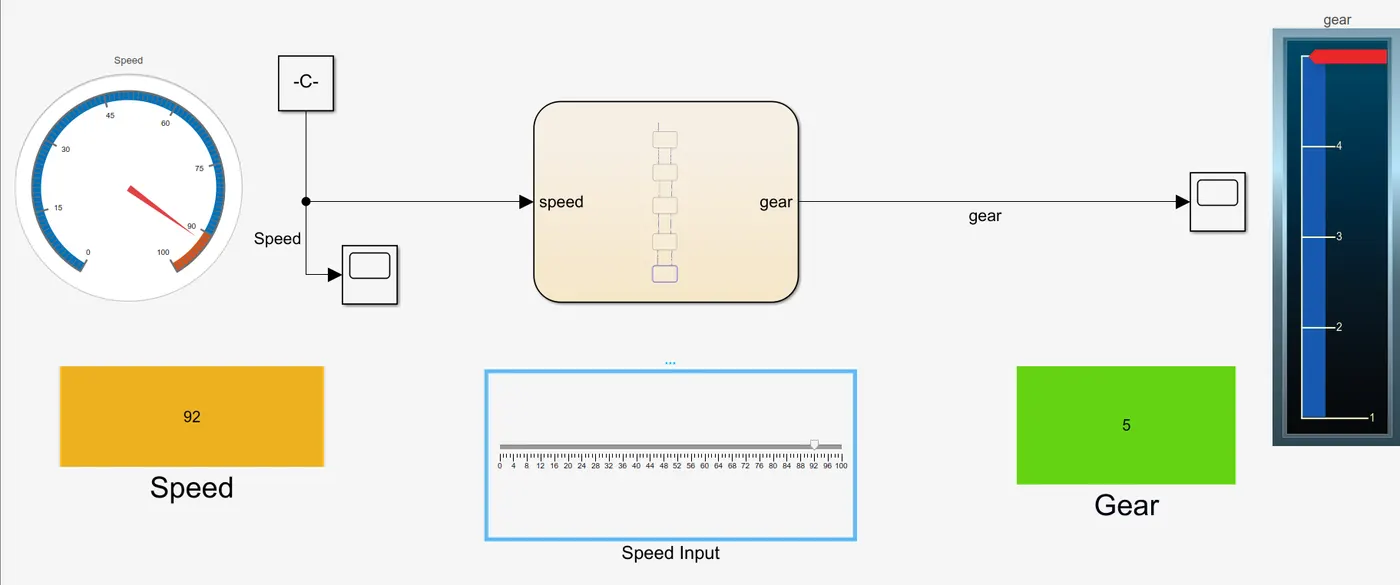
Overspeeding : (Speed above 90)
Conclusion :
The simulation of gear shifter for the given correlational data between speed and gear is completed.