Parsing NASA's Thermodynamic Data
Aim:
Write a Matlab program to parse Thermodynamic data of NASA and calculate and plot enthalpy, entropy and specific heat of each molecule.
Governing Equations:
The formulae to calculate to the TD properties are as follows:
- Specific Heat (at constant pressure)
`C_p/R = a_1 + a_2T + a_3T^2 + a_4T^3 + a_5T^4`
- Enthalpy
`H/(RT) = a_1 + a_2T/2 + a_3T^2/3 + a_4T^3/4 + a_5T^4/5 + a_6/T`
- Entropy
`S/R = a_1lnT + a_2T + a_3T^2/2 + a_4T^3/3 + a_5T^4/4 + a_7`
Here R is the universal gas constant: `R = 8.3145` `J.mol^-1.K^-1`
NASA’s Thermodynamic Data:
In this data,there are a total of 53 molecules and the explanation of the pattern in which data is stored for each molecule is below: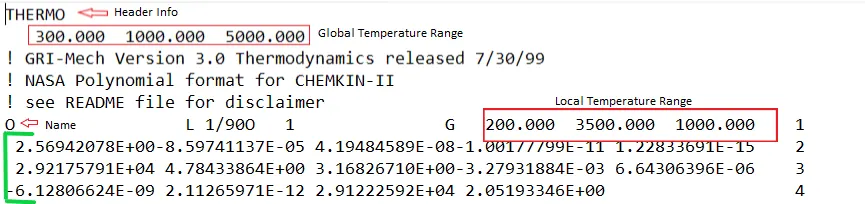
- Here the first line contains the header information and the second line contains the global temperature range.
- The next three lines also contain the header information.
- Next, there are four lines in which the first one contains the molecule or element’s name and their local temperature range.
- The next three lines contain the temperature coefficients the particular molecule or element such that the first seven coefficients are for the lower temperature and the next seven are for the higher temperature.
- Similarly, there are 52 other molecules and elements containing the above information in the same format.
Objectives:
- Extract the fourteen temperature coefficients for each molecule.
- Extract the local temperature range for each molecule.
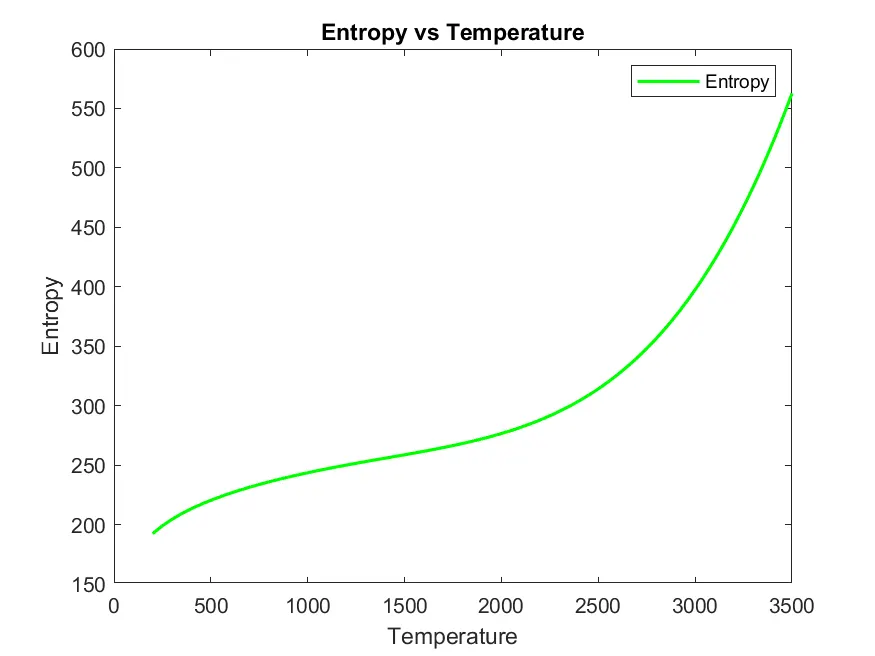
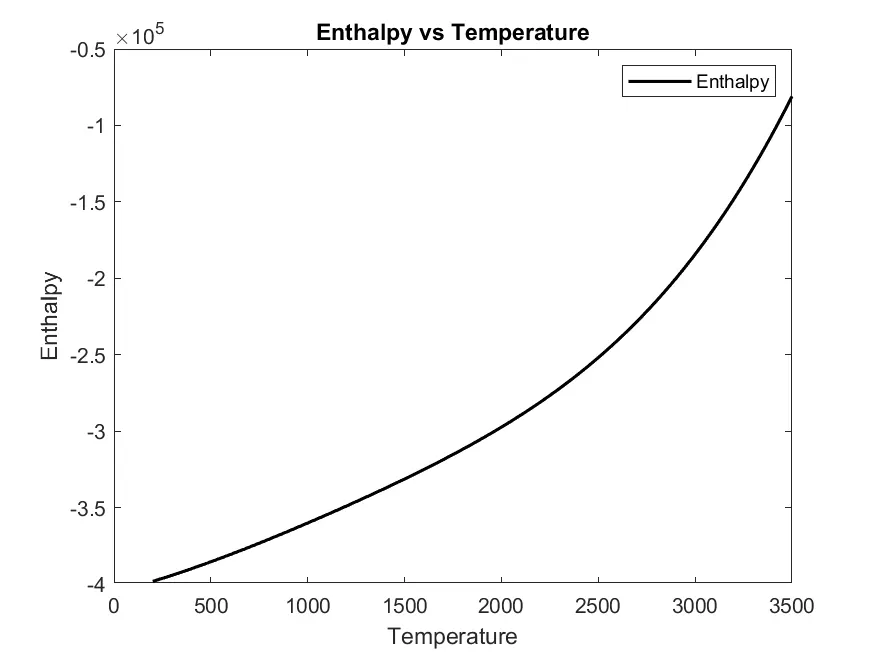
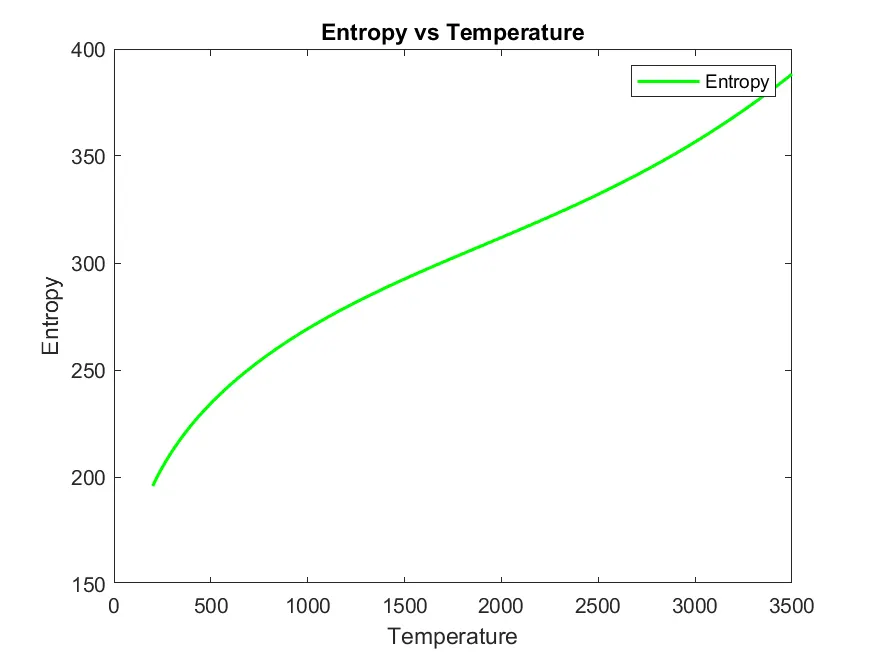
- Calculate entropy for each molecule and plot it against its temperature range.
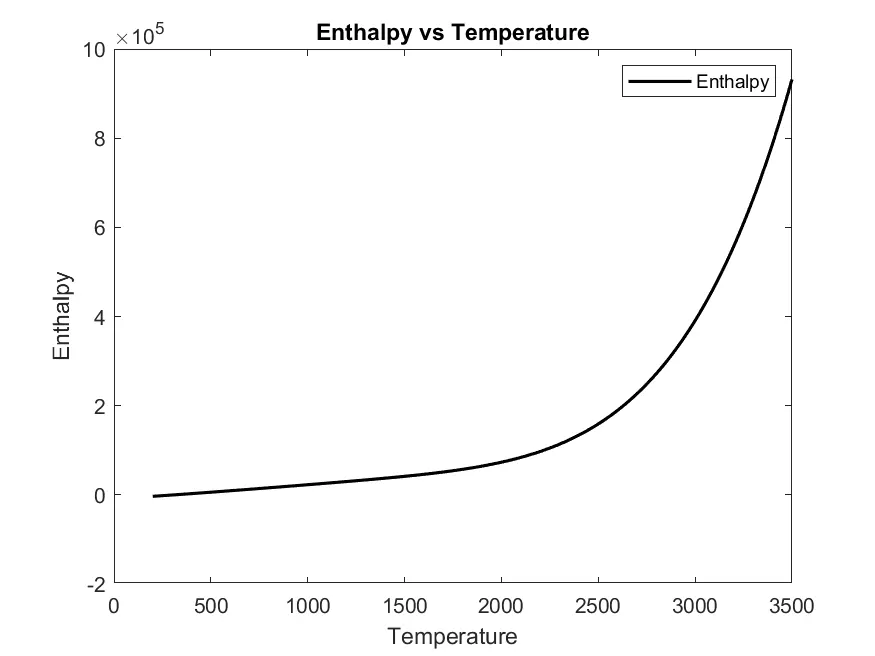
- Calculate enthalpy for each molecule and plot it against its temperature range.
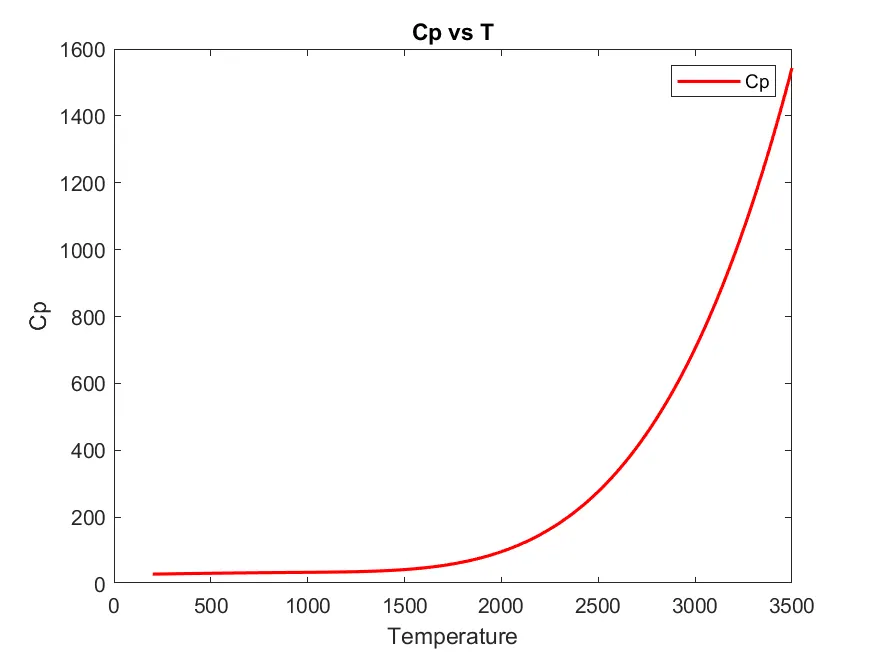
- Calculate specific heat for each molecule and plot it against its temperature range.
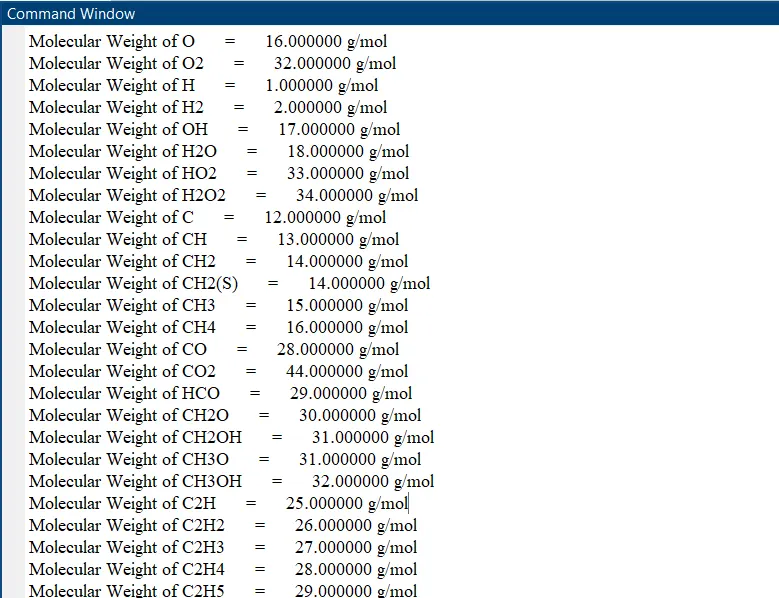
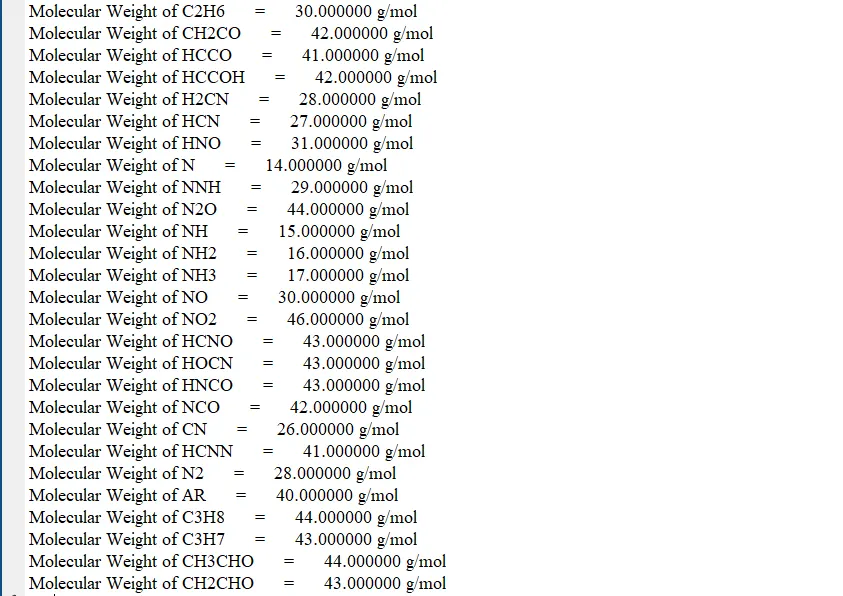
- Calculate the molecular weight of each molecule and display them in the command window.
Program:
There are four function programs and one main program.
- For all these functions the temperature range is defined in two parts, lower temperature range (lower to medium temperature) and higher temperature range (medium to higher temperature).
- For these three functions, the values of lower and higher temperature coefficients are used with lower and higher temperature range respectively.
- Each of these three functions provides also provides a plot between the particular Thermodynamic property and the temperature range.
Specific Heat Function:
%% Description
%
% This a program for a function to calculate the specific heat at constant pressure for a particular species.
%
%% Output
%
% Specific heat
% plot of Specific heat vs Temperature
%% Program

function [Cp] = specific_heat(lower_temp,medium_temp,higher_temp,al1,al2,al3,al4,al5,ah1,ah2,ah3,ah4,ah5)

R = 8.314;                                                          % universal gas constant

lower_temp_range = linspace(lower_temp,medium_temp,200);            % lower temp range from lower to medium temperature
higher_temp_range = linspace(medium_temp + 1,higher_temp,200);      % higher temp range from medium to higher temperature

% calculating specific heat for lower temperature range
for i = 1:length(lower_temp_range)
    Cp_l(i) = (al1 + al2*lower_temp_range(i) + al3*lower_temp_range(i)^2 + al4*lower_temp_range(i)^3 + al5*lower_temp_range(i)^4) * R;
end

% calculating specific heat for higher temperature range
for i = 1:length(higher_temp_range)
    Cp_h(i) = (ah1 + ah2*higher_temp_range(i) + ah3*higher_temp_range(i)^2 + ah4*higher_temp_range(i)^3 + ah5*higher_temp_range(i)^4) * R;
end


temp_range = [lower_temp_range,higher_temp_range];         % Combining temperature values
Cp = [Cp_l,Cp_h];                                          % combining specific heat values

% Plotting specific heat vs temperature
plot(temp_range,Cp,'linewidth',1.5,'color','r')
title('Cp vs T');
xlabel('Temperature');
ylabel('Cp');
legend('Cp');
end
Enthalpy Function:
%% Description
%
% This a program for a function to calculate the enthalpy using the temperature coefficients
%
%% Output
%
% Enthalpy
% plot of Enthalpy vs Temperature
%
%% Program

function [H] = enthalpy(lower_temp,medium_temp,higher_temp,al1,al2,al3,al4,al5,al6,ah1,ah2,ah3,ah4,ah5,ah6)

R = 8.314;                                                          % universal gas constant

lower_temp_range = linspace(lower_temp,medium_temp,200);            % lower temp range from lower to medium temperature
higher_temp_range = linspace(medium_temp + 1,higher_temp,200);      % higher temp range from medium to higher temperature

% Calculating enthalpy for lower temperature range
for i = 1:length(lower_temp_range)
    H_l(i) = (al1*lower_temp_range(i) + (al2*lower_temp_range(i)^2)/2 + (al3*lower_temp_range(i)^3)/3 + (al4*lower_temp_range(i)^4)/4 ...
             + (al5*lower_temp_range(i)^5)/5 + al6)*R;
end

% calculating enthalpy for higher temperature range
for i = 1:length(higher_temp_range)
    H_h(i) = (ah1*higher_temp_range(i) + (ah2*higher_temp_range(i)^2)/2 + (ah3*higher_temp_range(i)^3)/3 + (ah4*higher_temp_range(i)^4)/4 ...
             + (ah5*higher_temp_range(i)^5)/5 + ah6)*R;
end


temp_range = [lower_temp_range,higher_temp_range];         % combining lower and higher temperature ranges
H = [H_l, H_h];                                            % combining enthalpy for lower and higher temperature ranges


% plotting enthalpy vs temperature
plot(temp_range,H,'linewidth',1.5,'color','k')
title('Enthalpy vs Temperature');
xlabel('Temperature');
ylabel('Enthalpy');
legend('Enthalpy');
end
Entropy Function:
%% Description
%
% This a program for a function to calculate the entropy using the temperature coefficients.
%
%% Output
%
% Entropy
% plot of Entropy vs Temperature
%
%% Program

function [S] = entropy(lower_temp,medium_temp,higher_temp,al1,al2,al3,al4,al5,al7,ah1,ah2,ah3,ah4,ah5,ah7)

R = 8.314;                                                          % universal gas constant

lower_temp_range = linspace(lower_temp,medium_temp,200);            % lower temp range from lower to medium temperature
higher_temp_range = linspace(medium_temp + 1,higher_temp,200);      % higher temp range from medium to higher temperature

% calculating entropy for lower temperature range
for i = 1:length(lower_temp_range)
    S_l(i) = (al1*log(lower_temp_range(i)) + al2*lower_temp_range(i) + (al3*lower_temp_range(i)^2)/2 + ...
             (al4*lower_temp_range(i)^3)/3 + (al5*lower_temp_range(i)^4)/4 + al7)*R;
end

% calculating entropy for higher temperature range
for i = 1:length(higher_temp_range)
    S_h(i) = (ah1*log(higher_temp_range(i)) + ah2*higher_temp_range(i) + (ah3*higher_temp_range(i)^2)/2 + ...
             (ah4*higher_temp_range(i)^3)/3 + (ah5*higher_temp_range(i)^4)/4 + ah7)*R;
end


temp_range = [lower_temp_range,higher_temp_range];       % combining temperature value
S = [S_l, S_h];                                          % combining entropy values

% Plotting entropy vs temperature
plot(temp_range,S,'linewidth',1.5,'color','g')
title('Entropy vs Temperature');
xlabel('Temperature');
ylabel('Entropy');
legend('Entropy');
end
Molecular Weight Function:
- First, the name of the molecule or element is input and for more than one element in a molecule, its name is modified such that the numeric value representing the number of elements is replaced by equal number of letter representing the particular element.
- Now, this modified name is compared to predefined basic elements and matched with their respective atomic weight which is calculated by comparing each letter of the modified name.
%% Description
%
% It is a program for a function which calculates the molecular weights of the required molecules.
%
%% Output
%
% Molecular Weight
%
%% Program

function [Wm] = molecular_weight(molecule_name)

%% 1) Parameter Definitions
Elements = {'O' 'H' 'C' 'N' 'AR'};                 % defining the elements
Atomic_Weights = [16 1 12 14 40];                  % defining respective atomic weights
name = [];                                         % initializing the variable for modifying molecule name
W = 0;                                             % initializing the variable for weight

%% 2) Creating Modyfied Name
% a new name is created for each molecule by removing the numeric value and replacing it with equal no of elements
% (Ex CH3 becomes CHHH)
%

for i = 1:length(molecule_name)

    n = str2double(molecule_name(i));

    if isnan(n) == 1
        name = [name,molecule_name(i)];

    elseif isnan(n) ==0

        for j = 1:n-1
            name = [name,molecule_name(i-1)];
        end

    end
end

%% 3) Calculating Molecular Weight
% Each alphabet is compared to Elements vector and their atomic weights are added
%
for i = 1:length(name)
    for j = 1:length(Elements)

        if strcmp(name(i), Elements(j))

            W = W + Atomic_Weights(j);

        elseif strcmp(molecule_name, Elements(j))
            W = Atomic_Weights(j);

        end
    end
end

%%
Wm = W;

end
Main Program:
- Firstly, the file is load using the ‘fopen’ command in ‘read’ mode.
- Now the unwanted header information is stored in the trash.
- The global temperature range is stored in appropriate variables.
- A nested for loop is used to extract the required data from the file.
- The main loop passes the four lines of data for each molecule or element and the sub-loop operated on those lines one by one.
- The sub-loop extracts the temperature coefficients one by one and convert them into numeric values by using the command ‘str2num’ or ‘str2double'.
- After the end of sub-loop:
i) a new folder is created with the name of the molecule whose temperature coefficients are calculated in the sub-loop.
ii) the path for each plot, to be stored, is saved in a variable named 'fullfile'.
iii) calculate the specific heat using function 'specific_heat' which also generates its plot and saves it in the particular directory.
iv) repeat the above step to calculate and generate plots of enthalpy and entropy and save them in a particular directory.
v) call the molecular_weight function to calculate the molecular weight and display it in the command window. - The above steps are again repeated for every next four lines passed by the main loop
%% Description
%
% This is a program to parse the thermodynamic data of NASA.
%
%% Output
%
% Temperature data of each molecules.
% Enthalpy, Specific heat of each and Entropy graph for all molecules.
% Storing above data into individual folders of molecules.
%
%% Author
%
% Umang Tyagi
% Date of Creation - 12 August 2020
%
%% Program
clear all
close all
clc

%% 1) Loading The File
f1 = fopen('THERMO.dat','r');                                 % opening the file in read mode
trash = fgetl(f1);                                            % first line of file
global_temp_range = fgetl(f1);                                % second line stores the global temp range
global_temp_range = strsplit(global_temp_range);              % splitting the line
global_lower_temp = str2double(global_temp_range{2});            % extracting the lower temp value and converting into numerical value
global_medium_temp = str2double(global_temp_range{3});           % extracting the medium temp value and converting into numerical value
global_higher_temp = str2double(global_temp_range{4});           % extracting the higher value and converting into numerical value


trash = [fgetl(f1),fgetl(f1),fgetl(f1)];                      % header and description files.
%% 2) Loop for all the Species
% There are a total of 53 molecules mentioned in the data file
num_molecules = 53;
for i = 1:num_molecules
    Specie = [fgetl(f1);fgetl(f1);fgetl(f1);fgetl(f1)];

    %% 1) Loop for each molecules
    % The data of each molecules is extracted one by one in this loop.
    for j = 1:4                   % running loop four times because each molecule has 4 lines of data
        line = Specie(j,1:end);

        %% 2) Accessing First Line

        if endsWith(line,'1')                                          % execute of the line ends with 1
        % The string and numerical values are stores in a struct named molecule

        line = strsplit(line);
        name = line{1};
        lower_temp = str2double(line{end-3});
        medium_temp = str2double(line{end-1});
        higher_temp = str2double(line{end-2});

    %% 3) Accessing Second Line
        elseif endsWith(line,'2')                                       % execute if the line ends with 2
        pos = strfind(line,'E');                                    % finding position of E in line

        % these position values are used to find the values of temperature coefficients
        % these coefficients are saved in struct named molecules

        al1 = line(1:pos(1)+3);                                      % extracting the coefficient's value
        al1 = str2double(al1);                                   % converting value into numerical value
        al2 = line(pos(1)+4:pos(2)+3);
        al2 = str2double(al2);
        al3 = line(pos(2)+4:pos(3)+3);
        al3 = str2double(al3);
        al4 = line(pos(3)+4:pos(4)+3);
        al4 = str2double(al4);
        al5 = line(pos(4)+4:pos(5)+3);
        al5 = str2double(al5);
    %% 4) Accessing Third Line
        elseif endsWith(line,'3')                                       % execute if line ends with 3
        pos = strfind(line,'E');                                    % finding position of E in line

        al6 = line(1:pos(1)+3);                                      % extracting the coefficient's value
        al6 = str2double(al6);                                   % converting value into numerical value
        al7 = line(pos(1)+4:pos(2)+3);
        al7 = str2double(al7);
        ah1 = line(pos(2)+4:pos(3)+3);
        ah1 = str2double(ah1);
        ah2 = line(pos(3)+4:pos(4)+3);
        ah2 = str2double(ah2);
        ah3 = line(pos(4)+4:pos(5)+3);
        ah3 = str2double(ah3);
    %% 5) Accessing Fourth Line
        elseif endsWith(line,'4')                                       % execute if line ends with 4
        pos = strfind(line,'E');                                    % finding position of E in line

        ah4 = line(1:pos(1)+3);                                      % extracting the coefficient's value
        ah4 = str2double(ah4);                                   % converting value into numerical value
        ah5 = line(pos(1)+4:pos(2)+3);
        ah5 = str2double(ah5);
        ah6 = line(pos(2)+4:pos(3)+3);
        ah6 = str2double(ah6);
        ah7 = line(pos(3)+4:pos(4)+3);
        ah7 = str2double(ah7);
    end

    end
    %% 6) Storing Each Specie's Data
    %% 6.1) Creating Directory
    % For each molecules a new folder is created their data is stored in it
    mkdir (name)                                                   % creating a new folder with molecule's name


    %% 6.2) Calculating Cp and Generating its Plot
    % To calculate Cp, the specific_heat function is called

    Cp = specific_heat(lower_temp, medium_temp, higher_temp, al1,al2,al3,al4,al5,ah1,ah2,ah3,ah4,ah5);
    file_path = append('D:MOOCProjectsNasa TD data',name);
    saveas(gcf, fullfile(file_path,'Cp vs Temperature.png'))         % saving the Cp vs temp plot

    %% 6.3) Calculating Enthalpy and Generating its Plot
    % To calculate Enthalpy, the enthalpy function is called

    H = enthalpy(lower_temp, medium_temp, higher_temp, al1,al2,al3,al4,al5,al6,ah1,ah2,ah3,ah4,ah5,ah6);
    saveas(gcf, fullfile(file_path,'Enthalpy vs Temperature.png'))

    %% 6.4) Calculating entropy and Generating its Plot
    % To calculate Entropy, the entropy function is called

    S = entropy(lower_temp,medium_temp,higher_temp, al1,al2,al3,al4,al5,al7,ah1,ah2,ah3,ah4,ah5,ah7);
    saveas(gcf, fullfile(file_path,'Entropy vs Temperature.png'))


    %% 6.5) Calculating Molecular Weight
    % the molecular weight is calculated by calling a predefined function named molecular_weight
    Mw = molecular_weight(name);
    fprintf('Molecular Weight of %s      =      %f g/moln',name,Mw)
end
Outputs:
1) Plots of O2
2) Plots of N2
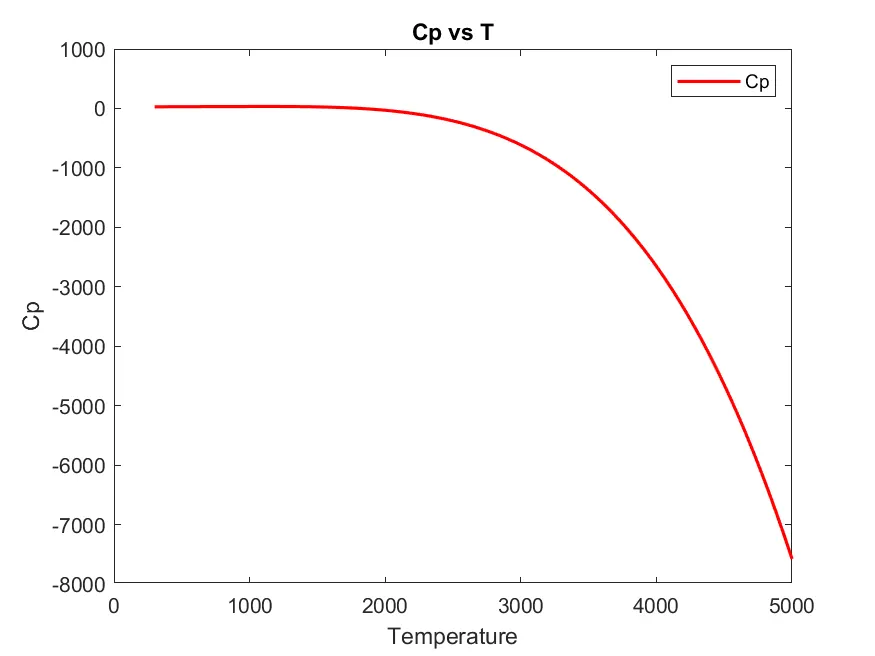
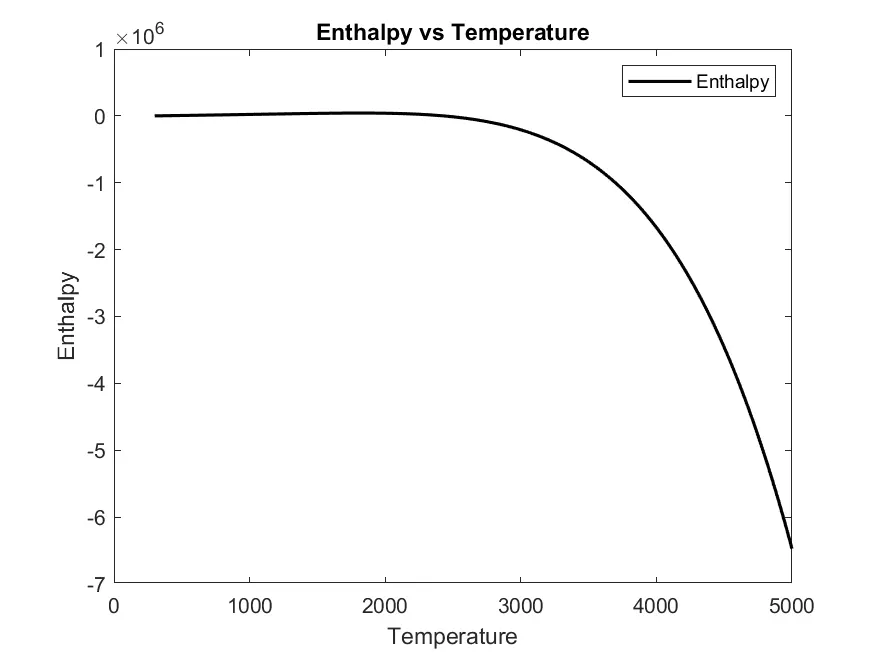
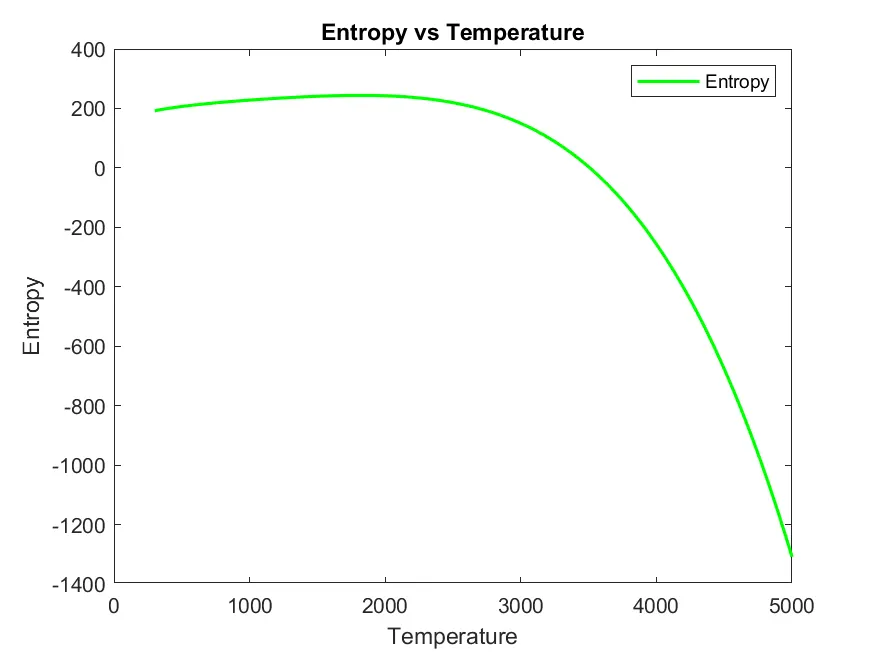
3) Plots of CO2
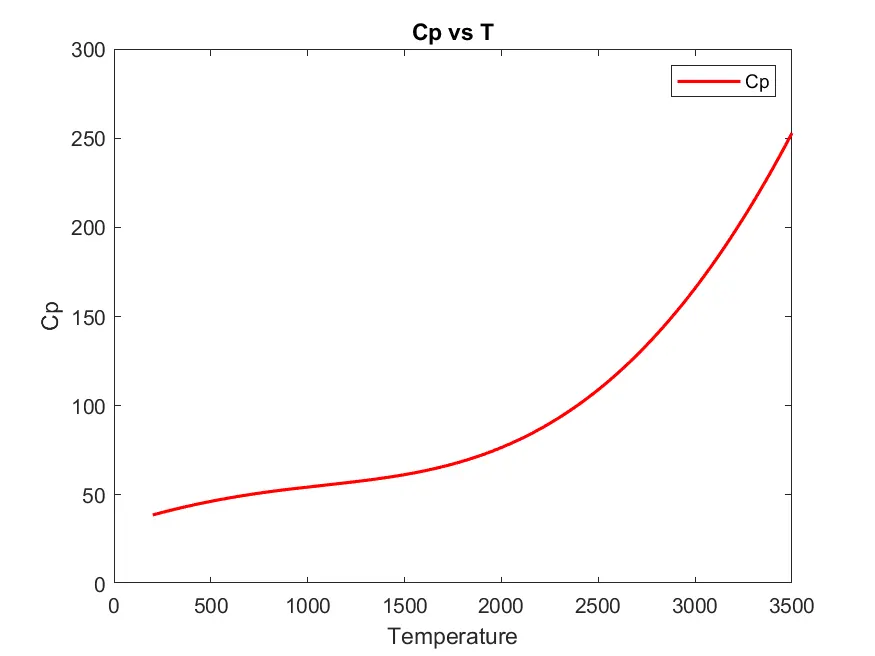
4) Molecular Weights
This data is generated after every iteration for a particular molecule and is displayed in the command window after each iteration.
5) Generated Folders Preview
A total of 53 new folders are created because there are 53 species mentioned in the TD data and each folder contains three plots of entropy, enthalpy and specific heat.

Conclusion:
1) The data is successfully parsed from the 'Thermo.dat' file.
2) Plots of enthalpy, entropy and specific heat are successfully plotted for each molecule or element.
3) The above plots have been successfully dumped into individual molecule's folders.
4) The molecular weight is calculated for each molecule and is displayed in the command window.