Week - 4
Aim:
- Implement control logic of a “washing machine” using Stateflow as per the given sequence:
- If the power supply is available, the system gets activated
- If the Water supply is not available, stop the process & indicate through the LED
- Soaking time should be 200s followed by Washing time of 100s.
- Then rinsing happens for the next 20s & dryer runs for 50s
After all the processes have been completed turn on the finished LED
Explanation:
Blocks used:
Rocker Switch
The Rocker Switch block toggles the value of the connected block parameter between two values during the simulation. For example, you can connect the Rocker Switch block to a Switch block in your model and change its state during simulation. Use the Rocker Switch block with other Dashboard blocks to create an interactive dashboard for your model.
Constant
The Constant block generates a real or complex constant value signal. Use this block to provide a constant signal input. The block generates scalar, vector, or matrix output.
Chart
The Chart block is a graphical representation of a finite state machine based on a state transition diagram. In a Stateflow chart, states and transitions form the basic building blocks of a sequential logic system. States correspond to operating modes and transitions represent pathways between states.
Display
The Display block connects to a signal in your model and displays its value during simulation.
Lamp
The Lamp block displays a color that indicates the value of the connected signal
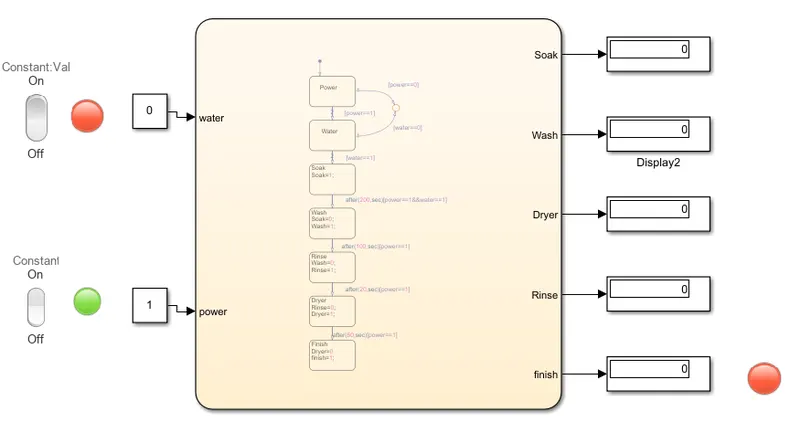
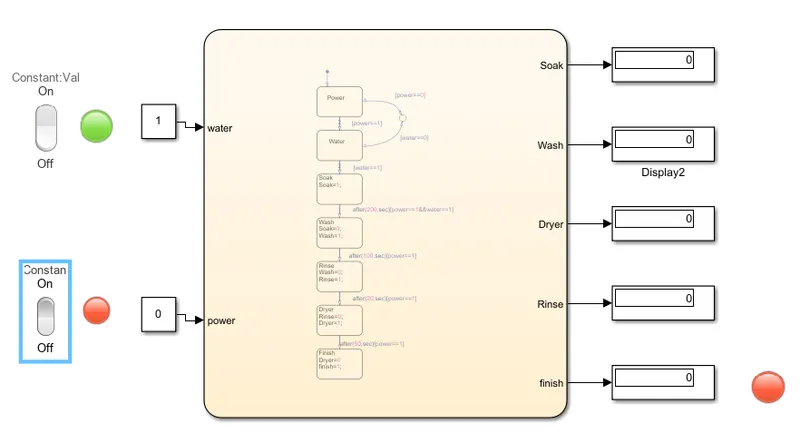
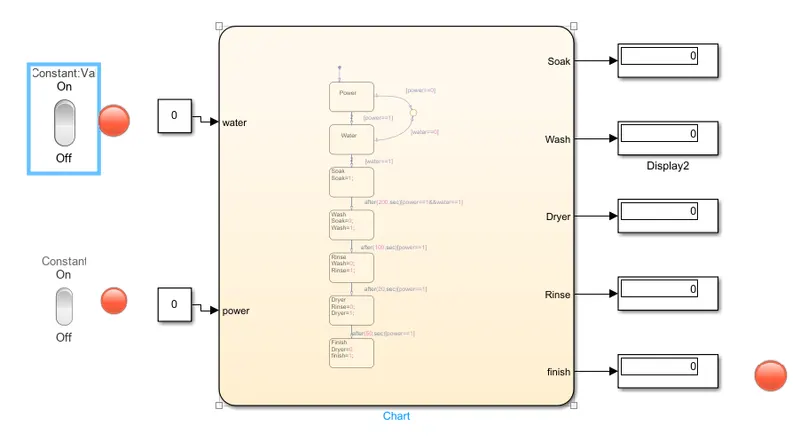
The logic used in the chart block to represent the data in the question is given below.
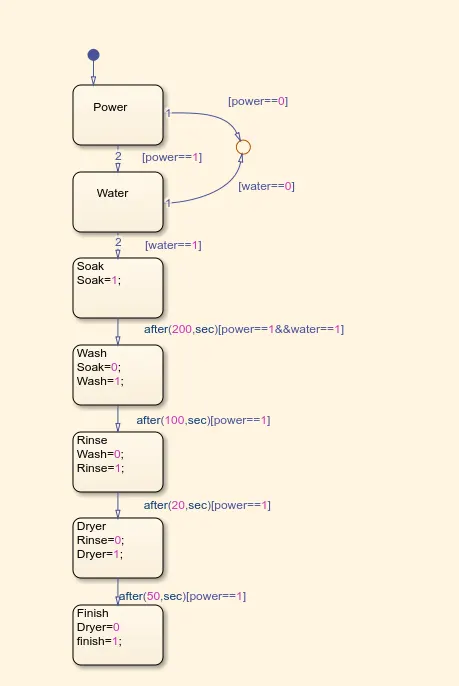
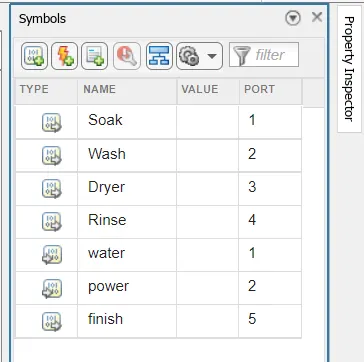
The input and Output data are assigned in the symbols.
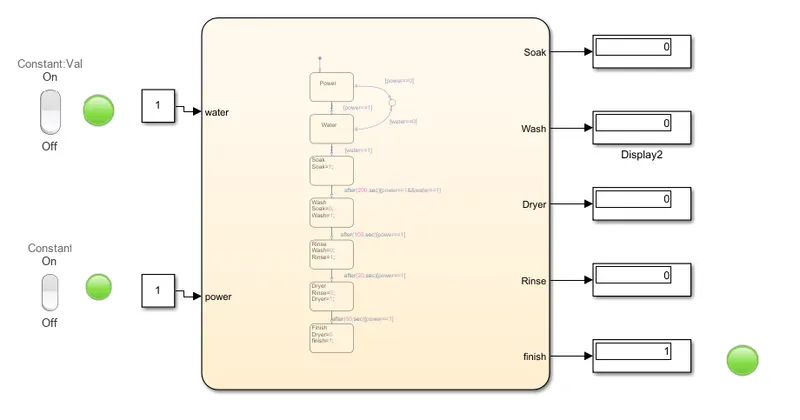
The starting state is created by giving the input values as 1. The water and power are ON.
The lamp is connected to the display of finish and turns green when the washing cycle is completed.
Possible outputs:
When Both Power and Water are ON.
When either Power and Water is OFF.
When both Power and Water are OFF
Aim:
- Make a Simulink chart for the “Gear shift” logic as per the below conditions:
Speed Range(kmph) Gear
0 to 15 1
16 to 25 2
26 to 40 3
41 to 60 4
Above 61 5
Give speed input while the simulation is running & display the gear number.
Blocks Used:
Constant
The Constant block generates a real or complex constant value signal. Use this block to provide a constant signal input. The block generates scalar, vector, or matrix output.
Slider gain
The Slider Gain block performs a scalar gain that you can modify during simulation. Modify the gain using the slider parameter.
Chart
The Chart block is a graphical representation of a finite state machine based on a state transition diagram. In a Stateflow chart, states and transitions form the basic building blocks of a sequential logic system. States correspond to operating modes and transitions represent pathways between states.
Display
The Display block connects to a signal in your model and displays its value during simulation.
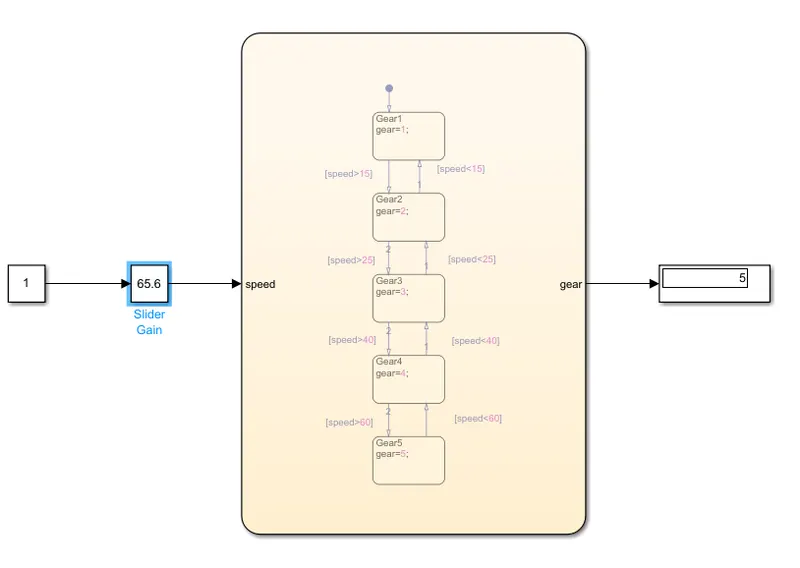
The data given is represented in the form of Stateflow in the chart.
The input and output values are assigned in symbols.
Speed is the input in this case and gear is the output.
The input speed can be varied by using slider gain.
Output example for different speed.
When speed >25 and Speed<40: The gear is 3
When speed >40 and Speed<60: The gear is 4
When speed >60 ,The gear is 5.
Aim:
- Implement control logic of a “washing machine” using Stateflow as per the given sequence:
- If the power supply is available, the system gets activated
- If the Water supply is not available, stop the process & indicate through the LED
- Soaking time should be 200s followed by Washing time of 100s.
- Then rinsing happens for the next 20s & dryer runs for 50s
After all the processes have been completed turn on the finished LED
Explanation:
Blocks used:
Rocker Switch
The Rocker Switch block toggles the value of the connected block parameter between two values during the simulation. For example, you can connect the Rocker Switch block to a Switch block in your model and change its state during simulation. Use the Rocker Switch block with other Dashboard blocks to create an interactive dashboard for your model.
Constant
The Constant block generates a real or complex constant value signal. Use this block to provide a constant signal input. The block generates scalar, vector, or matrix output.
Chart
The Chart block is a graphical representation of a finite state machine based on a state transition diagram. In a Stateflow chart, states and transitions form the basic building blocks of a sequential logic system. States correspond to operating modes and transitions represent pathways between states.
Display
The Display block connects to a signal in your model and displays its value during simulation.
Lamp
The Lamp block displays a color that indicates the value of the connected signal
The logic used in the chart block to represent the data in the question is given below.
The data are represented in the form of Stateflow.
The input and Output data are assigned in the symbols.
The starting state is created by giving the input values as 1. The water and power are ON.
The lamp is connected to the display of finish and turns green when the washing cycle is completed.
Possible outputs:
When Both Power and Water are ON.
When either Power and Water is OFF.
When both Power and Water are OFF
Aim:
- Make a Simulink chart for the “Gear shift” logic as per the below conditions:
Speed Range(kmph) Gear
0 to 15 1
16 to 25 2
26 to 40 3
41 to 60 4
Above 61 5
Give speed input while the simulation is running & display the gear number.
Blocks Used:
Constant
The Constant block generates a real or complex constant value signal. Use this block to provide a constant signal input. The block generates scalar, vector, or matrix output.
Slider gain
The Slider Gain block performs a scalar gain that you can modify during simulation. Modify the gain using the slider parameter.
Chart
The Chart block is a graphical representation of a finite state machine based on a state transition diagram. In a Stateflow chart, states and transitions form the basic building blocks of a sequential logic system. States correspond to operating modes and transitions represent pathways between states.
Display
The Display block connects to a signal in your model and displays its value during simulation.
The data given is represented in the form of Stateflow in the chart.
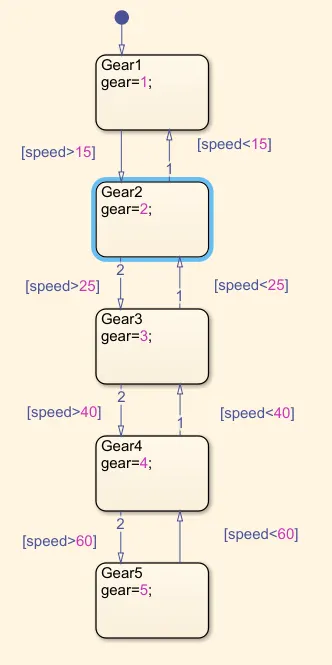
The input and output values are assigned in symbols.
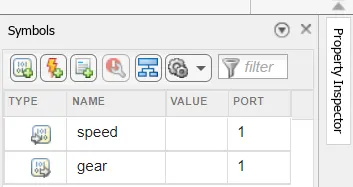
Speed is the input in this case and gear is the output.
The input speed can be varied by using slider gain.
Output example for different speed.
When speed >25 and Speed<40: The gear is 3
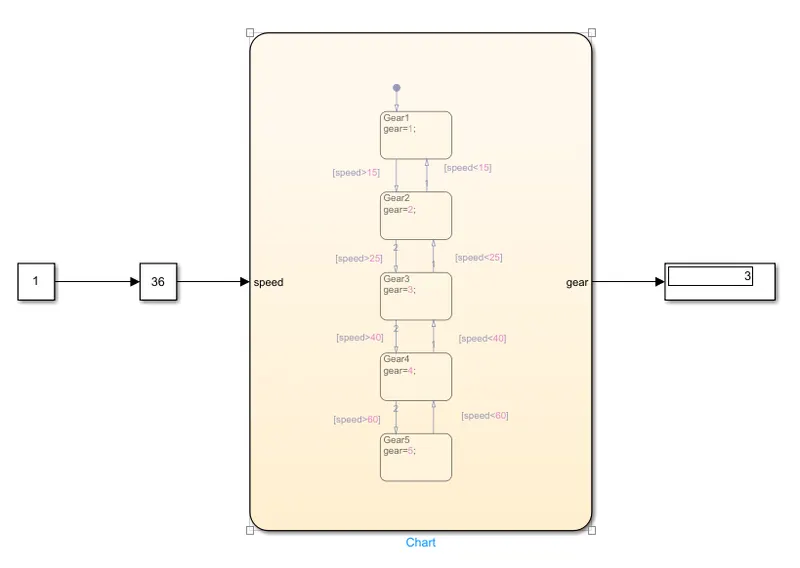
When speed >40 and Speed<60: The gear is 4
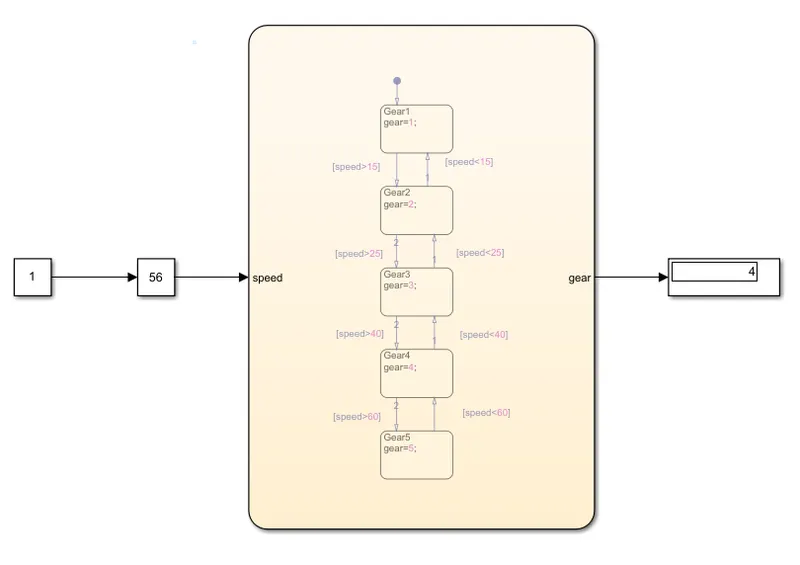
When speed >60 ,The gear is 5.