Week - 4
Aim
To implement control logic of a washing machine using stateflow as per the sequence:
- If the power supply is available, the system gets activated
- If the water supply is not available, stop the process and indicate through LED
- Soaking time should be 200s followed by washing time of 100s
- Then rinsing happens for next 20s and dryer runs for 50s.
- Turn ON the finished LED when the process is completed.
Stateflow
- Provides a graphical language that includes state transition diagrams, flow charts, state transition tables, and truth tables.
- Enables one to design and develop supervisory control, task scheduling, fault management, communication protocols, user interfaces, and hybrid systems.
- With Stateflow, one can model combinatorial and sequential decision logic that can be simulated as a block within a Simulink model or executed as an object in MATLAB.
- Graphical animation enables one to analyze and debug the logic while it is executing.
- Edit-time and run-time checks ensure design consistency and completeness before implementation.
Procedure
- Power supply and Water supply are considered as the inputs and the other process function only when the power and water supply are in on state ie [power==1] and [water==1] and does not operate when [power==0] and [water==0].
- Soaking,washing,rinsing drying are considered as the output that follows once the input conditions are satisfied.
- The process come to end once the cycle completes and then the power is meant to be in turned off condition.
- When both the conditions are satified in input state the soaking time is 200s followed by washing time of 100s.
- Then rinsing happens for next 20s and dryer runs for 50s.
- The process comes to end afterwards.
Figures and Observations
Figure1 represent the implementation of control logic of washing machine using stateflow.
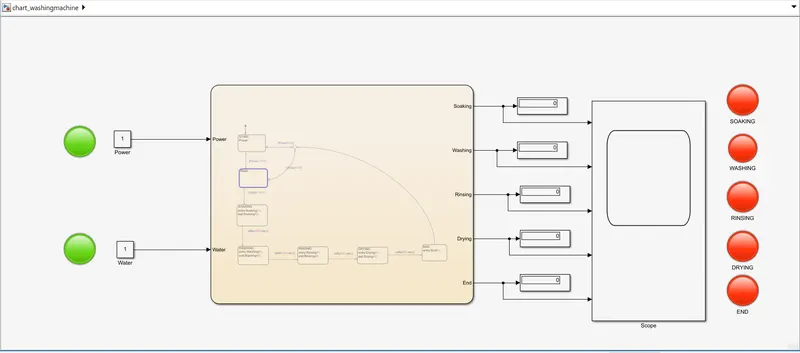
Figure 2 represent the stateflow chart.
- A chart is available in the library browser in simulink.
- It helps us in creating different states as per the sequence inside it by dragging the icons present in the environment.
- Name of states, arguments can be defined in the state.
- In this case power and water are considered as input states.
- When th power is on ,it checks the availability of water and then continues the process only if water condition is 1.
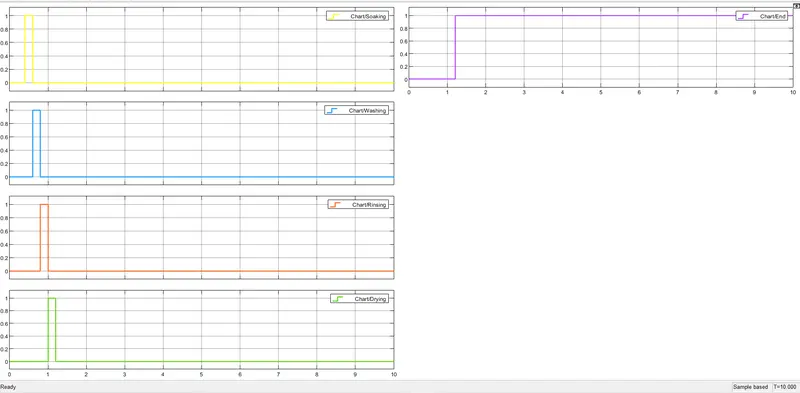
- Soaking is defined for 200s, washing for 100s, rinsing for 20s, dryer for 50s and the end state is also defined here.
- Display blocks are given as output of stateflow chart.
- Lamps are further used to indicate the step by step process taking place.
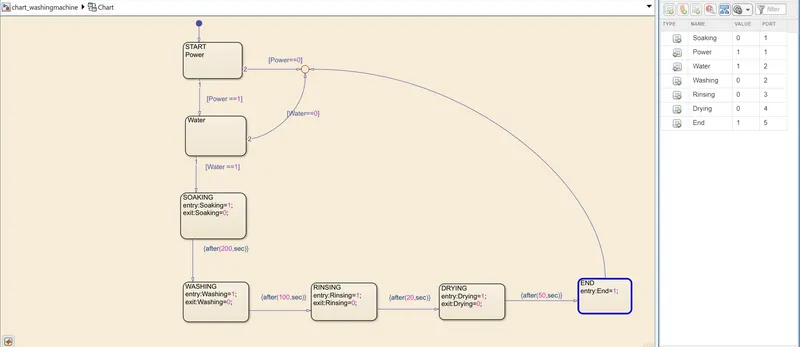
- Inorder to declare the input and output values in statefloew chart select the symol area from log active and create the data in symbol pane. It is also shown along with the chart in figure 2.
Figure 3,4,5 , 6 and 7 shows the different states of the model when the input is provided
ie soaking is for 200s,followed by washing for 100s, rinsing for 20s, dryer for 50s and the end state defining the end of cycle.
Figure 3 : Soaking
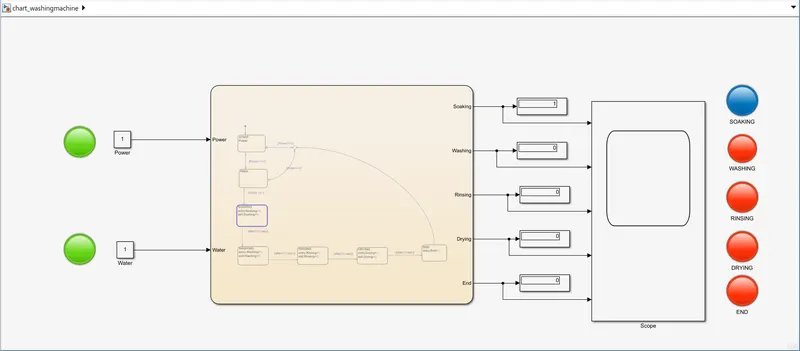
Figure 4 :Washing
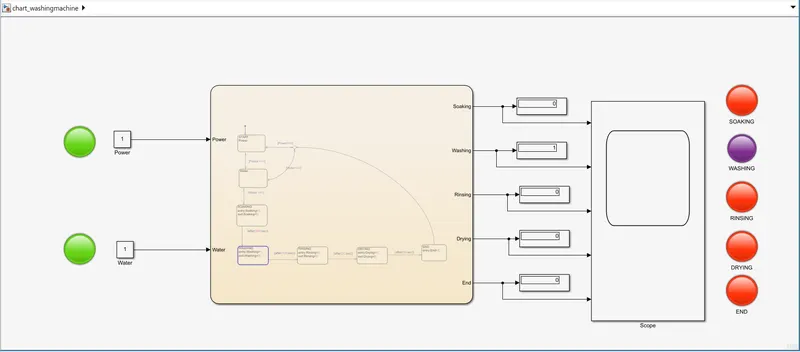
Figure 5 : Rinsing
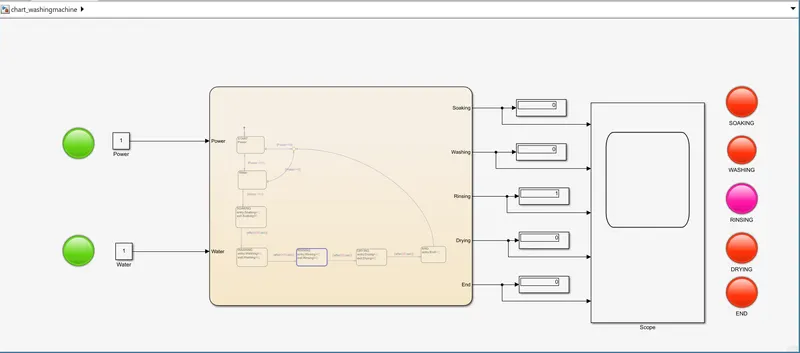
Figure 6 : Drying
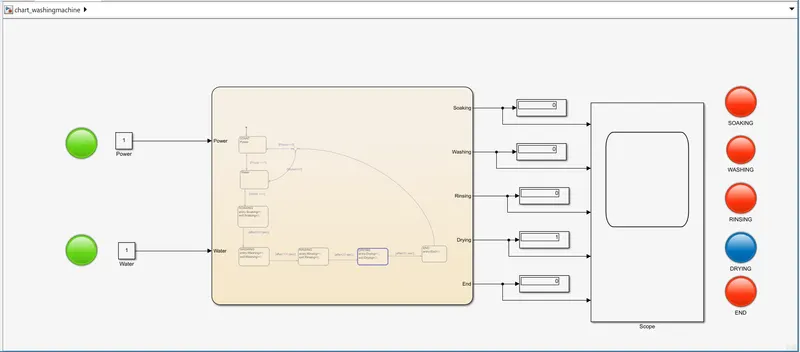
Figure 7 : End
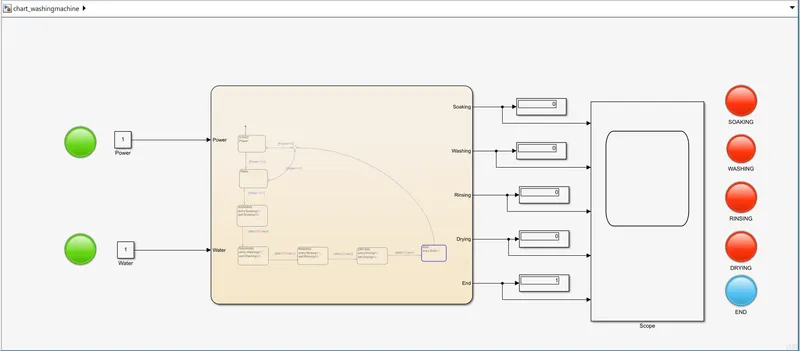
Figure 8 : When the water supply is interrupted ie when the value of water = 0 , the statef low process stops and other sates does not operate.
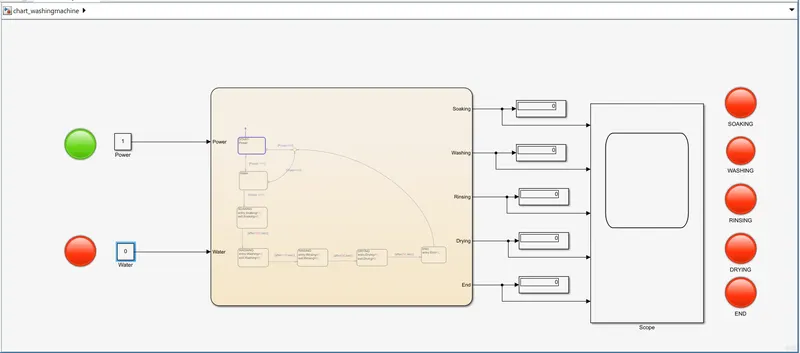
Figure 9 : Output waveform obtained in the scope during different states of stateflow chart.
Result
Implemented the control logic of a washing machine using stateflow as per the sequence:
- If the power supply is available, the system gets activated
- If the water supply is not available, stop the process and indicate through LED
- Soaking time should be 200s followed by washing time of 100s
- Then rinsing happens for next 20s and dryer runs for 50s.
- The LED is turned ON to indicate the completion of process.
Stateflow chart is prepared and is connected to input power and water using constants in simulink as well output is connected to display as well as lamps are used which turn on and off according to the transition states.
Output obtained are represented in scope at different statges.
Basic understanding of stateflow logic is done through this challenge.
2)
Aim
a) To make a simulink chart for the gear shift logic as per below condition
speed (kmph) gear
0-15 1
16-25 2
26-40 3
41-60 4
above 61 5
b) To display the gear number giving speed input while running the simulation.
Gear shift mechanism
- A gear shift in a vehicle allows the driver to select the gear ratio most appropriate for the speed and conditions.
- It is also known as a gear selector, gear lever, or simply shifter, the gear shift interfaces with the gear box in the vehicle's drivetrain.
- The design of the shifter can vary widely, depending on what type of vehicle is involved, and whether the transmission is manual or automatic.
Procedure
- For gear shifting chart block is used to shift logic for the conditionds given above.
- Five states are defined as Gear1, Gear2, Gear3, Gear4 and Gear5.
- To shift from one state to another we have defined speed as condition
- As per the above condition for gear shifting a stateflow is created with transition to give the condition wrt speed.
- Here speed is considered as input data and gear as output data.
- Here we use slider gain to vary the speed from 0-100kmph.
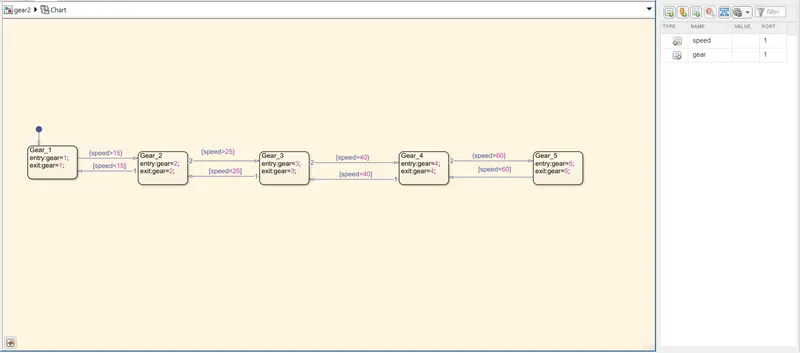
Figure1 shows the gear shift stateflow chart.It also shows the output and input in symbol pane.
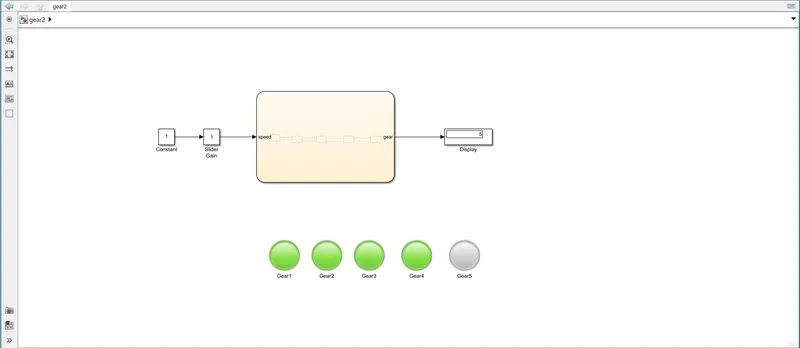
Figure2 shows the simulink model for gear shift mechanism.
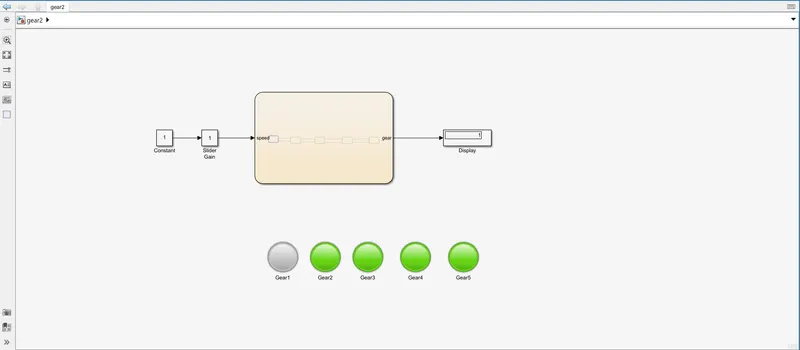
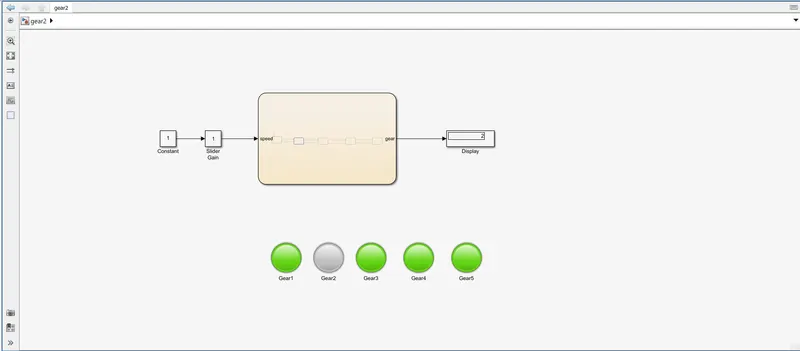
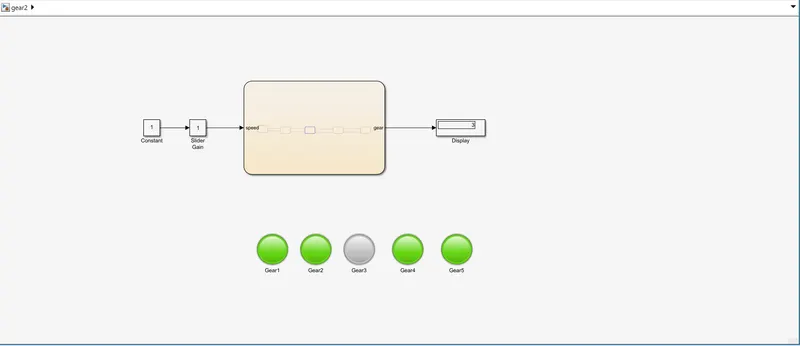
Figure 6 shows for the speed range 40-60 kmph and gear 4 is operated.
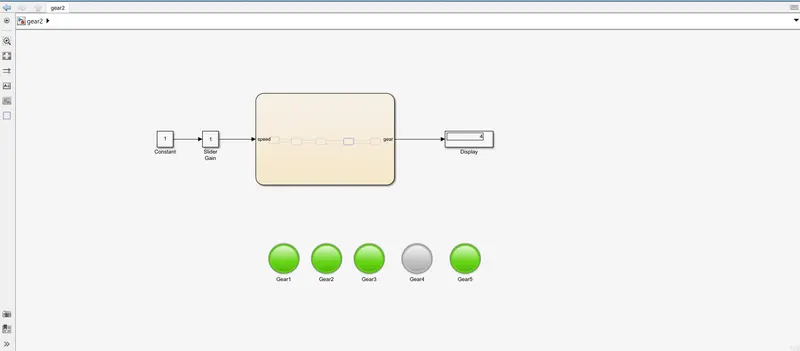
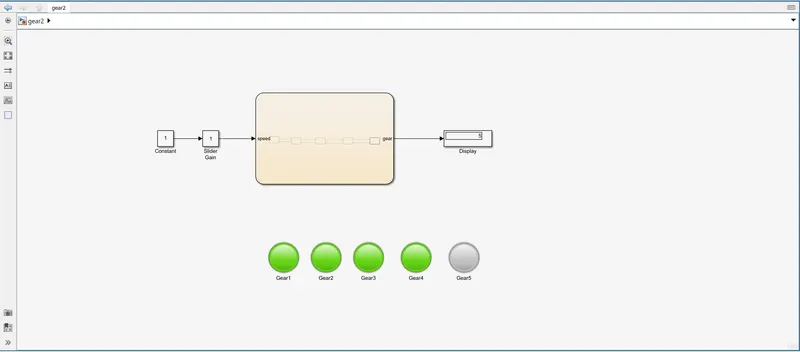
Figure 7 shows for the speed range above 60kmph and gear 5 is operated
Observation
The working of slider gain, lampblock and working of stateflow is understood through this challenge.
Result
A simulink chart for the gear shift logic for the conditions are done
speed (kmph) gear
0-15 1
16-25 2
26-40 3
41-60 4
above 61 5
The output is obtained and is displayed and according to the shifting of gears respective lamps glow indicating the gear shift.