Week - 4
Aim:
To implement a control logic of a washing machine using stateflow as per the provided sequence.
- If the power supply is available, the system gets activated.
- If the Water supply is not available, stop the process & indicate through LED.
- Soaking time should be 200s followed by Washing time of 100s.
- Then rinsing happens for next 20s & dryer runs for 50s.
Apparatus:
- Push Button
- Constant
- Chart
- Display
- Lamp
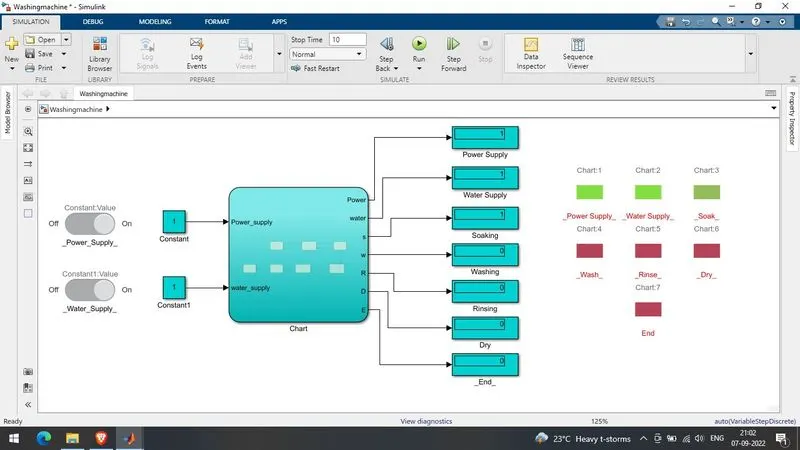
Model Diagram:
Theory:
- The model uses the concept of state diagrams. State diagrams help us design systems with multiple possibilities of execution.
- The state diagrams follow the flowchart like approach to solve the problem, which consists of transition from from one state to other state or to remain in same state.
Working:
- In this experiment we use following states:
| Power Supply | Water Supply | Soaking | Washing | Rinsing | Drying | End |
- Power Supply is the primary input to the system which is passed through a constant using a push button.(if power supply = 1 : check water supply = 1 otherwise stay at Power Supply Block)
- Similarly, Water Supply is also the primary input to the system which is passed through a constant using a push button. (if power supply = 1: water supply = 1 jump to soaking state)
- Soaking State is for the duration of 200 seconds.
- Now, As the soaking duration completes the control jumps to washing state.
- The washing state is for the duration of 100 seconds.
- Now, the control jumps to rinse state as washing is completed. The rinsing process is carried out for 20 seconds.
- Now as the rinsing is completed the control jumps to drying state where the water supply is shut down as we don't require water while drying the clothes. The drying process runs for 50 seconds.
- After completion of the drying the control moves to the end state.
- All these condition outputs of stateflow charts are connected to display as well as to the lamp in order to indicate the current state of the washing machine.
Results & Conclusion:
- Hence, we have learnt to use state flow charts and inplemented a washing machine model using it.
- Stateflow charts help us to make systems with many different states using its simple flow diagram approach and helps breakdown complex systems into smaller blocks which are easy to implement.
Aim:
To make a Simulink chart for the “Gear shift” logic as per the mentioned conditions:
| Speed Range (Km/h) | Gear |
| 0 - 15 | 1 |
| 16 - 25 | 2 |
| 26 - 40 | 3 |
| 41 - 60 | 4 |
| Above 60 | 5 |
Apparatus:
- Slider
- Constant
- Circular Gauge
- State Flow Chart
- Lamp
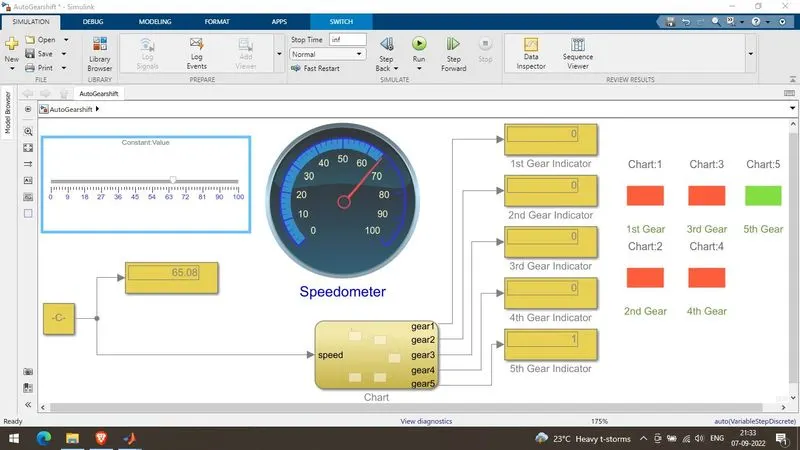
Model Diagram:
Theory:
- A typical autoshift gear box system uses an algorithm for judgement of gear based on the speed range and shifts the gears accordingly.
- These type gear boxes help us improve the performance of the vehicle as the system automatically adjusts and changes gear depending on the speed of the vehicle. This will also help use reduce wear and tear of the gearbox and improves engine efficiency.
Working:
- We are using a slider block to simulate acceleration by the accelerator pedal.
- A circular gauge is used as speedometer which is connected to the slider block and it will display the current sspeed applied using the slider block.
- Speed is fed to the State Flow Chart which consists of five blocks namely Gear 1, Gear 2, Gear 3, Gear 4 and Gear 5.
- The Gear 1 is customised for the speed range of (0 - 15) kmph using conditional statements.
- The Gear 2 is customised for the speed range of (16 - 25) kmph using conditional statements.
- The Gear 3 is customised for the speed range of (26 - 40) kmph using conditional statements.
- The Gear 4 is customised for the speed range of (41 - 60) kmph using conditional statements.
- The Gear 5 is customised for the speed range of (Greater than 60) kmph using conditional statements.
- The corresponding outputs for each gears are connected to display aswell as to the lamp to indicate or show in which gear is the vehicle moving as per the provided acceleration using slider block.
Results & Conclusion
- Hence, we have designed an auto gearshift gearbox system using state flow graph. The various speed conditions were broke down into seperate blocks in order to make easier decision making algorithm.
- We have effieciently made use of the stateflow chart to solve our problem and learnt to implement, initialise state blocks and providing corresponding conditions