Week - 4
AIM 1 - Implement control logic of a “washing machine” using Stateflow as per given sequence.
Objective -
- If the power supply is available, the system gets activated.
- If the Water supply is not available, stop the process & indicate through LED.
- Soaking time should be 200s followed by Washing time of 100s.
- Then rinsing happens for next 20s & dryer runs for 50s.
Theory -
Stateflow provides a graphical language that includes state transition diagrams, flow charts, state transition tables, and truth tables.
Stateflow can be used to describe how MATLAB algorithms and Simulink models react to input signals, events, and time-based conditions.
Blocks Used -
Chart - It is used to create a State Flow as per the requirement.
Display - It is used to display the Condition/state of the chart.
Lamp - It is sued as a visual signal device to visualise the state.
Constant - It is used to provide a constat sondition to the State Flow Chart.
Slider Switch - It is used to change the conidtion of the constant block.
Simulink Model for Washing Machine Control Logic -
State Flow Chart and Parameters -
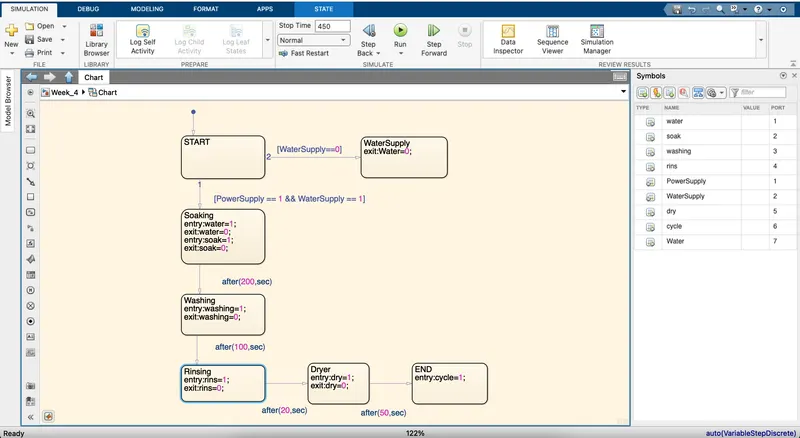
Here we can see the number of Inputs/Outputs and the Simulation is running for 450 seconds which suffice the time to store data and solve the parameters.
Inputs -
- PowerSupply
- WaterSupply
Outputs -
- water
- soak
- washing
- rins
- dry
- cycle
Condition 1 - When Water Supply is in OFF condition.
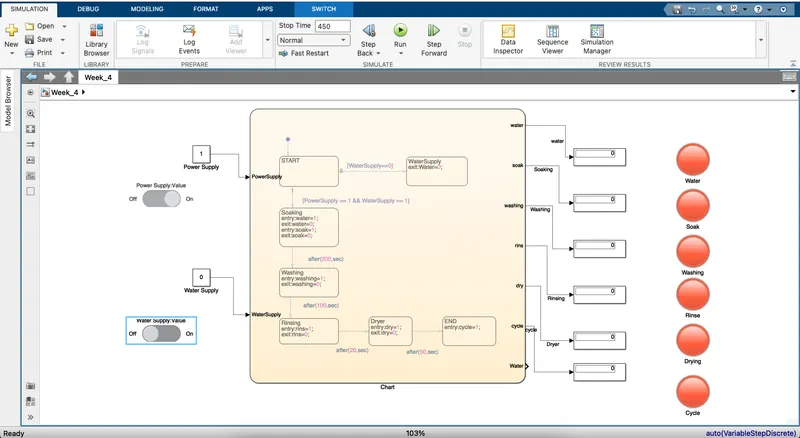
Here, in this condition we are checking the working of state flow as per the given conditon i.e., by stopping the supply of water in this simulation.
So, we can observe that the simulation is not running upto end of State Flow as the supply of water is not provided.
Condition 2 - When Water Supply is in ON condition.
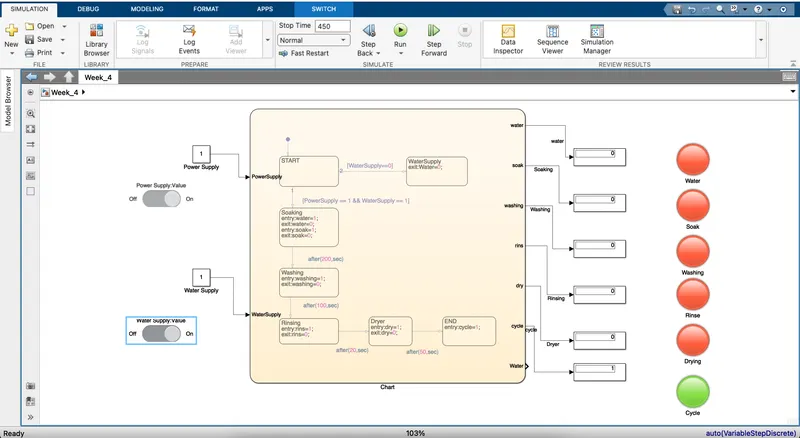
Here, in this situation when Water Supply is provided and all parameters are fullfilling, the Simulation is running upto the end of State Flow.
Conclusion -
Successfully implemented the logic control of a Washing Machine using 'Statflow' for the given sequence.
--------------------------------------------------------XXXXXXXXXXXXXXXXXXXXXXXXXXX---------------------------------------------------------
AIM 2 - Simulink chart for the “Gear shift” logic as per the given conditions conditions.
Objective -
Speed Range(kmph) Gear
0 to 15 1
16 to 25 2
26 to 40 3
41 to 60 4
Above 61 5
Give speed input while the simulation is running & display the gear number.
Blocks Used -
Chart - It is used to create a State Flow as per the requirement.
Display - It is used to display the Condition/state of the chart.
Lamp - It is sued as a visual signal device to visualise the state.
Constant - It is used to provide a constat sondition to the State Flow Chart.
Slider Gain - It is used to provide a gain in the State Flow Chart.
Scope - It is used to observe the graphical representation of the given signal.
Simulink Model for Gear Shift Logic -
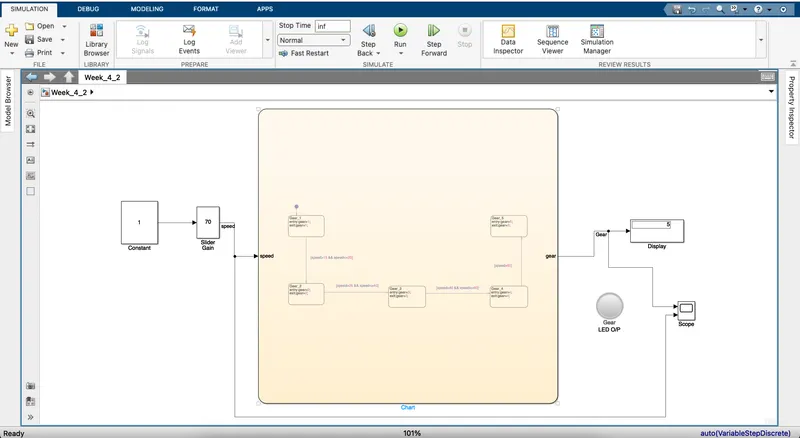
Lamp Block Parameters -
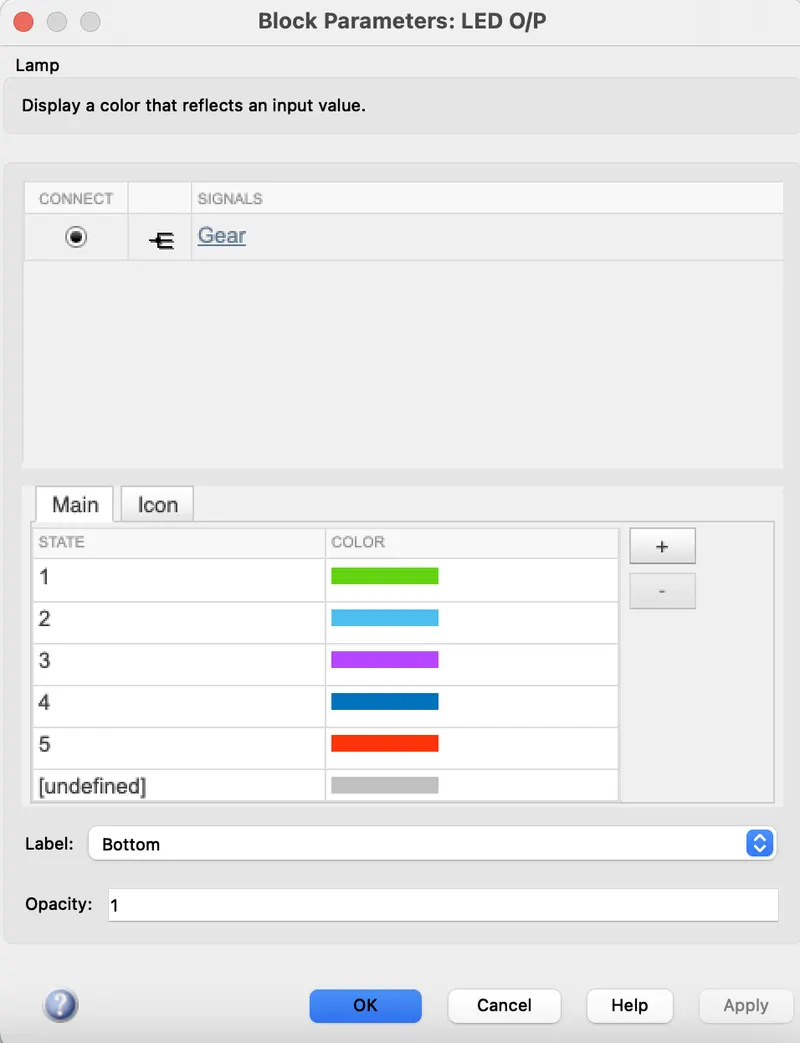
- Gear 1 - Green (condition 1)
- Gear 2 - Blue (condition 2)
- Gear 3 - Violet (condition 3)
- Gear 4 - Dark Blue (condition 4)
- Gear 5 - Red (condition 5)
*Stop Time is taken as 'inf' so that it can run simulation smoothly.
Condition 1 -
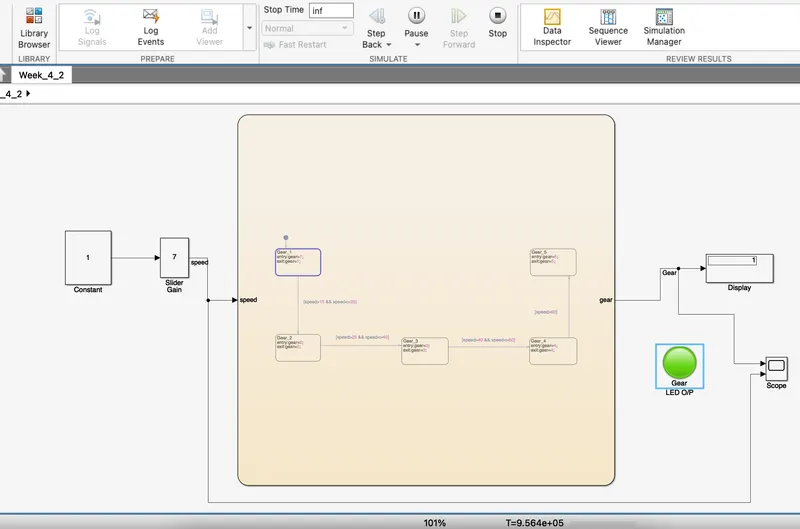
Here, For speed of 7 the Gear 1 is shown in Green color.
Condition 2 -
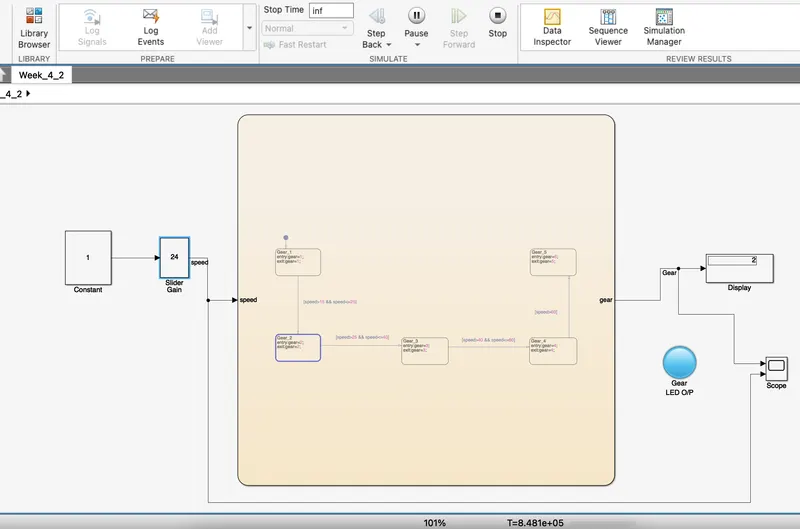
Here, For speed of 24 the Gear 2 is shown in Blue color.
Condition 3 -
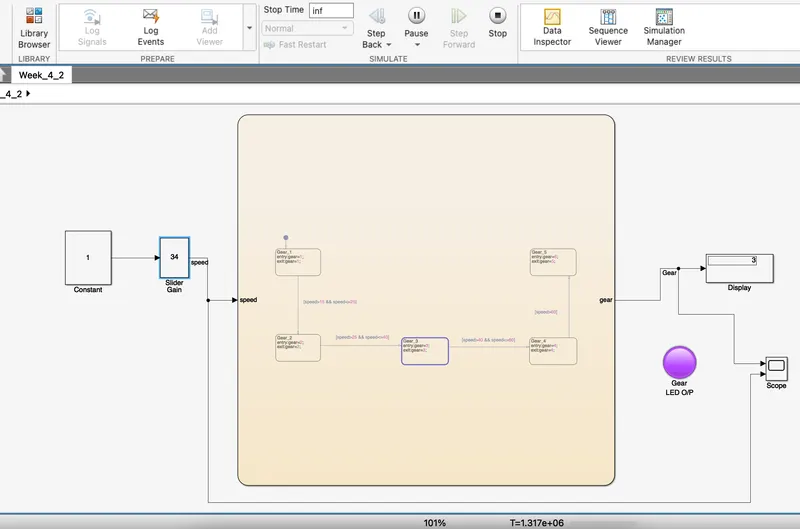
Here, For speed of 34 the Gear 3 is shown in Violet color.
Condition 4 -
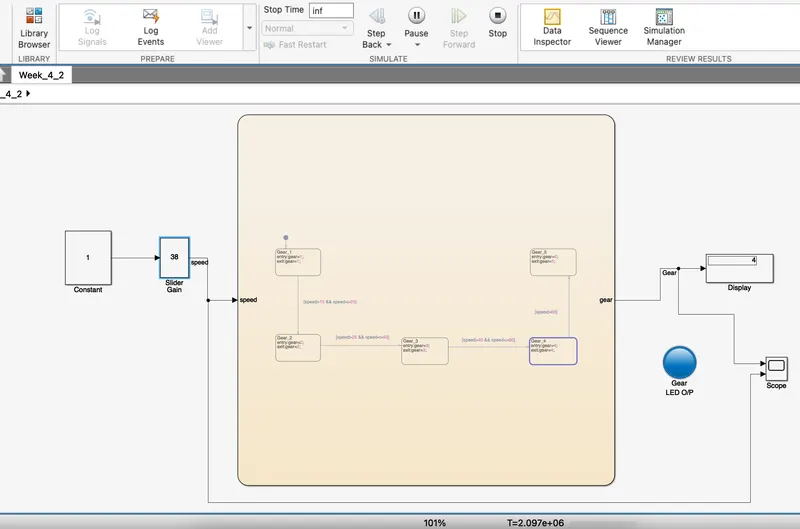
Here, For speed of 38 the Gear 4 is shown in Dark Blue color.
Condition 5 -
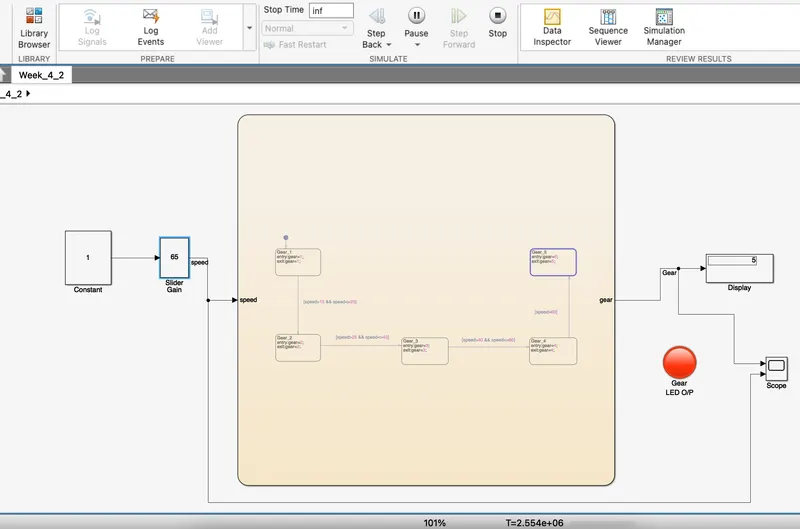
Here, For speed of 65 the Gear 5 is shown in Red color.
Conclusion -
Successfully Displayed the Gear number change while running the simulation.
Note - Unale to save this slx file for 2021a or lower version.
Google_Drive Link -
Link for Google Drive to access Files of the current challege - Google_Drive Link