Week - 4
1
Aim:
To control logic of a 'Washing Machine' using stateflow in Simulink.
Objective:
Implement control logic of a washing machine as per given sequence:
- In the power supply is available, the system gets activated.
- If the water supply is not available, stop the process & indicate through LED.
- Soaking time should be 200s followed by washing time of 100s.
- Then rinsing happens for next 20s & dryer runs for 50s.
After all the processes have completed turn on the finished LED.
Bloked use:
Chart:-
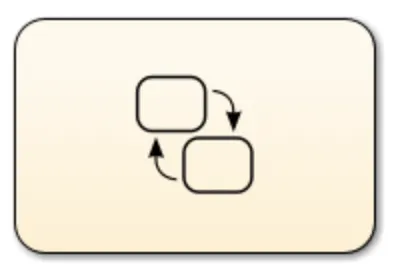
A finite states machine is a representation of an event-driven system. In an even-driven system, the sysem responds to an event by making a transition from one state to another. This transition occurs if the condition defining the change is true.
Display:-
The display block shows the value of input data. You can specify the frequency of the display. For numeric input data, you can also specify the format of display.
Constant:-
The constant blok generates a real or complex constant value signal. Use this block to provide constant signal input.
Lamp:-

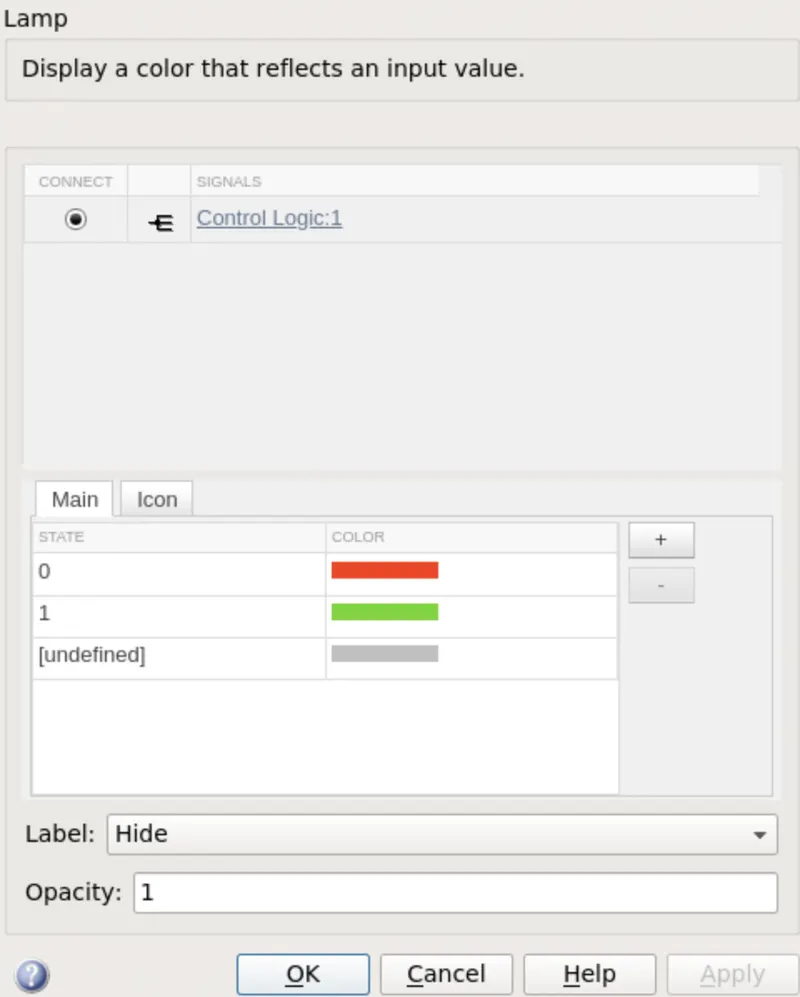
The lamp block display a colour indicating the value of input signal. You can use the lamp block with other dashboard block to build an interactive.
Dashboard of controls and indicator your model. you can specify pairs of input values and colours are provide the information you want the simulation.
Toggle Switch:-
The toggle switch block toggle the value of connected block parameter between two values during simulation.
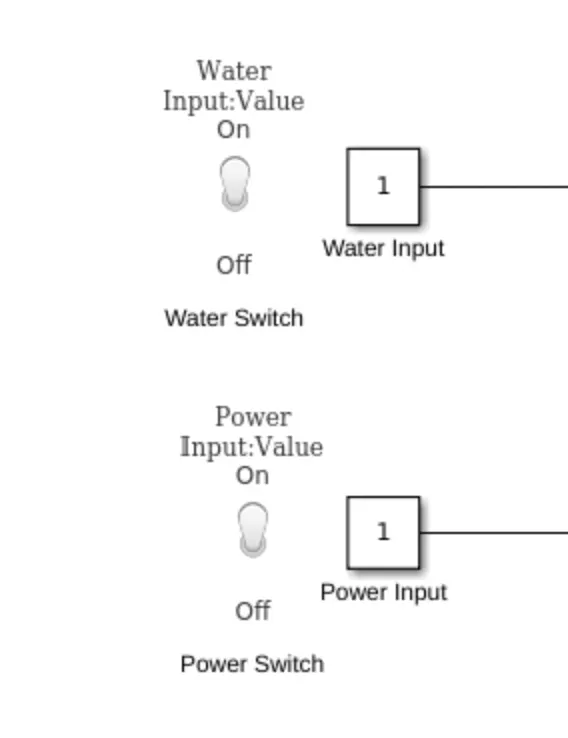
In this modwl we are used two switches, one switch is connected in water input and second is connected in power input.
Model:
Pictorial representation of Block Diagram
Implementing Control Logic of a "Washing Machine" using Stateflow
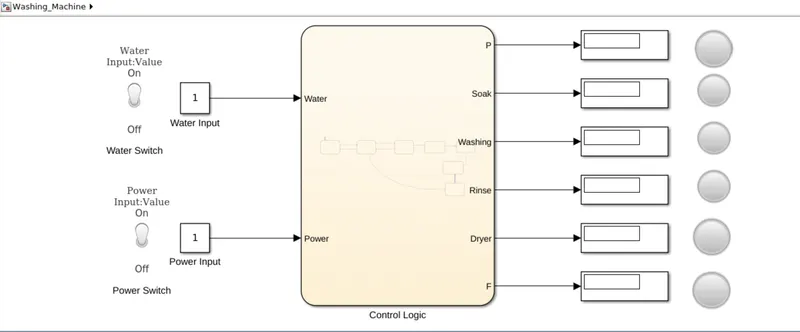
- In this model we use stateflow chart to control logic for washing machine. We used two switches to operates power and water supply.
- The switches are connected to constant block, constant block is connected with control logic.
- Lamp are used to watch power and water supply state which is ON or OFF.
- All process ports are connected with display and display is connected with lamp to watch the process of washing machine with respect to given time.
- After completion of all process F (complete cycle) light and P (power) light is green in the given below output result. We run this simulation is 430 sec.
Chart Diagram:
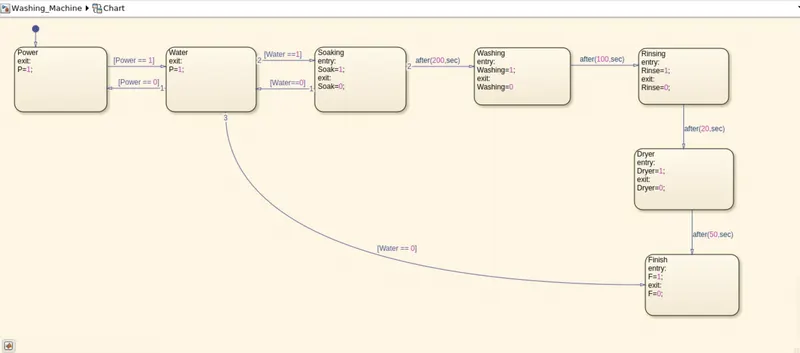
Exlaination Control Logic Chart:-
- In the above control logic block diagram Starting state is created with condition, 1st condition in starting state is power supply = 1 and second state is created with condition 2nd is water supply = 1. That means both water supply and power supply is on.
- The third state is soaking, in this state the water supply is required so we give water supply. After completion soacking water supply is off. As per given condition we gave this time 200 sec for this process with the help of transition condition.
- The forth state is washing, in this state only washing is done with already available in water in washing machine this process is took 100 sec time as per given transition condition. And water drain from the machine.
- The fifth state is rinsing, in this process repeated washing has happened. The water supply is off after 20 sec and rinsing state also done as per given transition condition.
- The six state is dryer, in this process the clothes are dry in 50 sec as per given transition condition after completion of process dryer would off with the help of state condition. Here we also condition in complete cycle is water = 0 in after the completion of procees. In the last state our process is complete.
Parameter Symbols Pane:
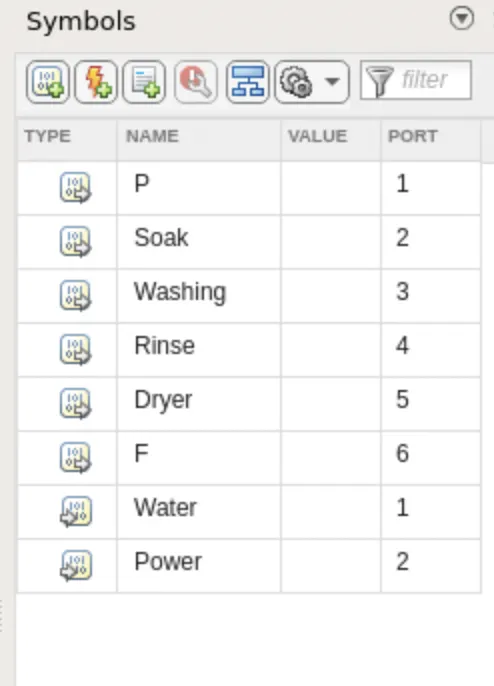
We have given Water, Soak, Washing, Rinse, Dryer, Finish as output in the chart.
We have given our Water and Power as input in the chart.
Output:
Condition1:- When water supply and power supply is off.
We should not provide water and power supply, and check for output.
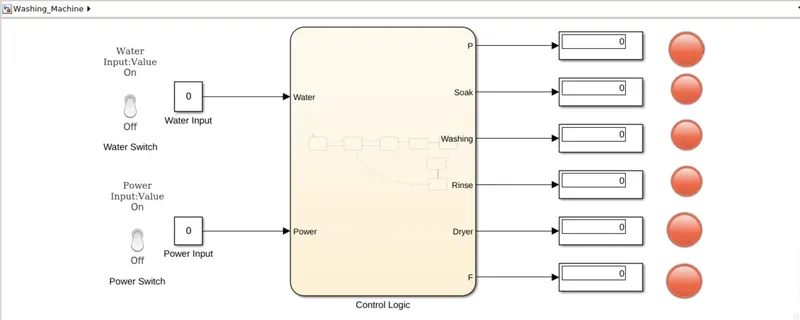
From the above digram, we can see that indicator is showing red. i,e.When there is no water supply and power supply the process is terminated and LED indicator is used to indicate that state.
Condition2:- When water supply is off and power supply is on.
We should not provide water supply and check the output.
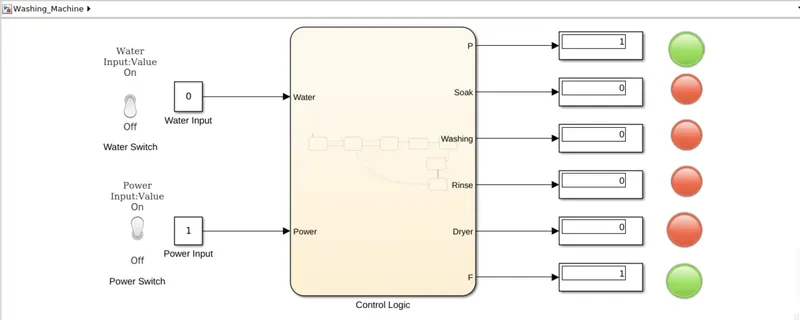
In the above result we observ that when water supply is off and power supply is on all the states have been executed and indicating the process. Here P is power supply that indicate green and cycle complete lamp indicate beacouse of the condition is water = 0 in the last state.
Condition3:- When water supply and power supply is on.
Now we are provide water supply and power supply and check the output.
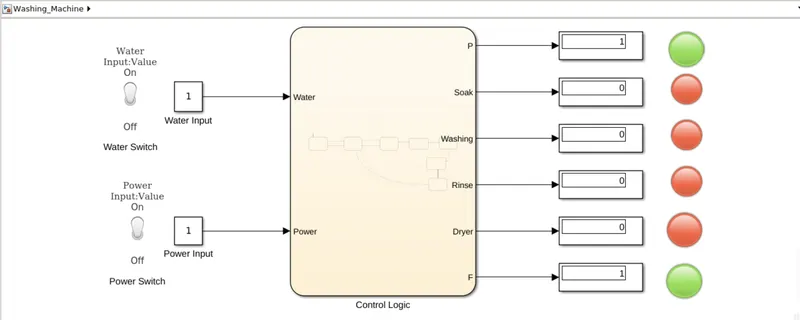
As we can observe that the above result, when water supply is provide all the states have been executed and indicating the process completion indicator name as F(cyclec complete) is showing green, also power is indicate green.
Here we also used scope for see the result in simulation is completed when power supply and water supply is ON.
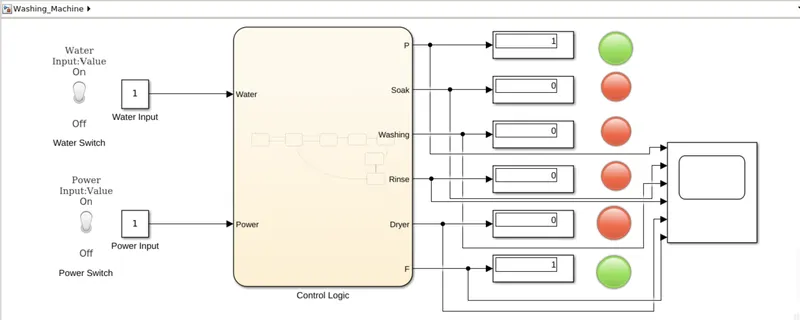
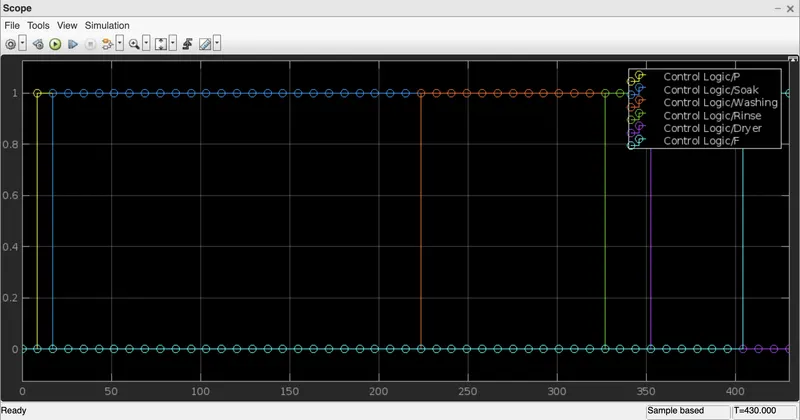
Here we can see the above result that when we given 1 as input , supply is ON and water supply is provided all the state.
Conclusion:
We can conclude that we simulate the washing machine control logic with the help of stateflow is done and result is satisfactory.
------------------------------------------------------------------------------------------------------------------------------------
2
Aim:
To make a Simulink chart for the 'Gear Shift' Logic.
Objective:
Make a Simulink chart for the "Gear Shift" logic as per below condition:
Speed range (kmph) Gear
0 to 15 1
16 to 25 2
26 to 40 3
41 to 60 4
Above 60 5
Give speed input while the simulation is running & display the gear number.
Block used:
Chart:-
A finite states machine is a representation of an event-driven system. In an even-driven system, the sysem responds to an event by making a transition from one state to another. This transition occurs if the condition defining the change is true.
Display:-
The display block shows the value of input data. You can specify the frequency of the display. For numeric input data, you can also specify the format of display.
Slider:-
The slider block tunes the value of the connected block parameter during the simulation. For example, you can connect the slider block in constant block in a model and adjust its value during the simulation, modify the range of the slider block to fit the data.
Constant:-
The constant blok generates a real or complex constant value signal. Use this block to provide constant signal input.
Scope:-
Display signal generated during the simulation.
Model:
Block Digram of Model
Simulation Chart for the "Gear Shift" Logic
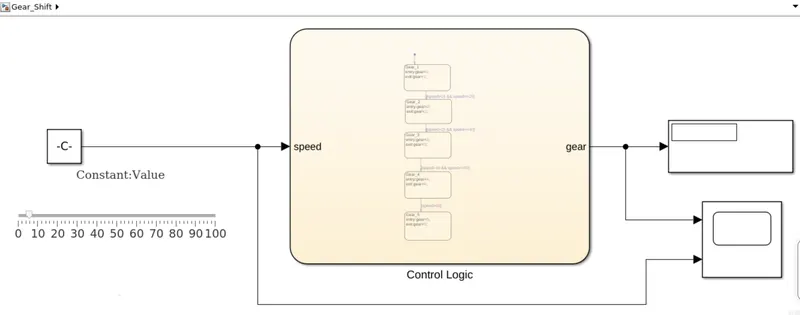
- In the above model we use slider block for variable speed and connect to constant block, constant block is connect control logic Stateflow block. From Slider block we can change value of speed while simulation is running.
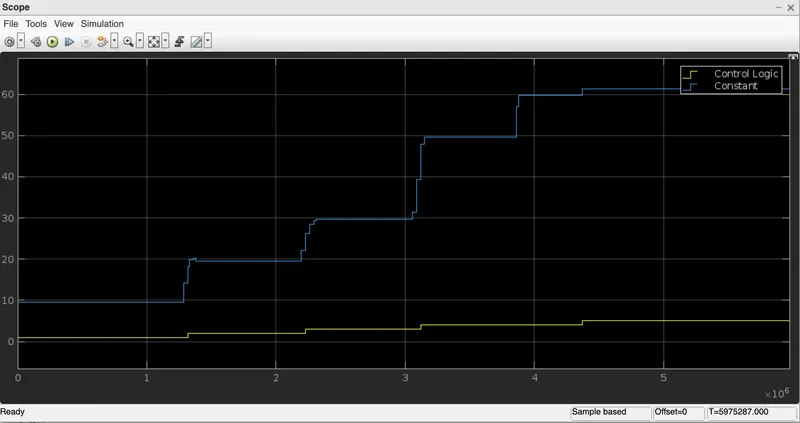
- Display block is connected to control logic to see the gear is running and also used scope for display signal generated during the simulation to see result.
- Here we gave time as 'inf' for our simulation should run until we stop it.
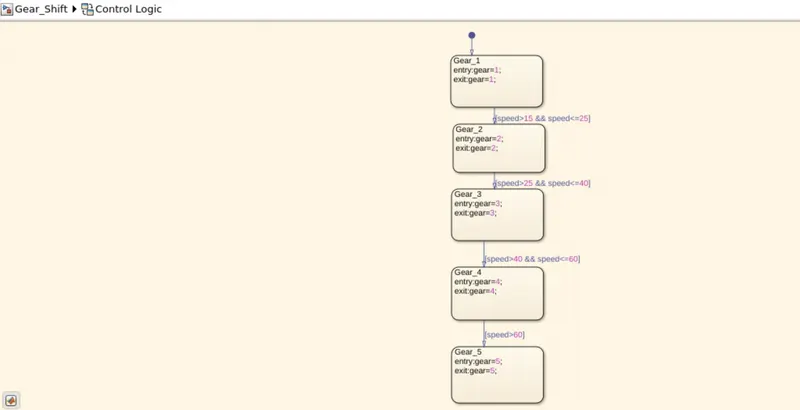
Chart Diagram:
Explanation Control Logic Chart:
- As per the given condition for gear shifting, we created stateflow diagram with help transition to give condition with respect to speed.
- The speed ranges fron 0 to 100 and the slider is used to send the input. The 1st gear has speed values from 0 to 15 so the entry for the 1st gear is speed is 0-10 and the exit condition is when the speed greater than 15.
- For 2nd gear, the entry condition is speed>15 and speed<=25 and the exist condition is speed>25.
- For 3rd gear, the enrty condition is speed>25 and speed<=40 and the exist condition is speed>40.
- For the 4th gear, the entry condition is speed>40 and speed<=60 and the exit condition is speed>60.
- For 5th gear, the entry condition is speed is above 60. The enrty and exit condition are specified and the output is to the scope and display block.
Parameter Symbol:
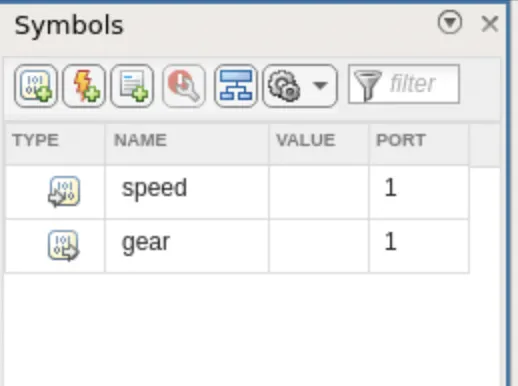
Here we give speed as an input for the chart.
Here we give gear as an output for the chart.
Output:
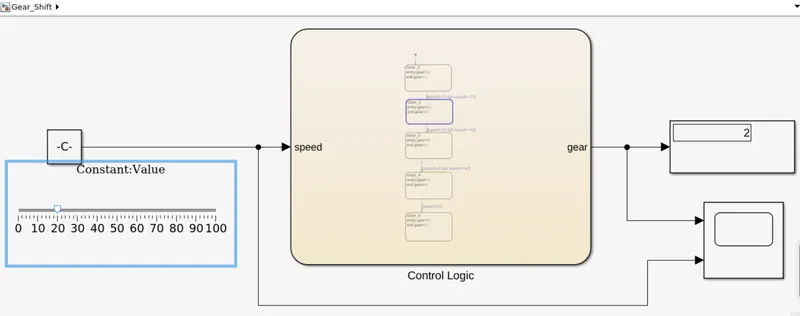
The output produce is recorded when its displaying each gear.
Gear1:
Speed range - 0 to 15
Input speed - 9 kmph
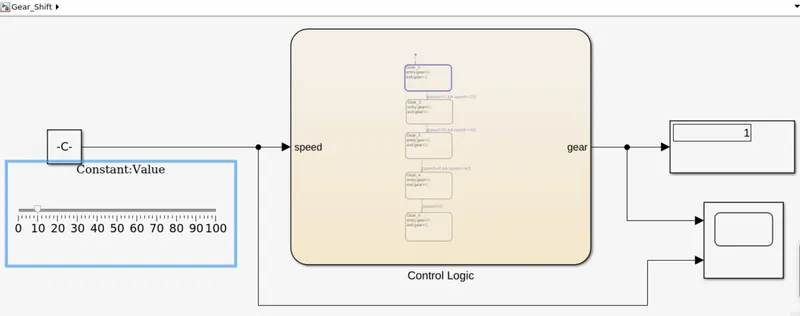
Gear 2:
Speed range - 16 to 25
Input Speed - 20 kmph
Gear 3:
Speed range - 26 to 40
Input speed - 30 kmph
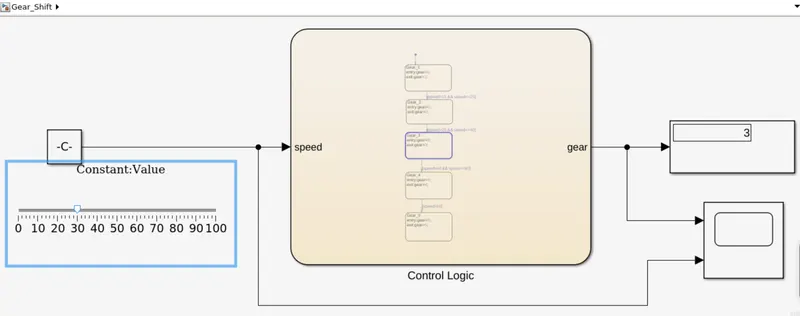
Gear 4:
Speed range - 41 to 60
Input speed - 50 kmph
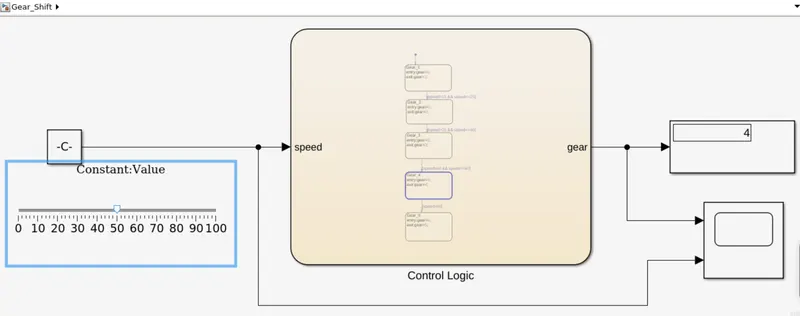
Gear 5:
Speed range - above 60
Input sped - 61 kmph
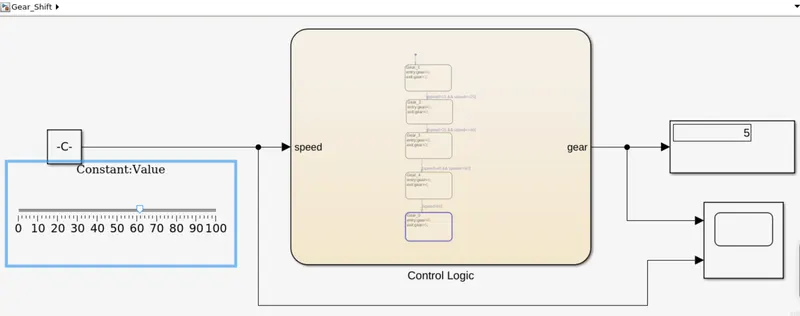
In the Given below the scope we also see the result display in generated during the simulation.
Conclusion:
We can coclude that we simulate the Gear Shifting control logic with the help of stateflow and results are satisfactory.