Week - 4
AIM :
To implement the control logic of a washing machine using Stateflow.
EXPLANATION :
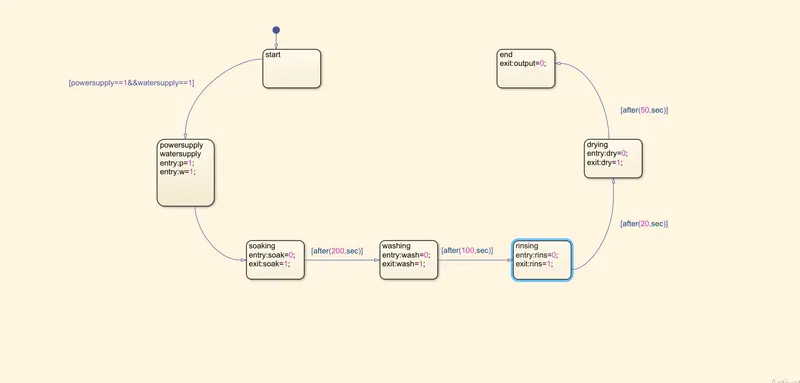
CHART BLOCK: Chart block is used to form Stateflow by defining the process of how the washing machine works. Here we use state blocks to represent different functions .
- START STATE: This is the first state that indicates the start of the washing machine when the power supply is activated.
- POWER SUPPLY AND WATER SUPPLY STATE: power supply state is where the power supply is activated and water is started filling.
- SOAKING STATE: Soaking state gets activated when the condition given in water supply and power supply statisfied.the time taken for this process is 200 seconds .
- WASHING STATE: In this state, the washing machine starts washing, when the soaking conditions are satisfied. The washing process takes 100 seconds as per the given condition .
- RINSING STATE: After the washing state gets satisfied, the rinsing state takes place, here the process goes on for 20 seconds as per the given condition.
- DRYING STATE: If the rining state conditions get satisfied, the drying state starts, it is the last and final stage of the washing machine process. the time to end the drying process is 50 seconds.
- END : Here is where the process of washing machine ends .
CONSTANT BLOCK: Here we have used constant blocks to indicate the ON and OFF conditions . when 0 is given, it is considered OFF. When 1 is given, it is considered as ON.
DISPLAY BLOCK: A display block is used to display the results of the model.
LAMP: Here we use a lamp to find differences in inputs given and the differences in the output results. to find that, we connect the lamps to constant blocks and display blocks. the results are shown in different colors, according to the condition given.
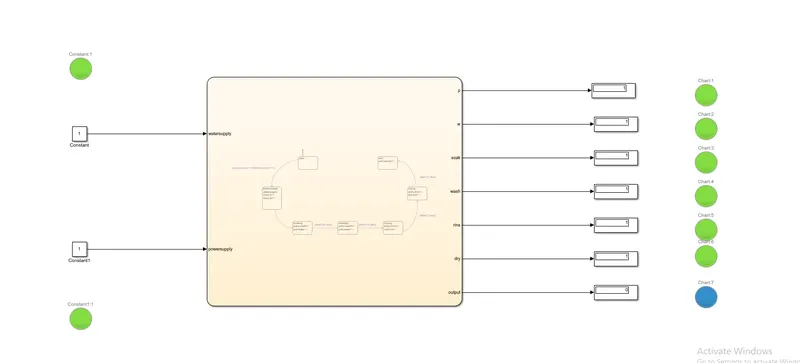
In the above diagram, I gave 1 as a constant value, which indicates the ON condition of the washing machine. The lamp shows green color which is the color I have given for the ON condition.
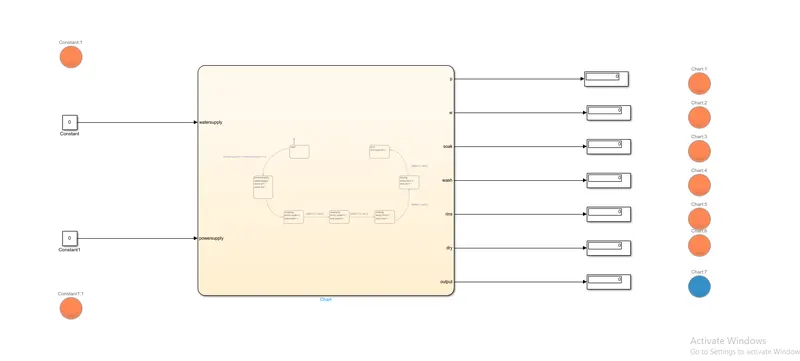
In the above diagram, I gave 0 as a constant value, which indicates the OFF condition of the washing machine. the lamp shows orange color which is the color I have given for the OFF condition.
RESULT: The control logic for the washing machine using state flow is formed.
2.
AIM :
Make a Simulink chart for the gear shift logic
Speed Range(kmph) Gear
0 to 15 1
16 to 25 2
26 to 40 3
41 to 60 4
Above 61 5
EXPLANATION :
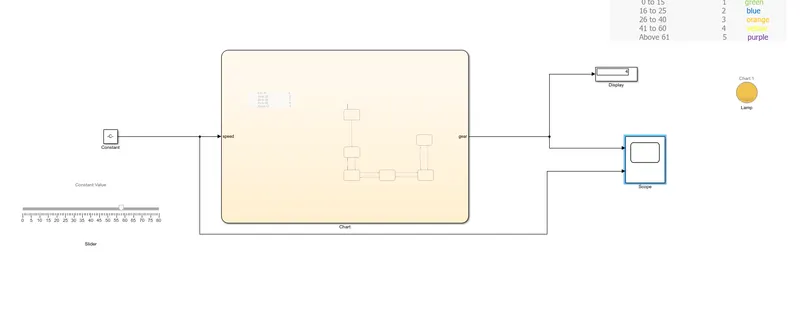
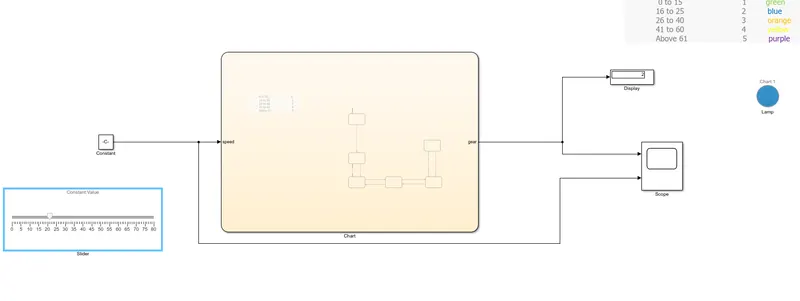
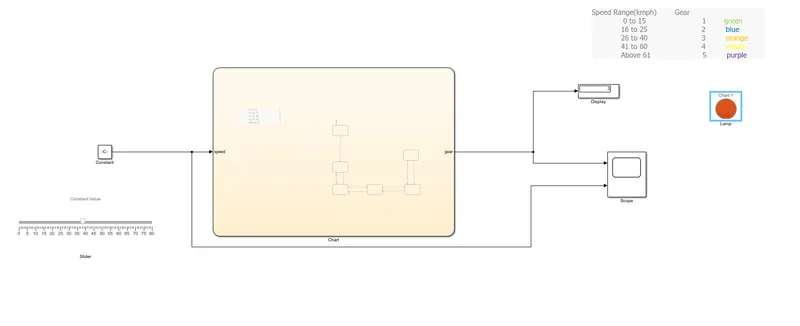
CONSTANT BLOCK: Constant blocks are used to provide constant values of speed.
CHART: Chart block is used to form Stateflow by defining the process of how gear shift works according to speed. Here we use state blocks to represent different functions.
- START STATE: Start the vehicle in a neutral state
- FIRST GEAR STATE: When a vehicle reaches above the speed of 0 km/hr, it satisfies the first gear condition.
- SECOND GEAR STATE: When a vehicle reaches above the speed of 16 km/hr, it satisfies the second gear condition.if the speed reaches below 16km/hr, the second gear state shifts to the first gear state as per the given condition.
- THIRD GEAR STATE: When the vehicle reaches above the speed of 26km/hr, it satisfies the third gear condition.if the speed reaches below 26km/hr, the third gear state shifts to the second gear state as per the given condition.
- FOURTH GEAR STATE: When a vehicle reaches above the speed of 41 km/hr, it satisfies the fourth gear condition.if the speed reaches below 41 km/hr, the fourth gear state shifts to the third gear state as per the given condition.
- FIFTH GEAR STATE: When the vehicle reaches above the speed of 61km/hr, it satisfies the fifth gear conditions. if the speed reaches below 61km/hr, the fifth gear state shifts to the fourth gear state as per the given condition.
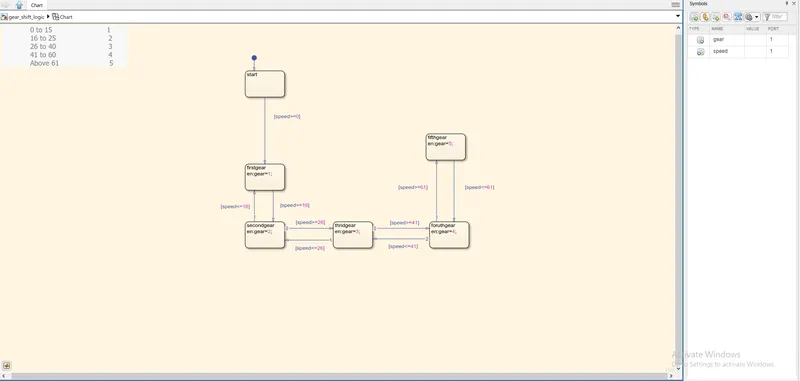
and the symbols plane on the top right corner is used to derive the input and output values .
DISPLAY BLOCK: The display is used to show the output results.
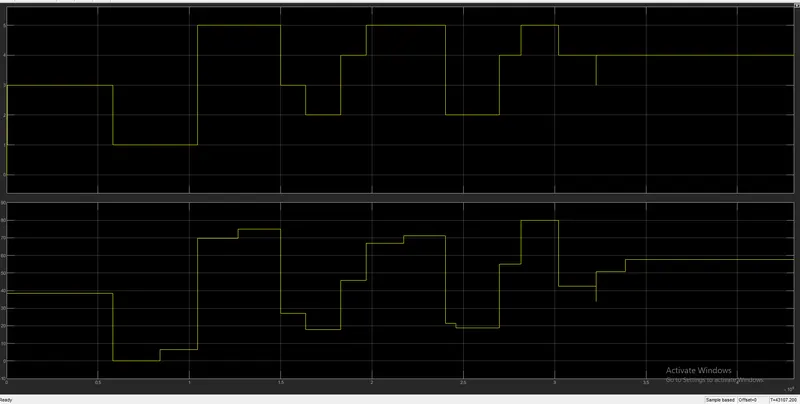
SCOPE BLOCK: the scope is used to display the output in terms of graphical form.
SLIDER BLOCK: This block is used to change values of input given while the simulation is running.
LAMP BLOCK : This block is used to show the change in output values in the form of color.
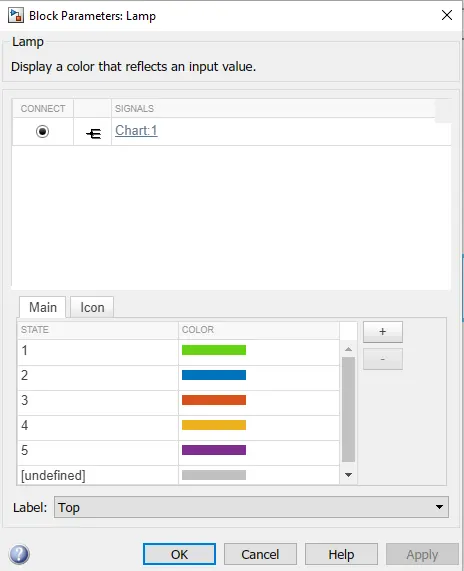
the model of gear shift logic using state flow is
RESULTS :
Giving inputs while the simulation is running and results are displayed in graphical form through scope and lamp indicates which gear when input speed is given