Week - 4
Task 1.
Aim: To Implement control logic of a “washing machine” using Stateflow.
Objectives:
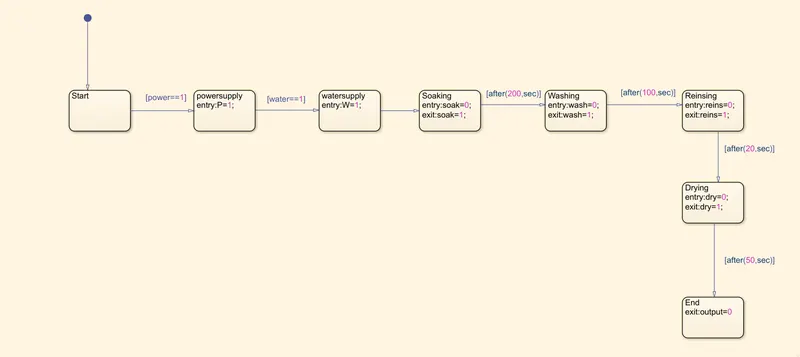
- If the power supply is available, the system gets activated .
- If the Water supply is not available, stop the process & indicate through LED.
- Soaking time should be 200s followed by Washing time of 100s.
- Then rinsing happens for next 20s & dryer runs for 50s.
MODEL:
The file which contains the model is attached below.
Block Diagram: logic of a “washing machine” using Stateflow.
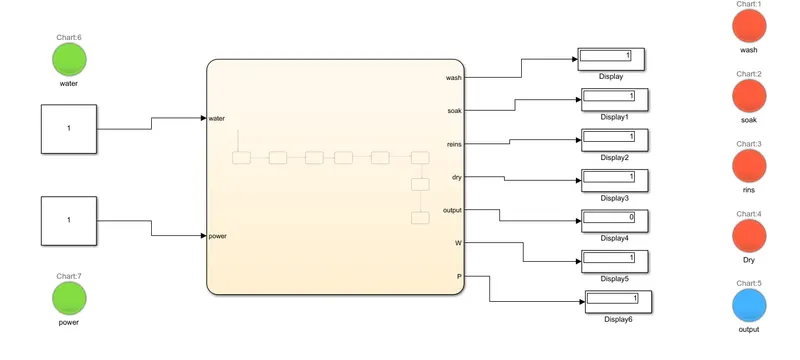
Parameters: Conditions:
1. The value 0 means there is input. 1.When the Lamp shows red the task is in progress.
2. The value 1 means there is no input. 2.When thre Lamp shows green the is finished.
Chart diagram:
Parameters:
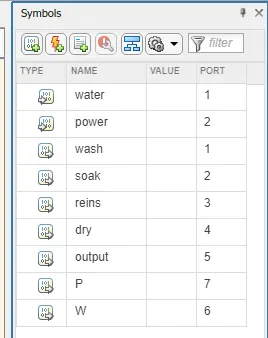
We have given wash,soak,reins,dry,output as outputs of the chart.
We have given water,power as inputs of the chart.
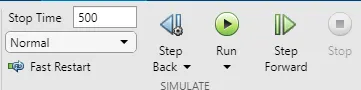
Simulation time:
We have give 500 so it can cover the whole cycle and ther will be enough time to store the values.
Output:
There are two conditions asked solve in the question.
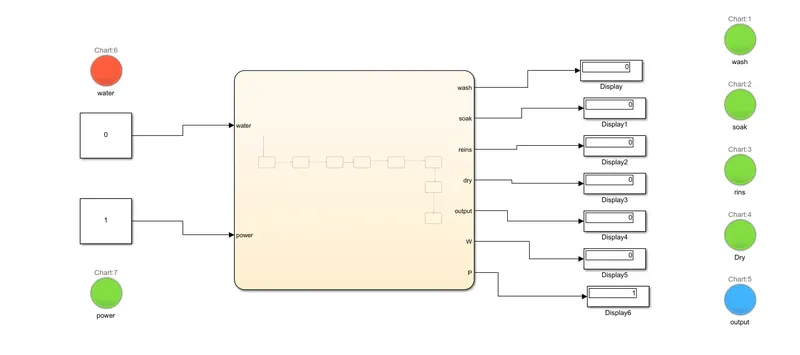
Condition 1: When the Water supply is OFF.
We have not provided the water supply and checked the output.
Parameters: Conditions:
1. The value 0 means there is input. 1.When the Lamp shows red the task is in progress.
2. The value 1 means there is no input. 2.When thre Lamp shows green the is finished
3. But for water and power we given opposite way.
In thre above block diagram we see the water supply is stopped it indicates as red and the whole cycle stopped.
Condition 2: When the Water supply is ON.
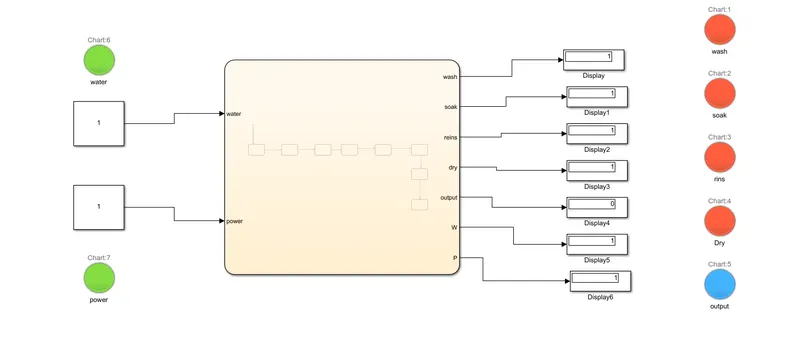
We have provided the water supply and checked the output.
Parameters: Conditions:
1. The value 0 means there is input. 1.When the Lamp shows red the task is in progress.
2. The value 1 means there is no input. 2.When thre Lamp shows green the is finished
3. But for water and power we given opposite way.
In thre above block diagram we see the water supply is given and it indicates as green and the whole cycle is processing and out is given in blue colour.
CONCLUSION: The control logic of a “washing machine” using Stateflow is done and the results are discussed above.
Task 2.
Aim: To make a Simulink chart for the “Gear shift” logic as per below conditions.
Objectives:
Speed Range(kmph) Gear
0 to 15 1
16 to 25 2
26 to 40 3
41 to 60 4
Above 61 5
Give speed input while the simulation is running & display the gear number.
MODEL:
The file which contains the model is attached below.
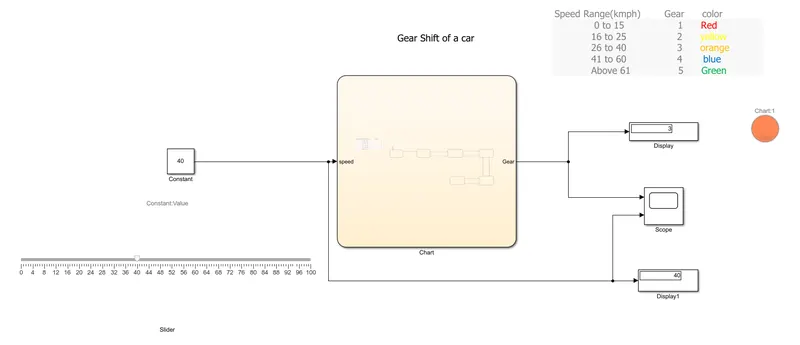
Chart Diagram:
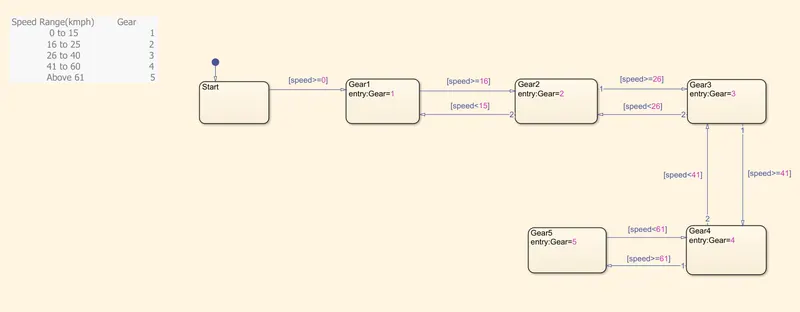
Parameters:
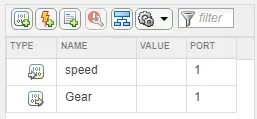
Here we speed as input for the chart.
Here we Gear as output for the chart.
Simulation Time:
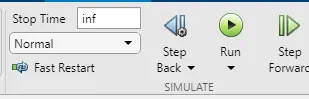
INPUTS:
We used SLIDER block attached to constant to give the inputs for the cycle.
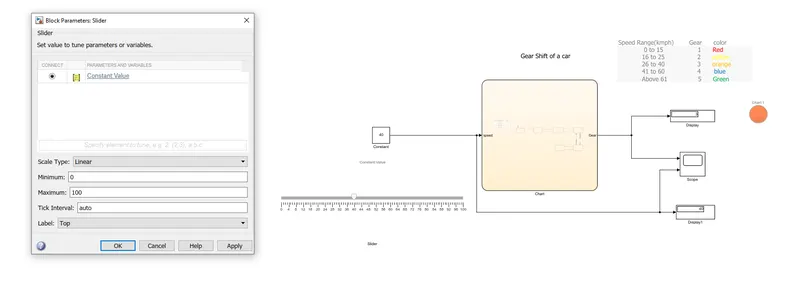
Here we given minimum and maximum value as 0 and 100 for the scale.
Here we also scope to display the graphical representation of speed and grear change.
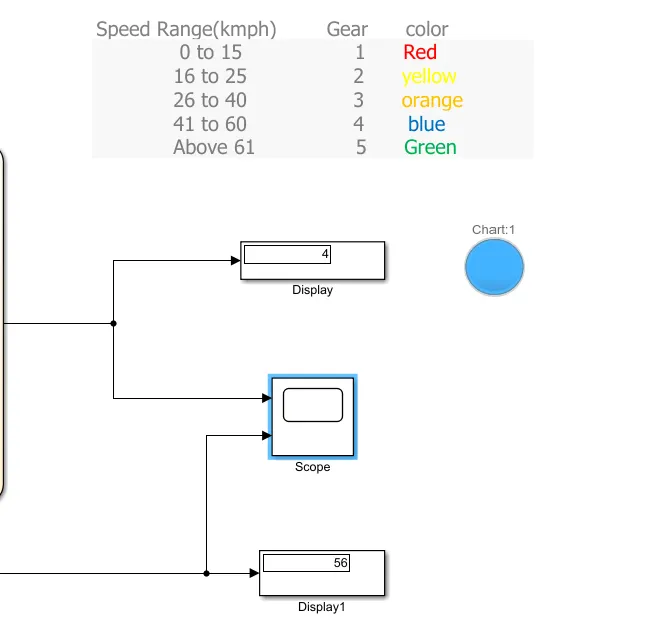
Here we used Lamp block to display seperate color for each gear and Display blocks to show the final gear and speed.\
OUTPUT:
We RUN the cycle and change the values on slider continuosly and stop.Now the different speeds and its grears is shown in graphical form.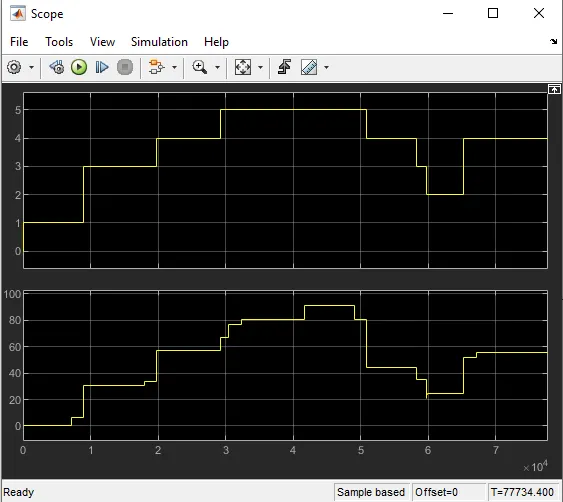
We assigned colors to display when the gear is in perticular gear.
Speed Range(kmph) Gear color
0 to 15 1 Red
16 to 25 2 yellow
26 to 40 3 orange
41 to 60 4 blue
Above 61 5 Green
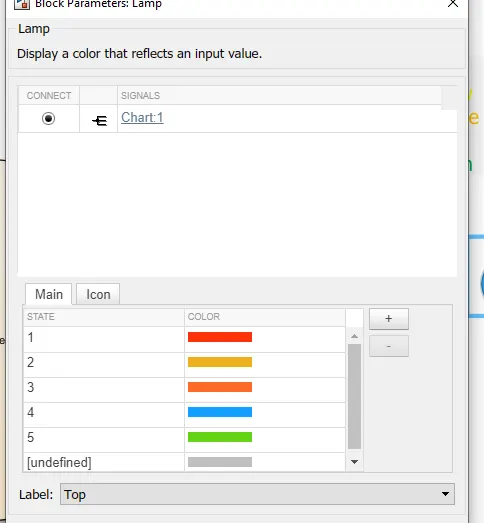
Finaly we stoped at speed 56 it means gear 4, so the lamp displays blue color as we assigned.