Week - 4
1) Aim:- Implement the control logic of a “washing machine” using Stateflow as per the given sequence:
- If the power supply is available, the system gets activated
- If the Water supply is not available, stop the process & indicate through LED
- Soaking time should be 200s followed by Washing time of 100s.
- Then rinsing happens for the next 20s & dryer runs for 50s
After all the processes have been completed turn on the finished LED
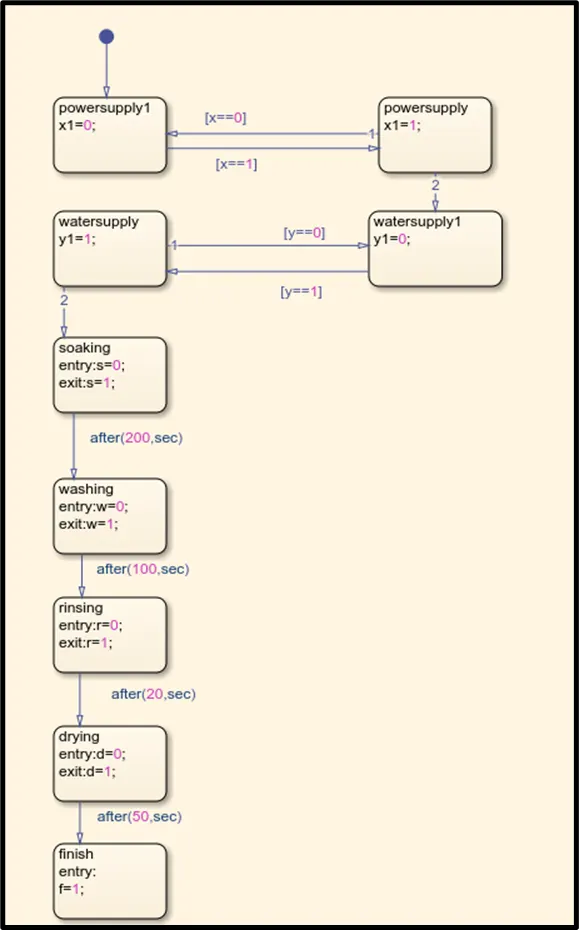
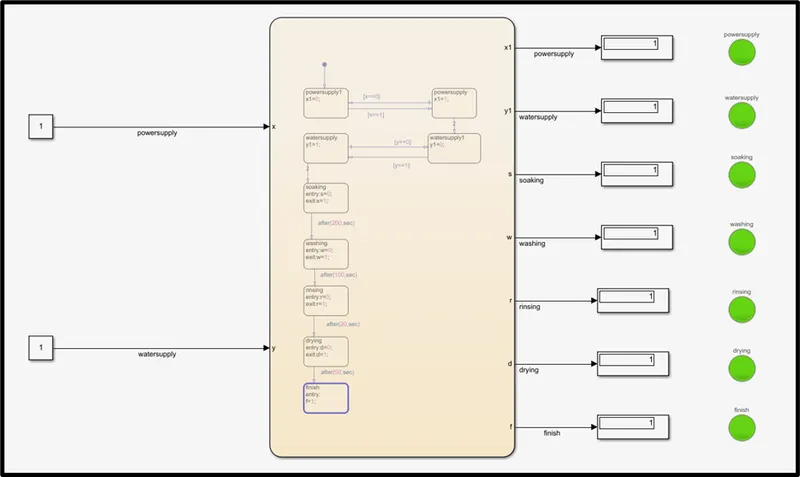
The below figure depicts the control logic of a washing machine. The condition is given using a constant block that is whether the power supply is in ON or OFF state i.e. 1 or 0. If the power supply is ON condition it moves on to the next condition which is the water supply. Once again if the state is in ON condition then it moves to the next step which is soaking. The soaking period is of 200 sec . after the 200sec completion the next step is followed which is washing this state is of 100sec, the next state is rinsing which is of the duration 20 seconds the drying state is 50 sec once the drying is done the process is completed and is given to the finish state. The output of every state is given using a display and the indication of each of the states is given by the lamp.
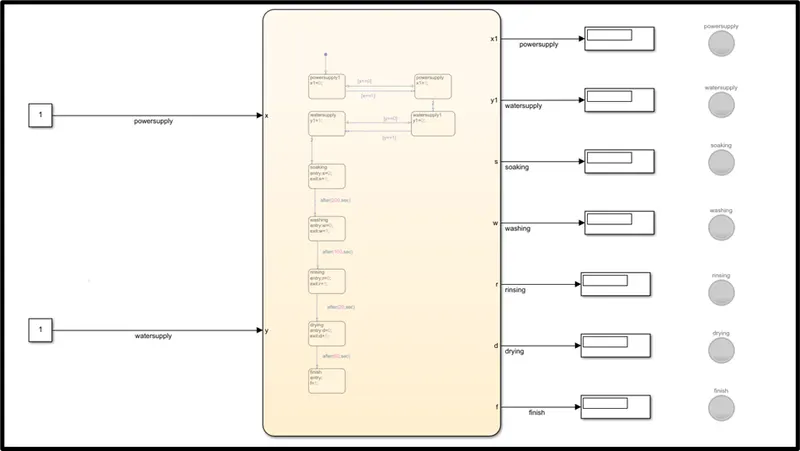
The Stateflow is given in the below figure.
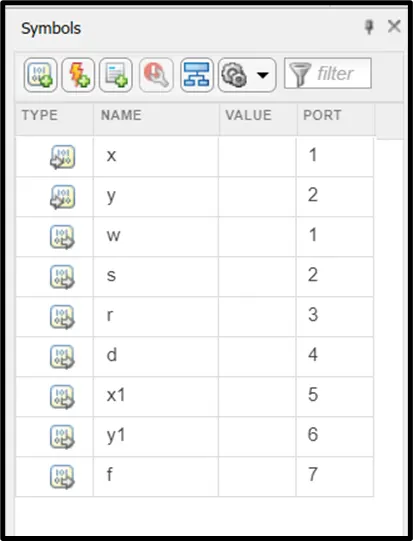
The below figures shows the attributes used in the above Stateflow and it is shown in the symbol pane. The ‘x’ and ‘y’ are used as input data and the remaining ‘w’, ‘s’, ‘r’, ‘d’, ‘x1’, ‘y1’, and ‘f’ are the output data.
After running the simulation by keeping the stop time at infinity, we can change the input state of the power supply and water supply from 0 to 1 and check the output state. And as can be seen below the states of both the inputs are 1, that is both the power supply and the water supply are in ON condition and the lamp turns green on the output side and after each stage gets complete as per the given time the lamp turns green and the state is shown as 1 in the display.
2) Aim:- To make a Simulink chart for the “Gear shift” logic as per the below conditions:
Speed Range(kmph) Gear
0 to 15 1
16 to 25 2
26 to 40 3
41 to 60 4
Above 61 5
And to give speed input while the simulation is running & display the gear number.
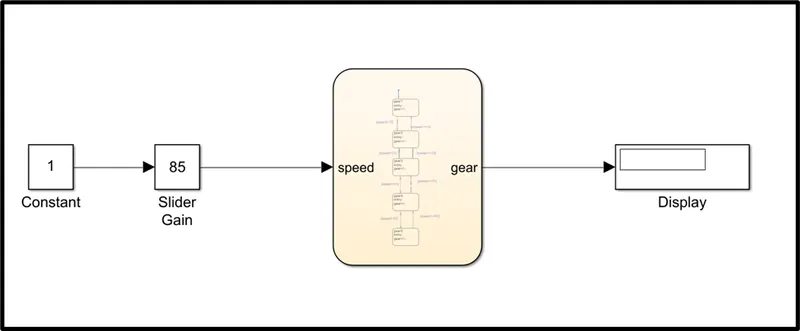
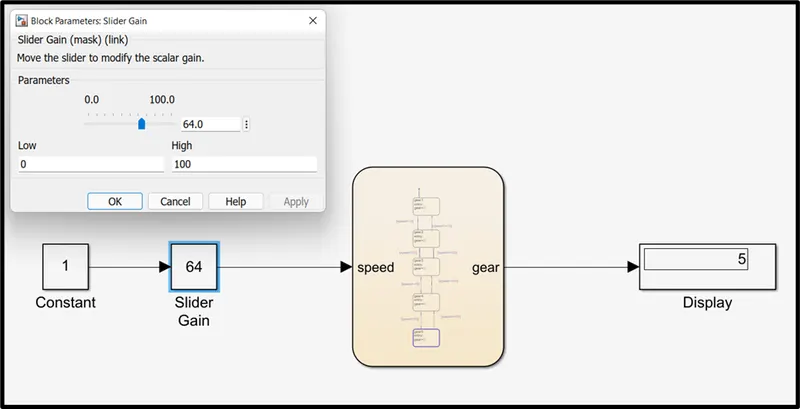
The above figure is a realization of the gear shift using a slider gain to depict the change in speed and based on the speed the gear shift takes place using the Stateflow and is given using the display.
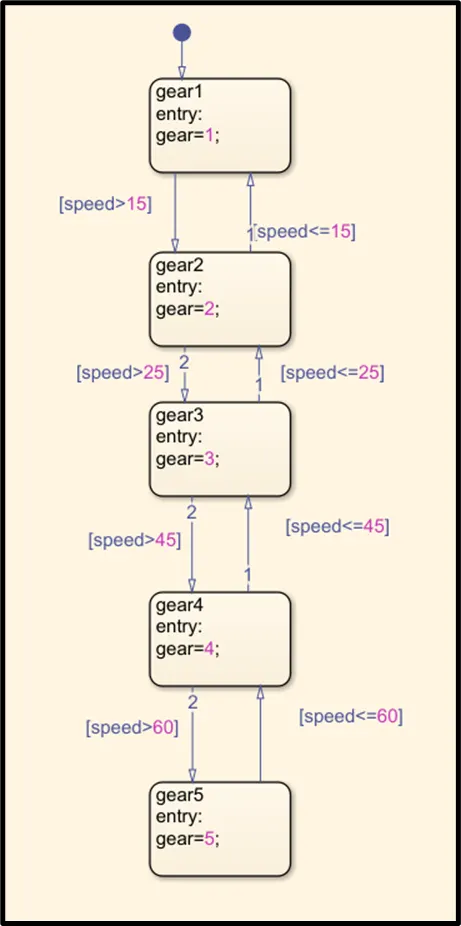
The logic is shown below for the gear shift. Here the gear is shifted from 1 to 2 when the speed is above 15 kmph and vice versa. Similarly, if the speed is increased above 25kmph the gear is shifted from 2 to 3 and vice versa, also the gear is shifted from 3to 4 when the speed increases above 45 kmph and if the speed crosses 60 kmph the gear is shifted to gear 5.
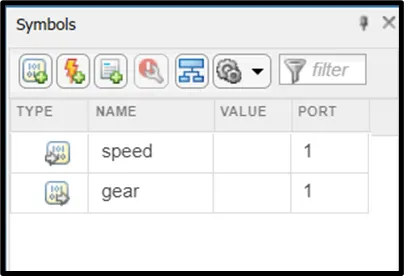
The speed is the input data and gear is the output data for the Stateflow , as shown below.
The below figure shows the output when the slider is adjusted to 64 kmph as 5. That is the gear is shifted to gear 5 since the speed is beyond 60kmph. And if the slider gain is kept on 35kmph the resultant on the display will be 3 that is gear 3. This concludes that we have achieved the desired output.