Week -2
1. Simulink model of a Doorbell using Solenoid block:
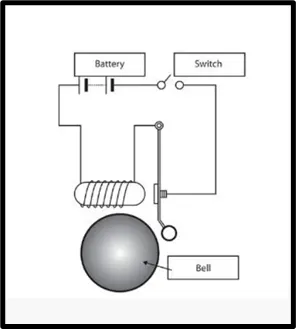
Aim:- To create a situation where the switch is closed for 2 seconds and then released and to observe the physical movement of the plunger.
Output:- To get the output we need an output block that is the scope.
Input:- For this model, the input is given with a pulse generator.
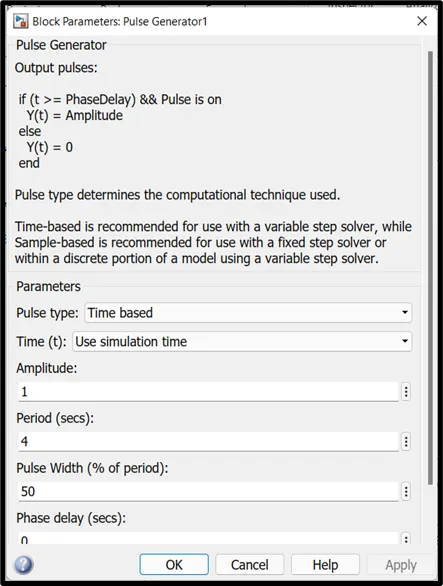
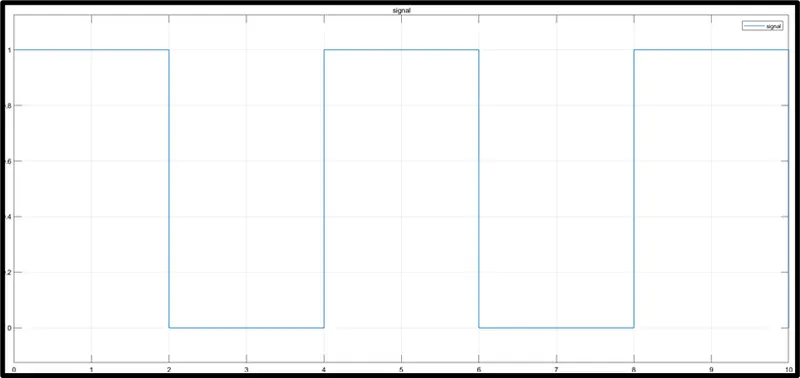
The pulse generator inputs are, the amplitude is 1, the period of one cycle is 4 secs, and the pulse width (% of period) is 50%.
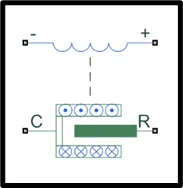
As we can see below is a block of a solenoid that is equipped with an electromagnetic coil and a plunger.
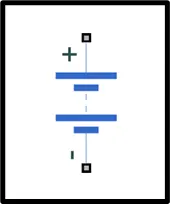
This block is a battery. The output is connected to the solenoid.
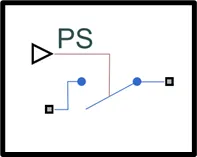
The block represents a switch controlled by an external physical signal. If the external physical signal PS is greater than the threshold, then the switch is closed, otherwise, the switch is open.
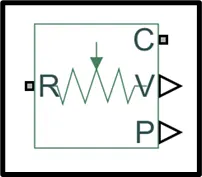
This block measures velocity or displacement in a mechanical translational network. The sensor is ideal since it does not account for inertia, friction, delays, energy consumption, and so on.
This block defines solver settings to use for simulation.
After placing all the blocks individually, we need to connect them together, which looks like as depicted below.
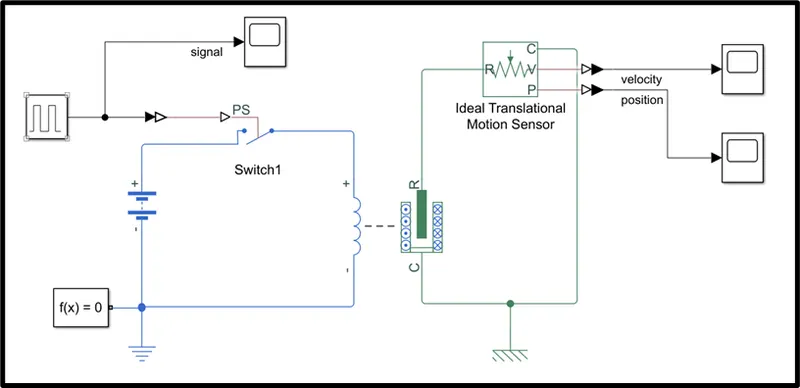
For the model, a pulse wave is used as an input signal, the amplitude is 1, the period of one cycle is 4 secs, and the pulse width (% of period) is 50% .this signal is further given to the Simulink-PS converter. It converts the Simulink input signal to a physical signal. It is further fed to a switch which is used to control the pulse signal, if the signal is greater than the threshold, then the switch is closed, otherwise switch is open. A battery is used as a source for the solenoid, it is connected to both the solenoid as well as the switch. The solenoid block implements the electrical and mechanical characteristics. The solenoid mechanical part which is the plunger is connected to an ideal translational motion sensor. This block measures velocity or displacement in a mechanical translational network. The sensor is ideal since it does not account for inertia, friction, delays, energy consumption, and so on. The measured signal is converted from physical to Simulink output with the help of a PS-Simulink converter. This signal I finally fed to the scope. The scope gives the result or the output in the form of a waveform.
The image shows the input waveform of the above simulation.
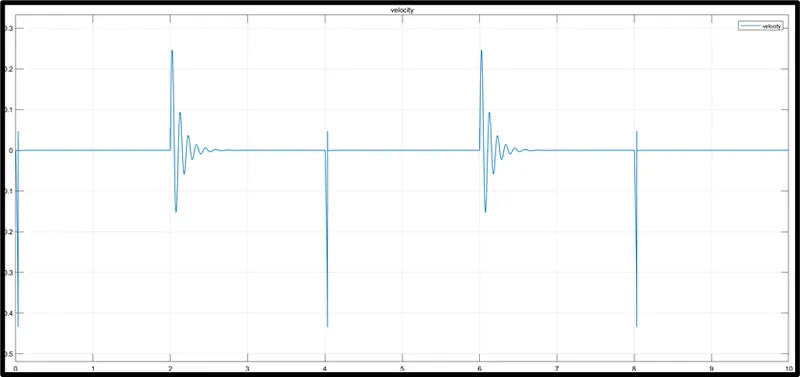
The below plot of the graph shows the output of the velocity of the plunger every 2 seconds. The maximum velocity of the plunger is 2.474e-01m/sec.
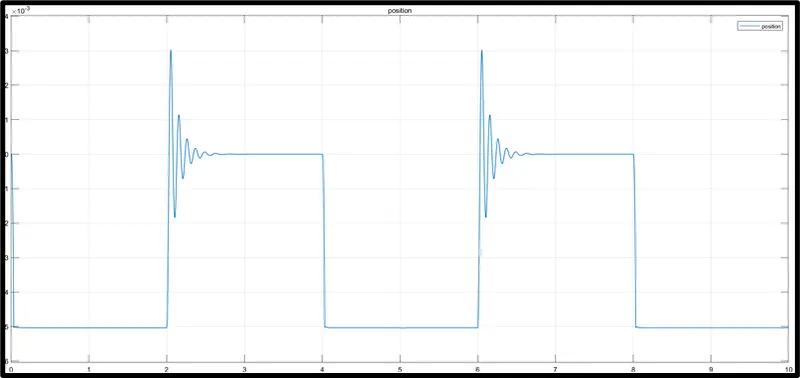
The next graph shows the output for the position of the plunger displaced after 2 seconds. The amplitude is 4.997e-03 and the frequency is 250 mHz. And the duty cycle is 49.855%.
2. Use a thermistor to sense the temperature of a heater & turn on or turn off the fan as per the below conditions:
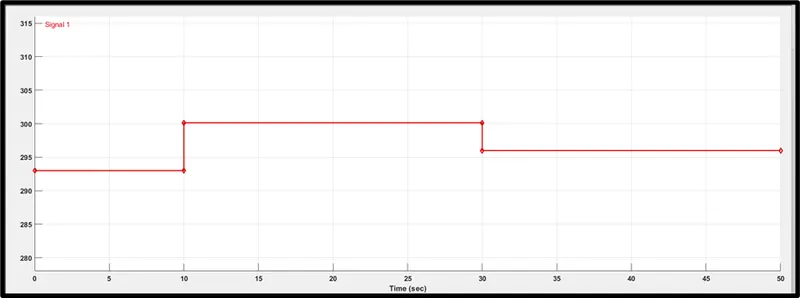
Aim:- To maintain the temperature of 20 °C from 0 to 10 seconds, 27 °C from 10 to 30 seconds, 23 °C from 30 to 50 seconds and to ON the fan if the temperature is above 25 °C and OFF otherwise.
Output:- To get the output we need an output block that is the scope.
Input:- For this model, the input is given with a pulse generator.
The pulse is generated using the pulse generator block which is depicted below. The temperature values are taken in kelvin. And the values are 20o C= 293.15K, 27oC = 300.15K, 23oC= 296.15K.
This block represents an ideal energy source in a thermal network that can maintain a controlled temperature difference regardless of the heat flow rate.
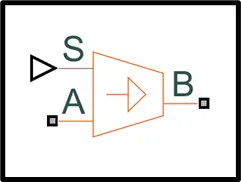
The Thermistor block represents an NTC thermistor using the B-parameter equation. The resistance at temperature T is
R=R0eB(1/T−1/T0)
where:
- R0is the nominal resistance at the reference temperature T0.
- Bis the characteristic temperature constant.
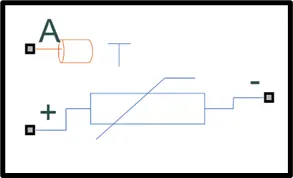
The following equation describes the thermal behavior of the block:
Q=Kdtc dT/dt
where:
- Qis the net heat flow into port A.
- Kdis the Dissipation factor parameter value.
- tcis the Thermal time constant parameter value.
- dT/dtis the rate of change of the temperature.
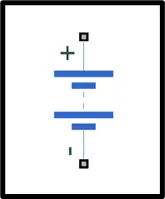
This block represents a battery that is used to power the thermistor.
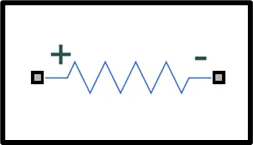
The next block is a switch. This switch consists of 3 ports. The first and third input ports are data ports, and the second input port is the control port.
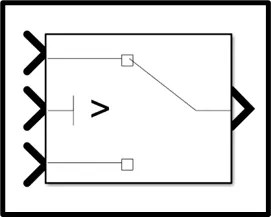
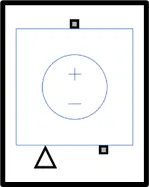
The block represents an ideal voltage source that is powerful enough to maintain the specified voltage at its output regardless of the current passing through it.
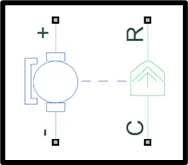
The block represents a dc motor. It is an electromechanical device that works on electrical energy converting into mechanical energy that is in terms of rotations. This acts as a fan in a Simulink model.
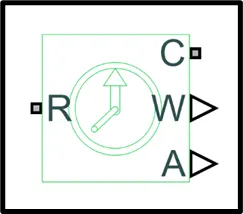
This block measures angular velocity or angle in a mechanical rotational network. The sensor is ideal since it does not account for inertia, friction, delays, energy consumption, and so on.
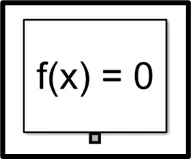
This block defines solver settings to use for simulation.
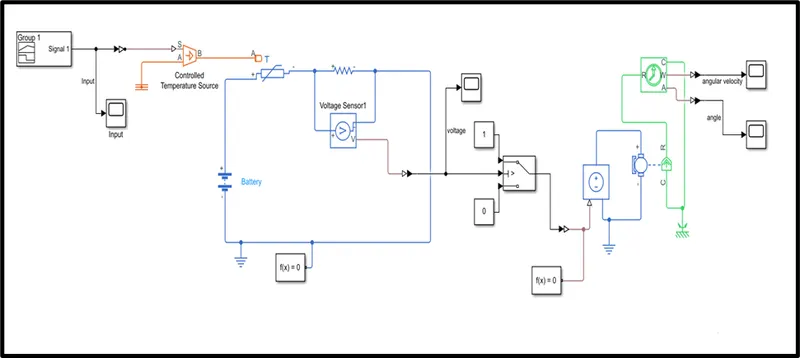
In this simulation, a signal builder is used for giving the input signal to the thermistor. the signal is converted to a physical signal with the help of a Simulink -PS converter. Further, this signal is given to the controlled temperature source which acts as an ideal energy source in a thermal network that can maintain a controlled temperature difference regardless of the heat flow rate. This signal is given to the thermistor. Here the thermistor has a high resistance at the start since it is cold but as the temperature increases because of the supply, the resistance drops and current flows through it. A voltage sensor is connected across a linear resistance which acts as an ideal voltage sensor converting voltage measured between any electrical connection into a physical signal. The output voltage is fed to the switch having a threshold voltage of 9.074V. the switch is closed when the temperature goes above 25o which is 298.15K. resulting in the fan being turned ON. The signal from the switch is then fed to the controlled voltage source with the help of a Simulink- PS converter into the D.C motor. The DC motor then converts the signal into the mechanical form. The torque generated by the motor is measured by the ideal rotational sensor and the final output is obtained in the form of angular velocity and the angle that is the displacement.
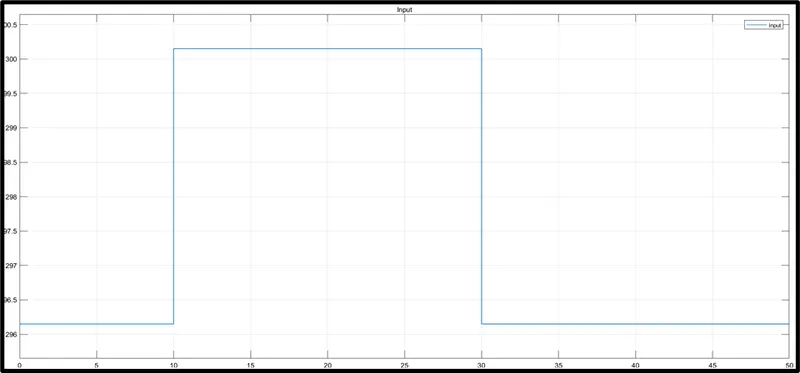
The above image shows the input from the signal builder on the scope and the values are in Kelvin.
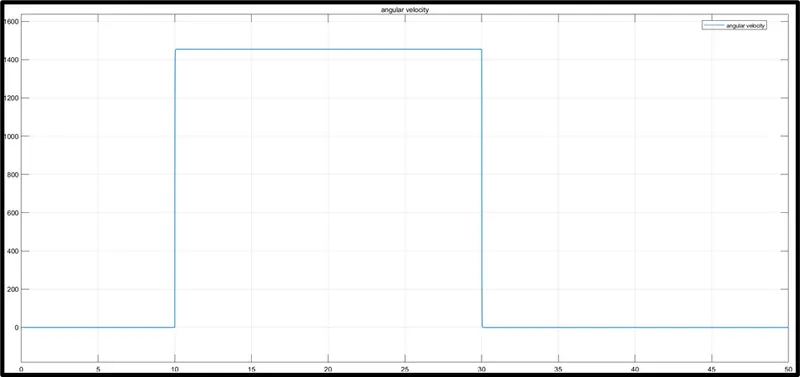
The image shows the output which is the angular velocity of the motor when the input is given. It can be clearly seen that at time t=10seconds, the angular velocity rises sharply and the peak value it attains is around 1454.44rad/sec. this clearly shows that there is a movement in the motor at time t=10 seconds when the temperature goes above 25oC which is 298.15K.
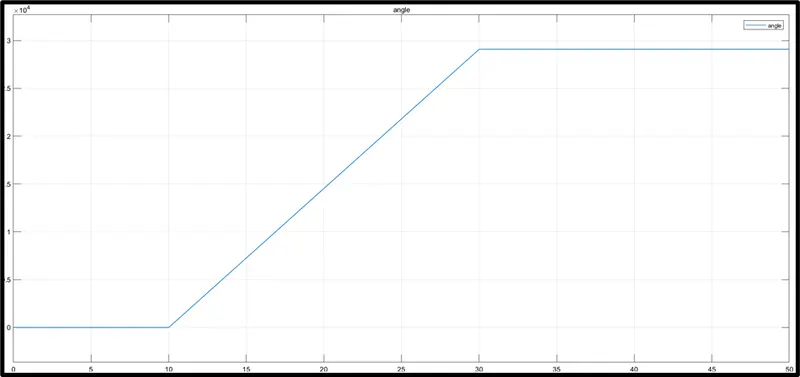
The above image shows the angle of the motor or the angular displacement of the motor. At t=0 sec, the displacement is 0, but as it crosses 10 seconds it gradually increases, and after 30 seconds the value again remains constant. this clearly depicts that we have achieved the output as desired that, when the temperature exceeds 25oC the fan is ON, otherwise it is OFF.