Week - 4
1). Control logic of Washing machine using stateflow
ans). Washing machine is spinning at speed of 800-1600RPM by power supply. In washing machine the machine use water and detergent to wash the clothes by spinning in clock wise and anti clockwise direction.
in this stateflow first i have use the chart to make program for provide the command to machine, so you can see picture below.
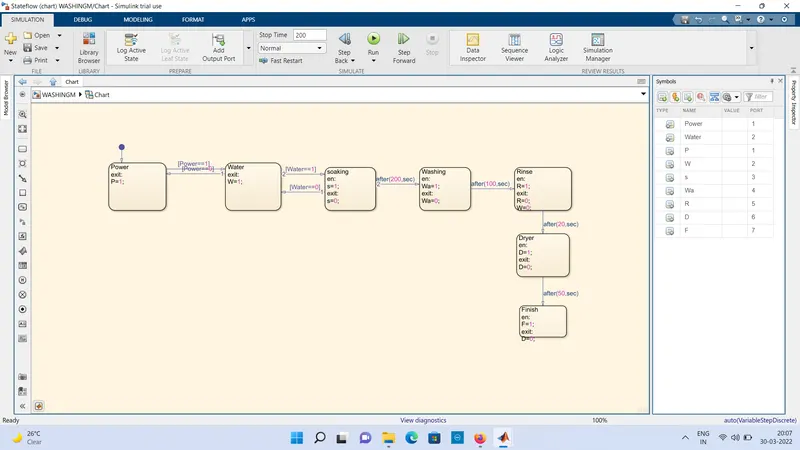
then i have to connect state program to symbol plane, in which some are input and some are output
INPUT
- Power
- Water
OUTPUT
- P
- W
- S
- Wa
- R
- D
- F
then the input and output are shown out side the chart that is also in picture below
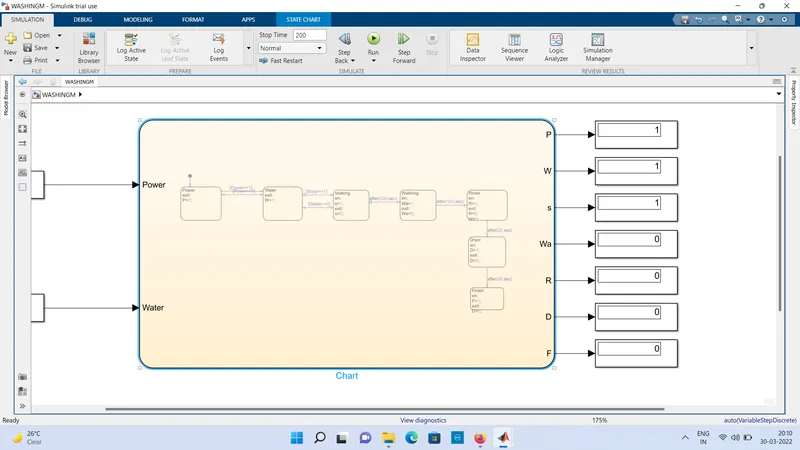
The inputs are connect to constant and output are connected to displays.
In the inputs constant their is POWER SUPPLY and WATER SUPPLY which is also connected to ON OFF switch
And the output displays are connected to the round type lamps which is POWER, WATER, SOAKING, WASHING, RINSE, DRYER, FINISH.
WORKING
First the Power supply is on the first led is glow with red colour to indicate the power then
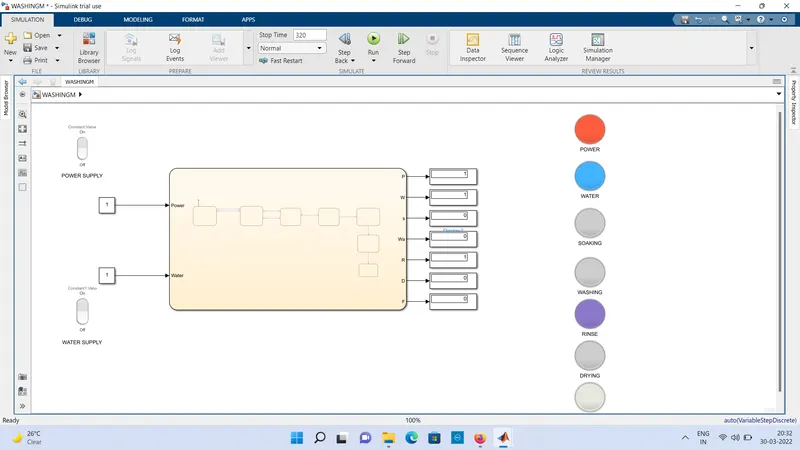
then the Water supply is on the first three led is glow at the stop time 100sec and also same at 200sec,and to indicate the power supply ,water supply and soaking with is show in image below
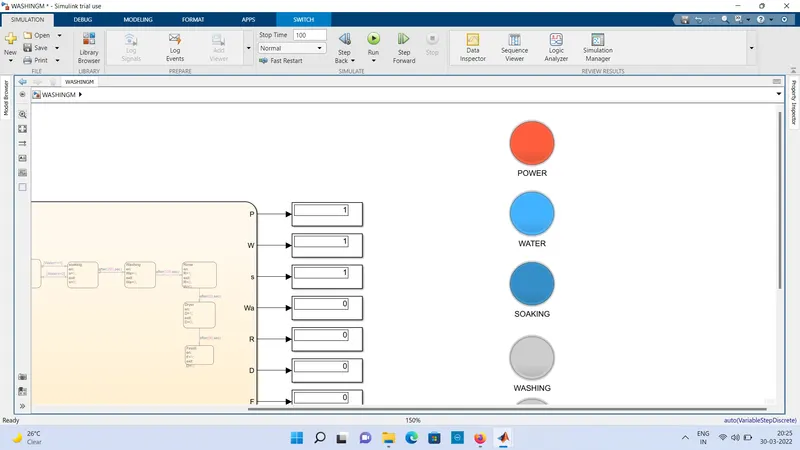
after the stop time 250sec, the soaking will off and start the washing which is also show in picture and washing is shown in blue colour.
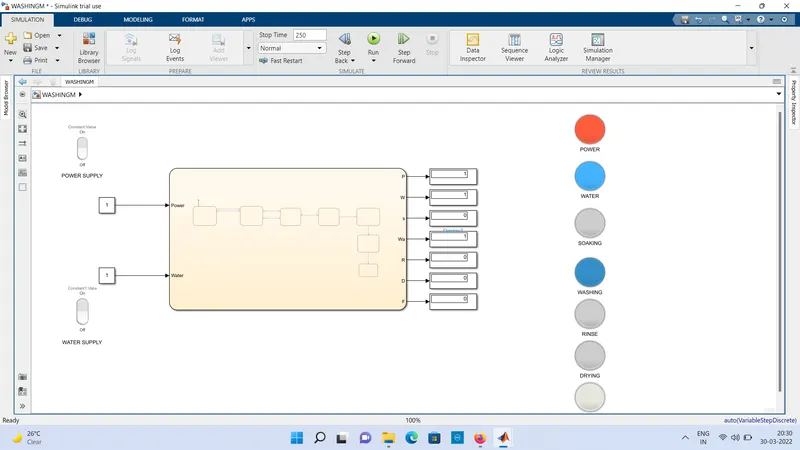
and at the stop time 300-350sec the rinse will start.
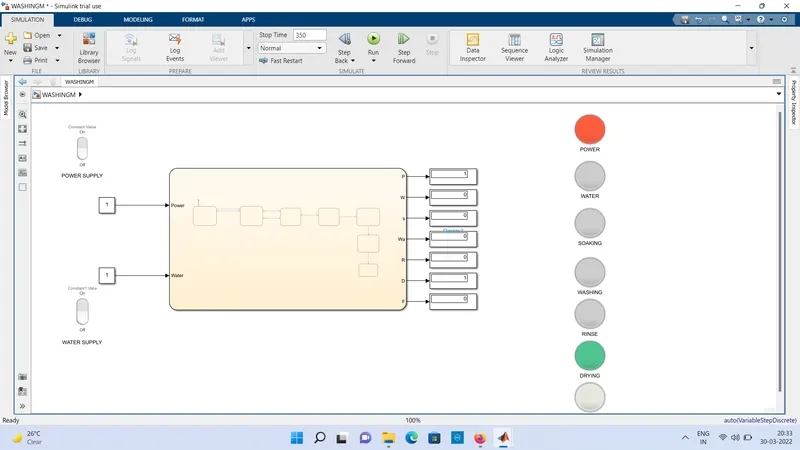
after the stop time 350sec the power and dring will on which is shown in picture
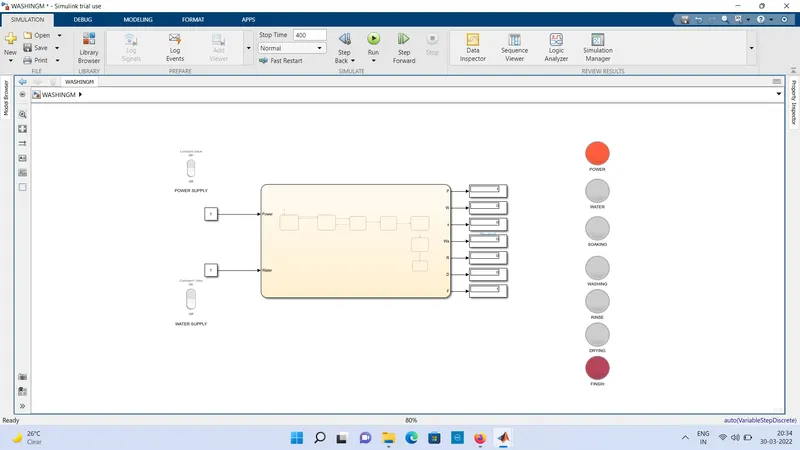
after the stop time 400sec the power and finish will on. that is shown in picture
According to me this is about the washing machine in stateflow by control logic.
2). Gear shift using simulink chart
ans). In a gear shift model first i have take chart where i use states to make a program which is work on speed and gear
that is:- when the speed is 0-15km gear 1, when 16-25km gear 2, when 26-40km gear 3, when speed 41-60km gear 4, and last when speed is above 60 gear 5.
so i make a chart which is shown in picture below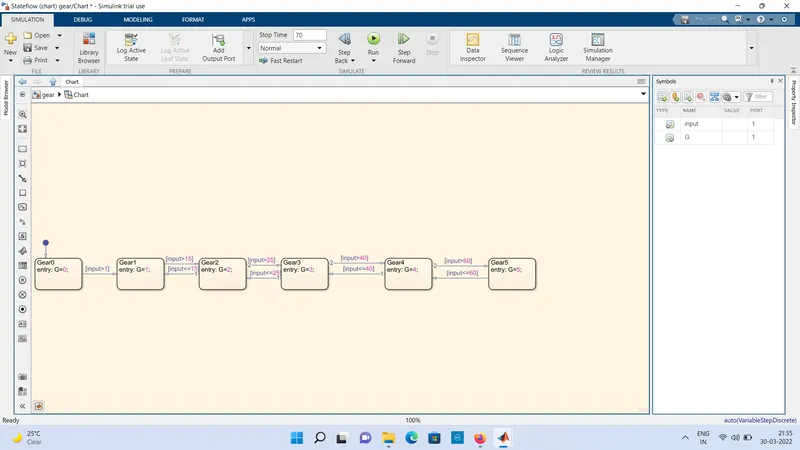
in first state Gear0 when speed<1 (Gear0 entry: G=0;), in Gear1 speed is 0-15km that is (Gear1 entry: G=1;) and so on and all input of program is shown in picture.
and then states is connected to symbol plane which make input speed and output gear outside chart block. which is shown in picture.
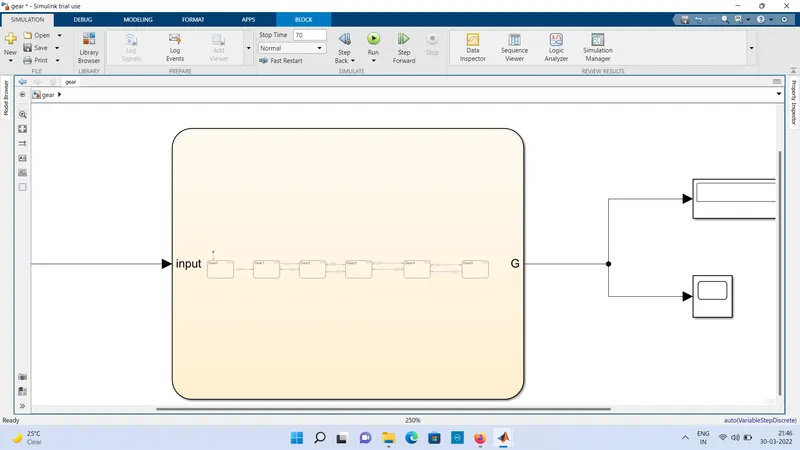
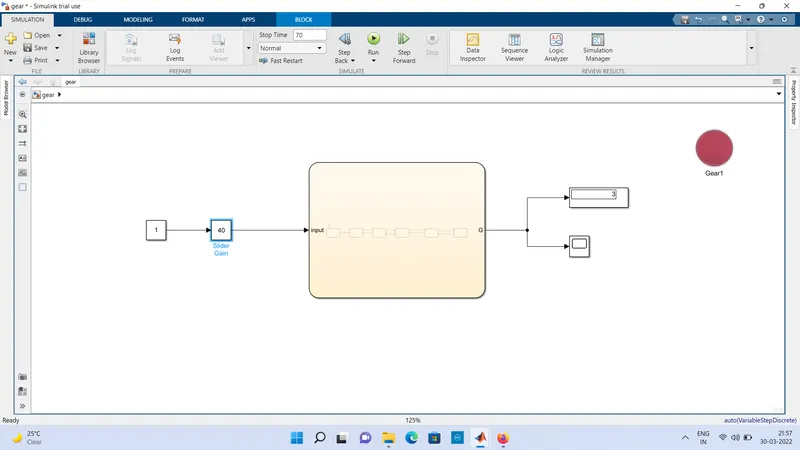
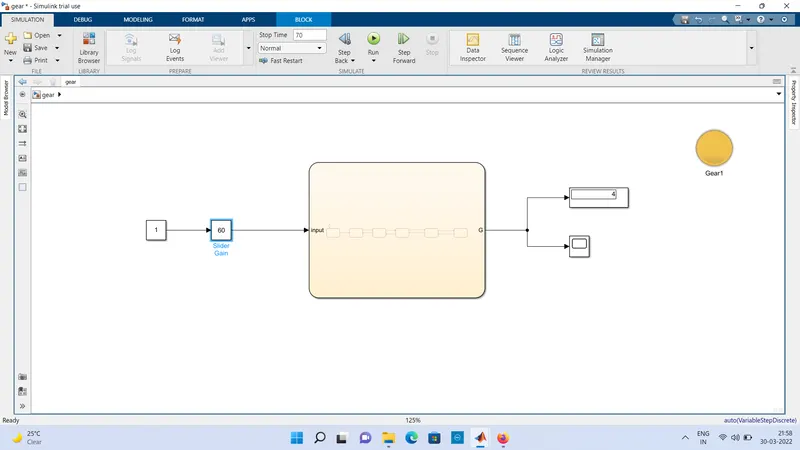
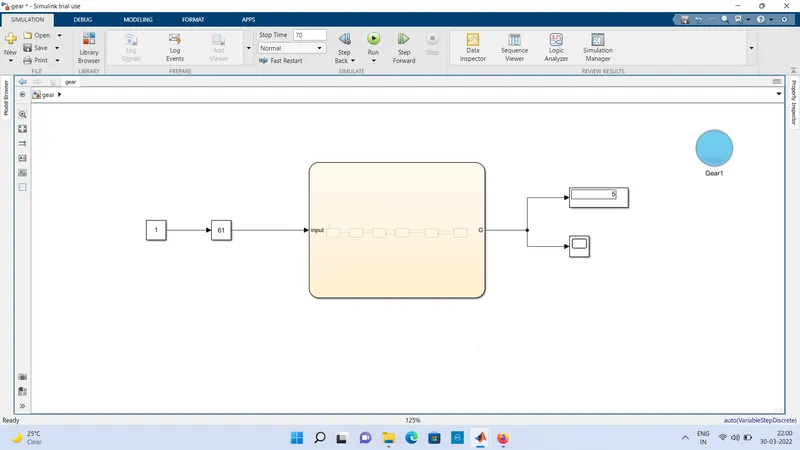
after that in input side i use constant block and slider gain block and in gear side is use display for see Gear and scope for graph and LED for gear projection as colour. the whole model i also share as picture to clear everything.
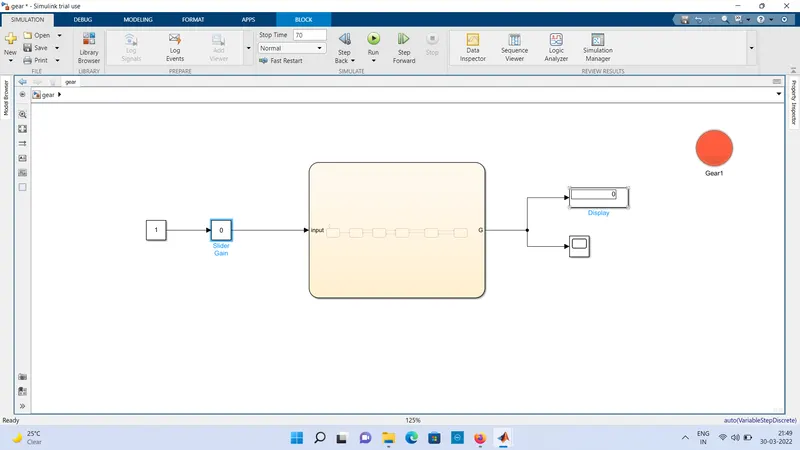
first i have set the stop time is 70sec. when the speed is 0-15km then the gear is 1 is show in display and color blue is shown in LED.
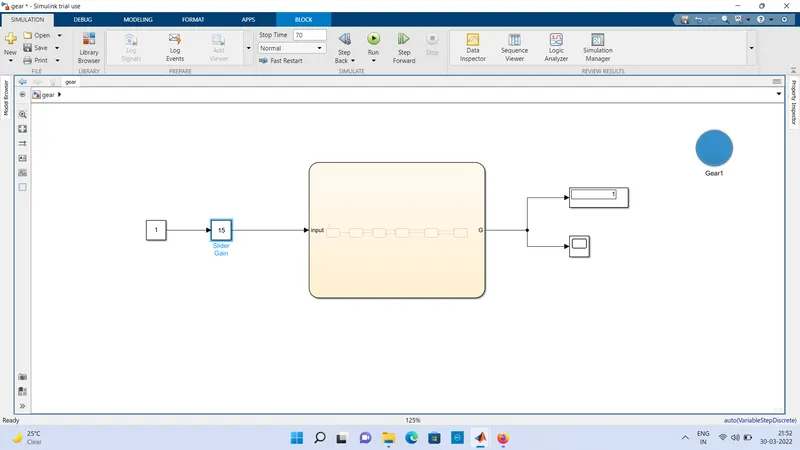
and When speed is 16-25km the gear is 2 shown in display and colour green is shown in LED.see in picture below
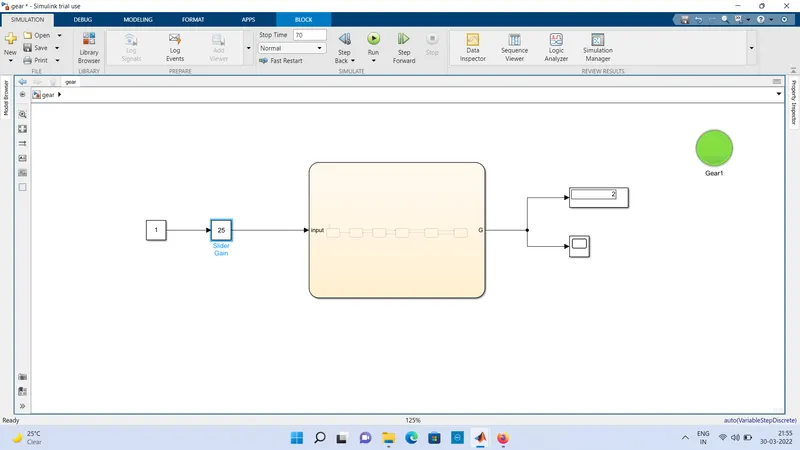
And when speed is 26-40km the gear is 3 and colour is dark pink.
when speed is 41-60km then the gear is 4 and colour is yellow in LED.
finally when the speed is above 60km the gear 5 shown in display and colour is sky blue in LED.
This is the whole working of Gear shift in simulink chart.