Week - 4
1.
https://drive.google.com/file/d/14oaqE-ioHUOKI3sxByGTKlktf1Qc4v_J/view?usp=sharing
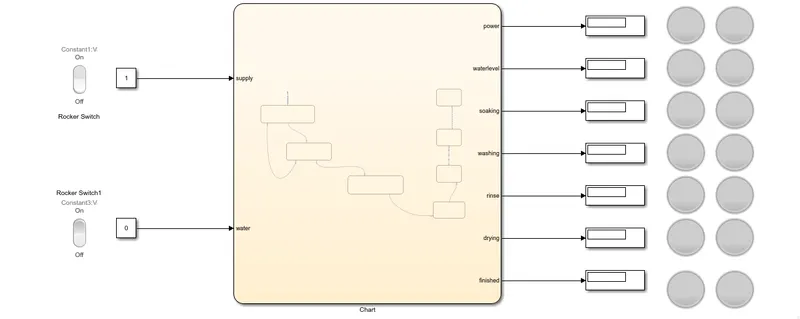
To implement a control logic to the washing machine we have to take a chart in simulink model.
Inside chart :
the selection of number of states of chart depends upon the actions to be performed. Each next step to the state inside a chart depends upon the given condition or time to be performed.
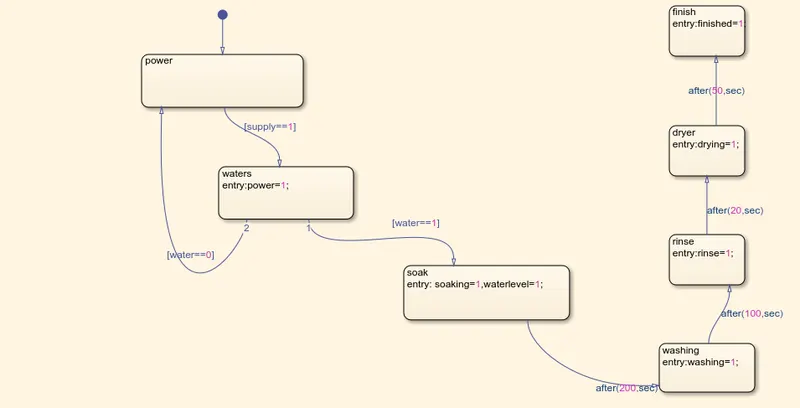
Initially we have to take a state and name the variable as power. The next state action is performed if and only if the input supply is to be ON i.e,, 1. If there is no supply the power will be in OFF state i.e,, 0.
The next state checks whether the water is present or not. If there is no water, the water will be in 0. If there is water, water will be 1 and the next state will be takes place i.e,, soaking. The soaking value will be 1.
After the 200 sec of soaking the machine performs washing and washing value will be 1.
After the 100sec of washing, the rinsing will be takes place i.e,, rinse will be 1.
After 20sec of rinsing, the machine performs drying, i.e,, drying will be 1.
After 50sec of drying, the machine finishes its action and finished will be 1.
By observing the actions inside the chart there are some input data and some output data to be given.
To specify the input and output parameters we have to go to
prepare > symbols pane > symbols
there will be bunch of data which we are able to see on the right. We have to specify them as input and output data by double clicking it.
The input data is supply and water. The output data is power, water, soaking, washing, rinse, drying and finished.
inside the model :
On the left of chart we can see the inputs like supply and water. For them we need constant blocks from the library and connect them.
For the better manual operation we need a rocker switch which is connected to the connection of inputs.
On the right side of a chart we can able to see the output data. Each port should be connected to display block to show 0 or 1.
For a better indication of 0 or 1. Let us connect the lamp over the connection of output to display connection. We have to connect the two lamps over them because one of them indicates the color of green when the signal is 1 and another lamp indicates red in color when the signal is 0.
For every output data port we need to connect the set of two lamps which indicates red and green as discussed above.
Operation :
case 1:
Initially there is no supply and no water provided. As we know if there no input the output will be zero and one lamp from the couple of lamps will be seen red in color.
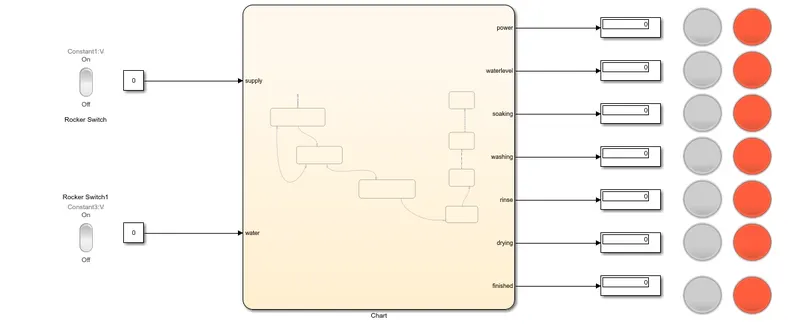
case 2:
When the switch of supply will be on and switch of water is off.
In this condition only power will be in on condition and the remaining operation of machine will not be performed because if there is no water the steps iniside the chart will not be performed as per the condition.
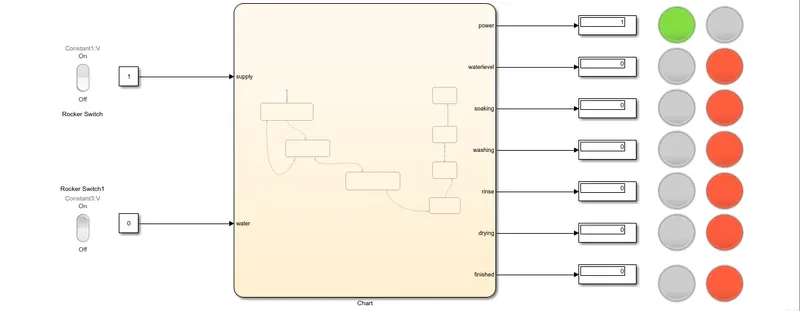
only the green lamp of power output will glows and the remaining lamps of output ports will be seen in red color.
case 3:
When the switch of power is off and the switch of water is on.
In this condition the whole system is in off state because if there is no supply the machine is not going to perform any action.
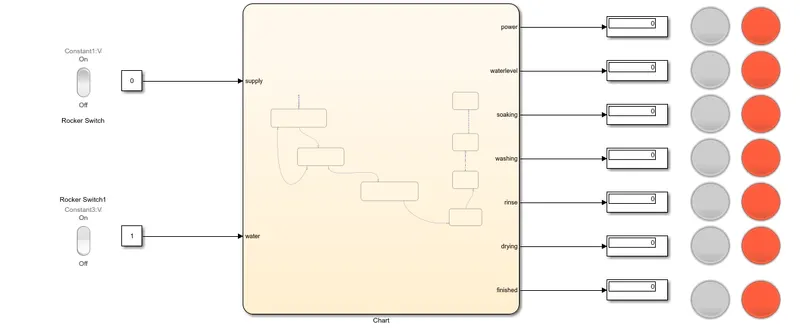
lamp from every set of lamps indicates red in color because there is no supply.
case 4:
When the switch of power is on and the switch of water is on.
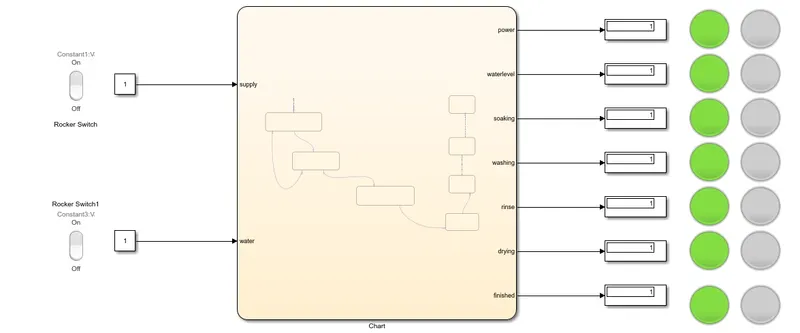
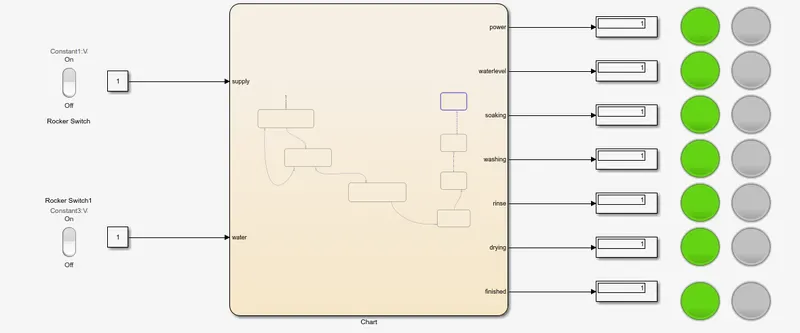
In this condition system performs its function whole heartedly. When we run the simulink model by hitting the run button,one lamp from the set of lamps will be in green color because all the actions will be performed at one instant of time.
If we slow down our action and run the simulink model at each time step then we can observe that,
1) initially the power of system will be on state and green color lamp of power will glows.
2) when we step forward to time the system indicates the waterlevel and soaking bulbs will be glown.
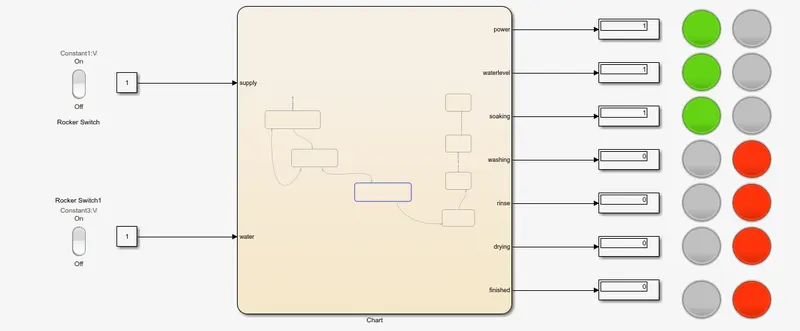
3) when we step forward to the time of 200 sec, the washing will be done and the green lamp of washing output will glows.
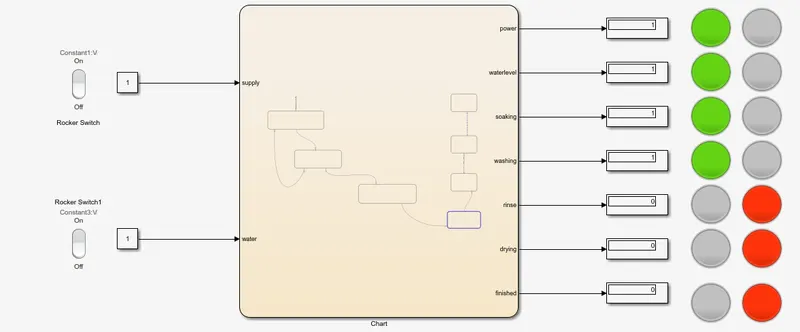
4) when we step forward to the time of 100 sec, the rinsing starts and the green lamp of rinsing output will glows.
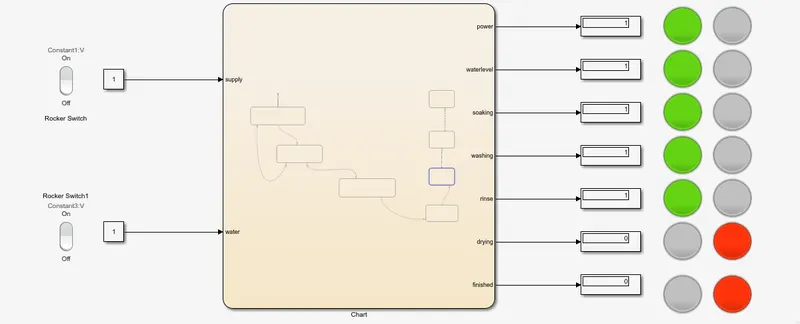
5)when we step forward to the time of 20 sec, the drying starts its action and green lamp of drying output will glows.
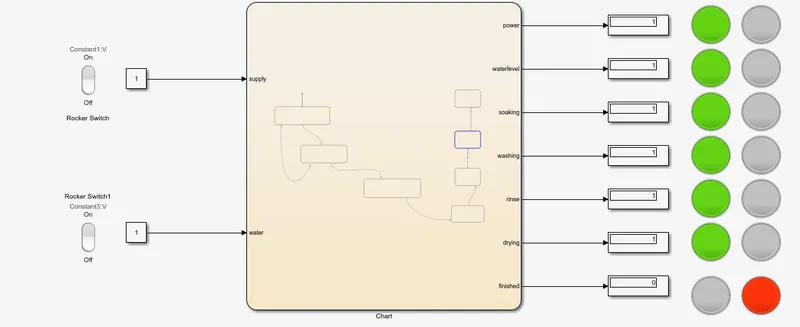
6)when we step forward to the time of 50 sec, the system finishes its performance and green lamp of finished output glows.
2.
https://drive.google.com/file/d/1ehWp2DF34XWZSL0aAYpjZa2CB-EqRP8M/view?usp=sharing
Inside a chart :
to setup a gear shifting device with respect to the speed, we need a conditions which are written and represents different states such as
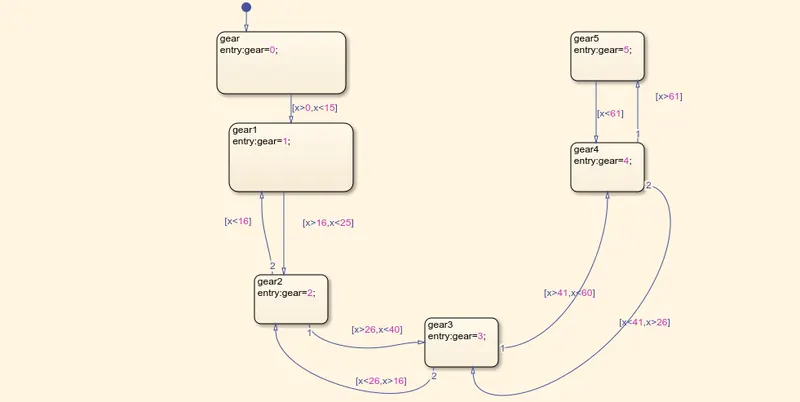
Let us take input data as x which represents the speed and output data as gear.
Here, we need five gears which are written in five different states as shown above. for each state there is a condition to enter and show the number of gear.
The gear1 shows the number of gear is 1 if and only if the input speed i.e,, x is less than 15.
The gear2 shows the number of gear is 2 if and only if the input speed is greater than 16 and less than 25.
The gear3 shows the number of gear is 3 if and only if the input speed is greater than 26 and less than 40.
The gear4 shows the number of gear is 4 if and only if the input speed is greater than 41 and less than 60.
The gear5 shows the number of gear is 5 if and only if the input speed is greater than 61.
If we decrease the speed from gear 5 then the gear number will also be decreased according to the speed as discussed above.
Inside simulink model:
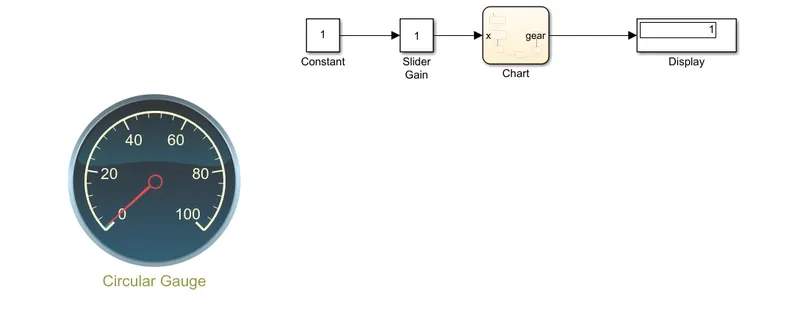
We can see that input data is speed and output data is gear. we need to vary the accelerator as to increase or decrease the speed, to satisfy this we need a slider gain which has minimum value as 0 and maximum value of 100. the input to the slider gain is taken as constant 1.
To indicate the speed of vehicle we need a circular gauge which is connected in between the connection of constant block and slider gain.
The display is connected to the output i.e,, gear of chart to display the gear number.
Operation:
The simulation time needs to set to infinite because there is no fixed time that vehicle is going to stop.
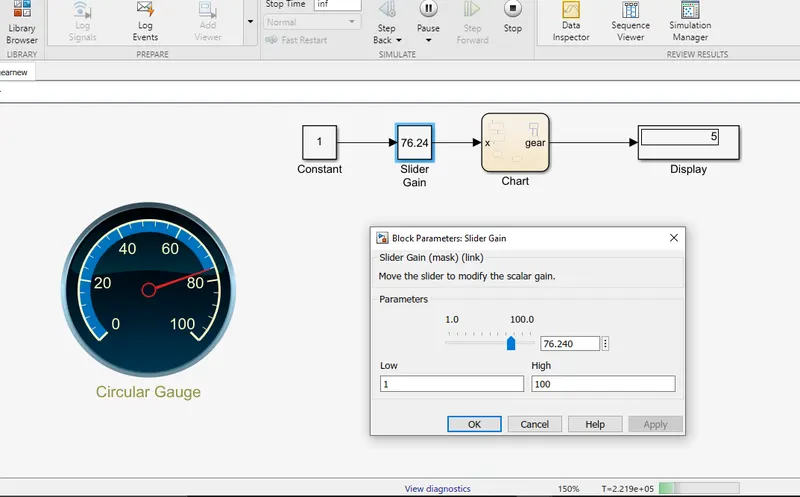
When we run a simulation and open a slider gain and move the slider to a particular point, the speed is displayed in circular guage and gear number is displayed in display block. if we decrease the speed from the peak value then also the gear will decrease.