Week - 4
Q1)control logic of a “washing machine” using Stateflow
CONDITION:
- If the power supply is available, the system gets activated
- If the Water supply is not available, stop the process & indicate through LED
- Soaking time should be 200s followed by Washing time of 100s.
- Then rinsing happens for next 20s & dryer runs for 50s
- After all the processes have completed turn on the finished LED
SIMULATION MODEL:
for using state flow use chart block in simulink
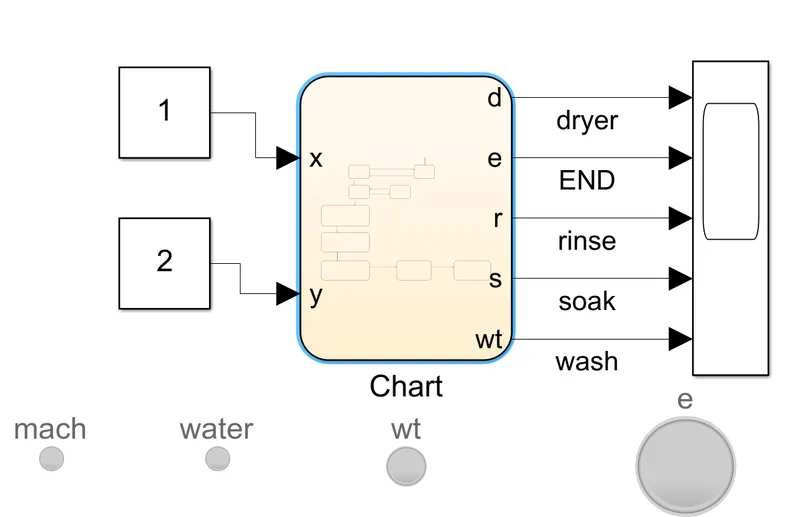
chart block:
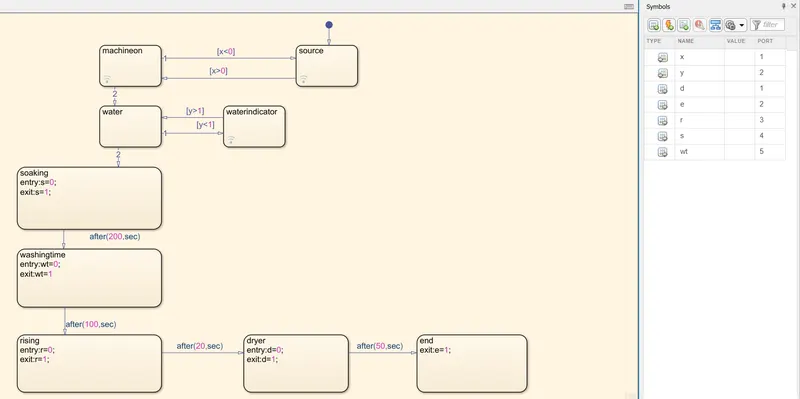
source
- source is used as a power supply when condition is x >0 the washine machine in on condition otherwise off condition the condition is when machine on also indicate the light using lamp in (simulink/dashboard).
water
- washine machine is on then flow chart direction goes to water then condition is applied . im using y when y<1 - its indicate the no water in tank also lamp is ON
- the condition is true then goes to soaking state
soaking:
- soaking time is 200 sec and the output described as s=1
- after 200 sec next flow state is active that is washing machine state is active
washine time:
- washing time is 100 sec after 100 sec state goes to rinsing
rinsing time is 20 sec after dryer is activate and the dryer working on 50 sec then process completed state goes to end and lamp connected in end state that is indicates only the full process is complete.
All the outputs are monitered by scope and input data given to x and y represent the supply and water level respectively.
simulation output:
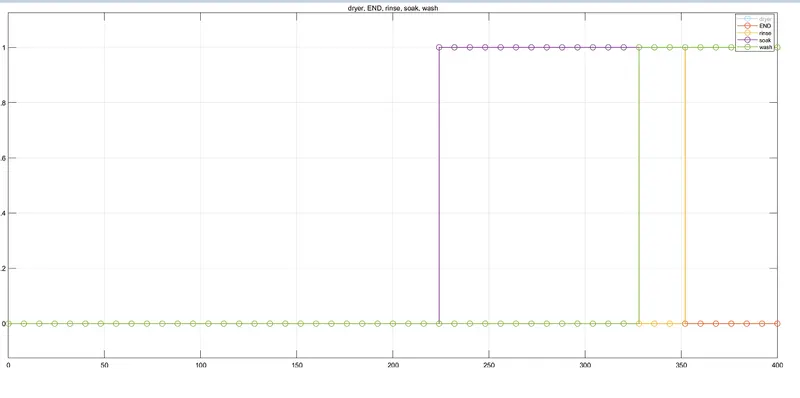
these is output of control logic of washine machine as the conditions.
result:
washing machine is ON when condtion is true and the lamp is activated and water is checked under condition otherwise machine indicate the light for tank have no water
soaking time 200sec ,washing time 100s,rinsing 20s,and dryer is 50s are all condition proved and also ploted.
Q2)Simulink chart for the “Gear shift” logic
conditions:
Speed Range(kmph) Gear
0 to 15 1
16 to 25 2
26 to 40 3
41 to 60 4
Above 61 5
Im using slider for varying speed and monitered by circular cauge
simulation model:
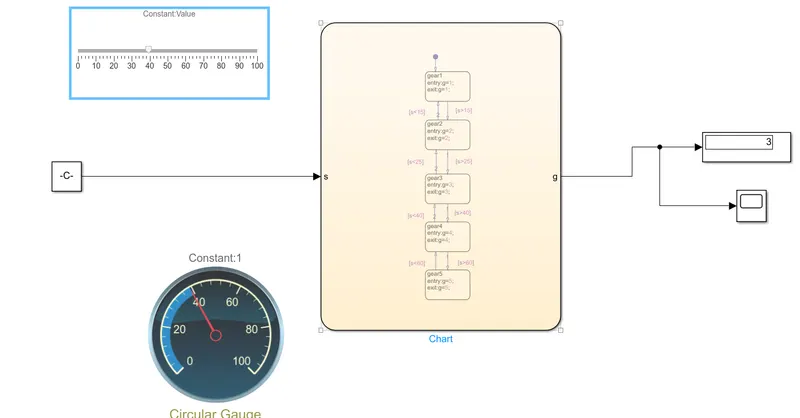
- run time has inf and the speed is varying during run time and display is diplayed a gear change
- scope used to find out the varying speed in run time.
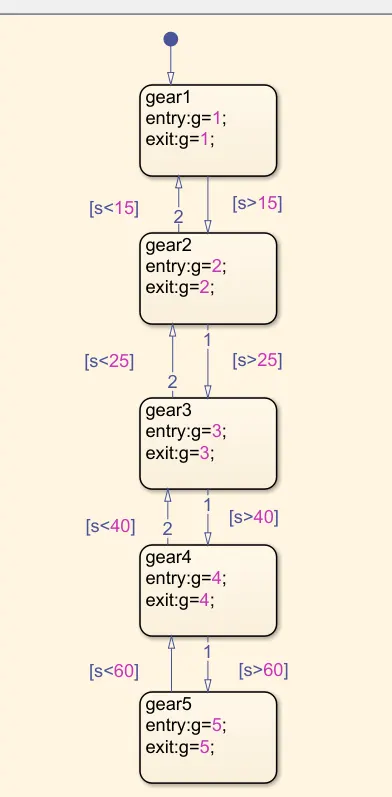
chart model:
report:
- using five gear named as 1,2,3,4,5
- output key word defined as exit:g=x . input defined as s>x
- gear change 1 to 2 for condition is speed>15
- gear 3 to 4 for condition is speed>40
- gear 4 to 5 for condition is speed>60
- reverse process applied for same condition in decreasing order
when speed input connected to port S and scope and display connected to output port G
simulation output:
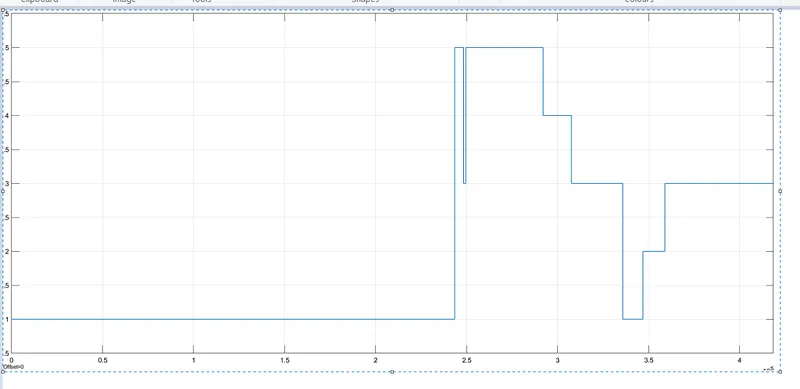
IM change the speed in near 2.5 sec the gear change to 5 and continuously speed changed and automatically gear changed in applied conditions.
result:
In gear control model all conditions are proved and also plotted.