Week - 4
SIMULINK WEEK 4 CHALLENGE
1. Aim
This project is divided into two parts:
- Implement the control logic of a “Washing machine” using Stateflow as per given sequence:
- If the power supply is available, the system gets activated.
- If the Water supply is not available, stop the process & indicate through LED.
- Soaking time should be 200s followed by Washing time of 100s.
- Then rinsing happens for next 20s & dryer runs for 50s.
After all the processes have been completed, indicate that the process is completed.
- Make a Simulink chart for the “Gear shift” logic as per below conditions:
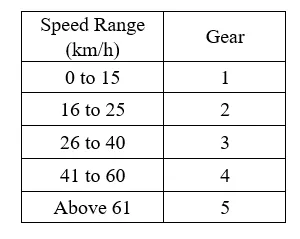
Give the input while the simulation is running and display the gear number.
2. Inputs
The necessary inputs, which in this case are the different states and conditions of both the system, are defined in the aim of the project.
3. Program
- Task 1
In this task a control logic for a washing machine needs to be created. It is modelled in Simulink and the logic is implemented using Stateflow. Like in a normal scenario, a washing machine requires a power supply and a water supply. When both are available, the machine can start the washing process. It is therefore clear that, for a washing machine model a power supply and water supply should be provided as input. This done by using a Constant block and two switches. By turning the switches on and off, the power and water can be controlled during the simulation. Figure 1 shows how the switches work in correspondence to the constant blocks. In such a way the two inputs to the model can be adjusted as per the user.
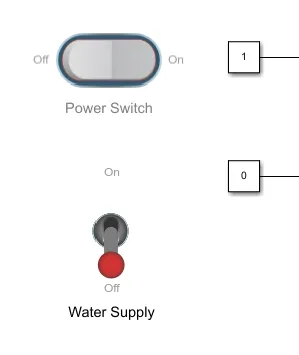
Figure 1 Power and Water supply switches and the constant blocks
Once the inputs are sorted, the next part involves defining the logic using which the machine operates. The control logic is implemented using the charts in Stateflow. Initially the system is in OFF state, defined by using a variable called ‘system’. Once the power supply and water supply are available, the system moves towards the ON state, where the variable system changes from 0 to 1 and if the necessary inputs are not available the system remains in the OFF state. Now if the system is ON, the various processes in the washing machine can begin. It starts with soaking, which lasts for 200 sec. A variable called ‘soak’ is created in the state to indicate that the machine is currently performing this process. After soaking, washing begins and lasts for 100 sec. Then rinsing for 20 sec and finally drying for 50 sec. Eventually the machine reaches the final state, which is ‘Finish’. For each of these processes corresponding variables called ‘wash’, ‘rinse’, ‘dry’, and ‘finish’ are defined to indicate the user, the process the machine is undergoing at that moment. All these variables move between values 0 and 1, where 1 represents the active process. So based on the time defined for each of these processes, the machine eventually moves through all of them and completes the washing process. Figure 2 gives a clear picture of the above defined logic.
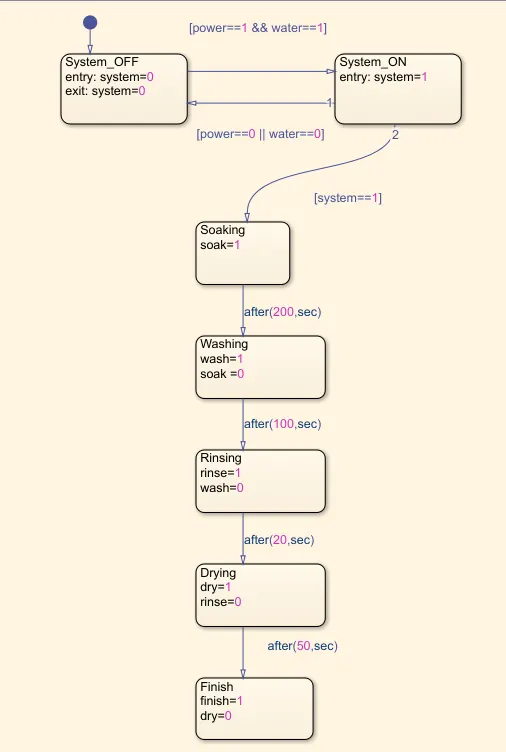
Figure 2 Control logic for Washing machine model
Once the logic is defined, the next part of the task is to provide indications for each of the processes and inputs involved. This is done by using ‘Lamp’ blocks in Simulink. When the logic is defined all the variables involved in it that represents the output, can be defined as output data using the ‘Symbols Pane’ in Stateflow. Once the outputs are defined, the variables will be visible on the right side of the Chart block (see Figure 3). Now to indicate the user, the output signals are connected to the lamps, in which 1 represents the active process and the lamp turns on. The colour the lamp shows can be defined by the user. By altering the simulation time, the various processes through which the machine goes, becomes visible to the user.
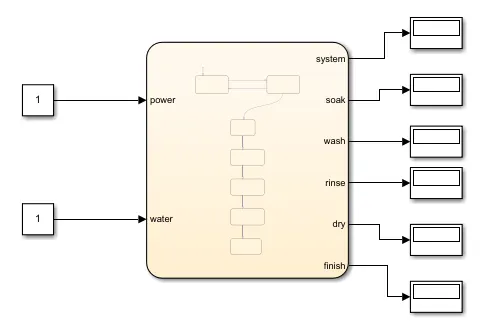
Figure 3 Inputs and Outputs of the defined control logic
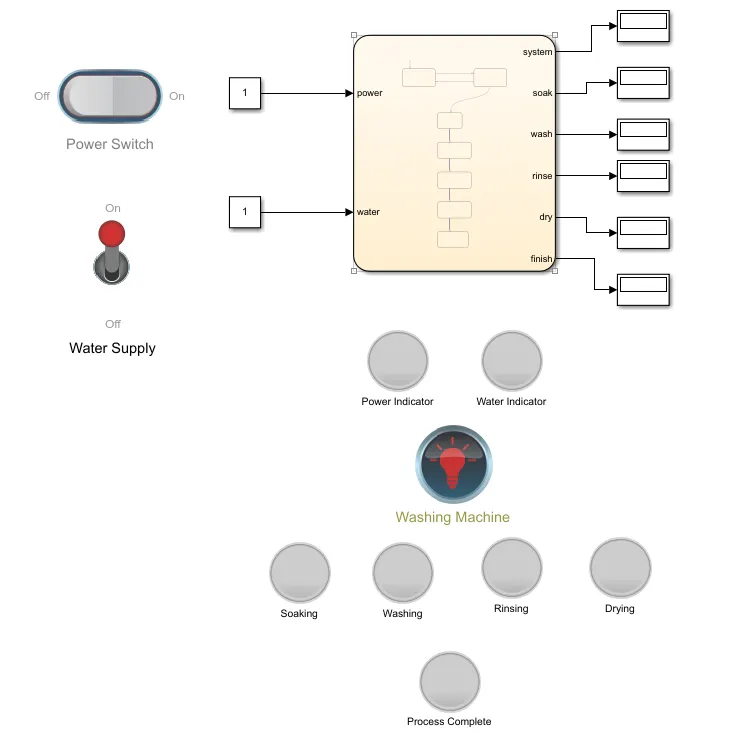
Figure 4 Washing machine model
The above figure shows the complete model of the machine with lamps acting as indicators for the various stages of the process.
- Task 2
Here a gear shift logic based on the given conditions needs to be implemented. As the speed changes correspondingly, the gears need to be changed as well. So, for this purpose a ‘horizontal slider’ block is used, so that the user can vary the speed accordingly. The horizontal slider block is connected to a constant block, it is this block that provides the value from the slider block to the chart block, wherein the logic is defined. A display is connected to the constant block to observe the set speed.
Initially the vehicle is in neutral gear, which is represented by using a variable called ‘g’ and g becomes 0. When the speed is greater than 1 it moves into the next state, which is the first gear. Here g becomes 1 and if the speed is less than or equal to 1, the vehicle moves back into the neutral gear state. Similarly based on the speed, the vehicle moves through each of the gears. If the speed is greater than 15, it changes to second gear and g becomes 2. If the speed is greater than 25, the vehicle moves to third gear and g becomes 3. Similarly, it moves till the fifth and final gear. Whenever the speed is greater than a particular value, the vehicle moves to the next gear and whenever it is less than the set value, it moves back into the previous gear. At each gear the value of the variable g changes accordingly. Figure 5 shows the complete logic for the model. The variable g is also defined as the output of the chart block in Symbol pane; therefore, it will be visible on the right side of the block.
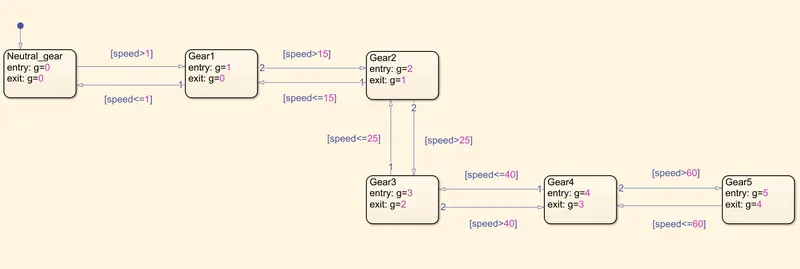
Figure 5 Gear shift logic
On the output side, a display block is connected to the variable g, to indicate the gear number. The signal to the display block is also connected to a lamp, to give a visual indication of the current gear.
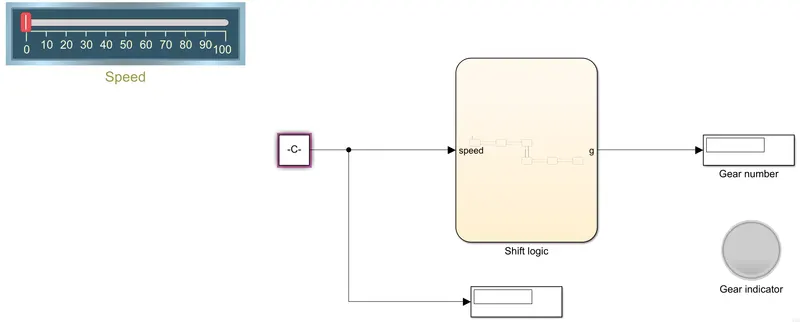
Figure 6 Gear shift model
The gear indicator lamp is colour coded. Each gear is given a certain colour for the visual indication. Figure 7 shows the colour coding of the gears.
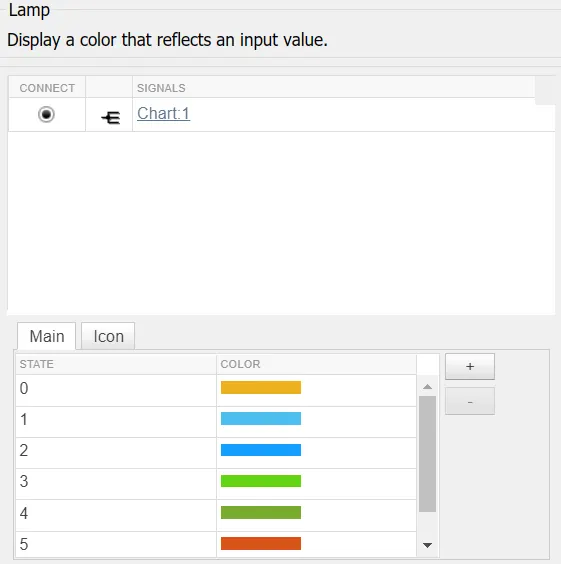
Figure 7 Colour coding for the gears
4. Results
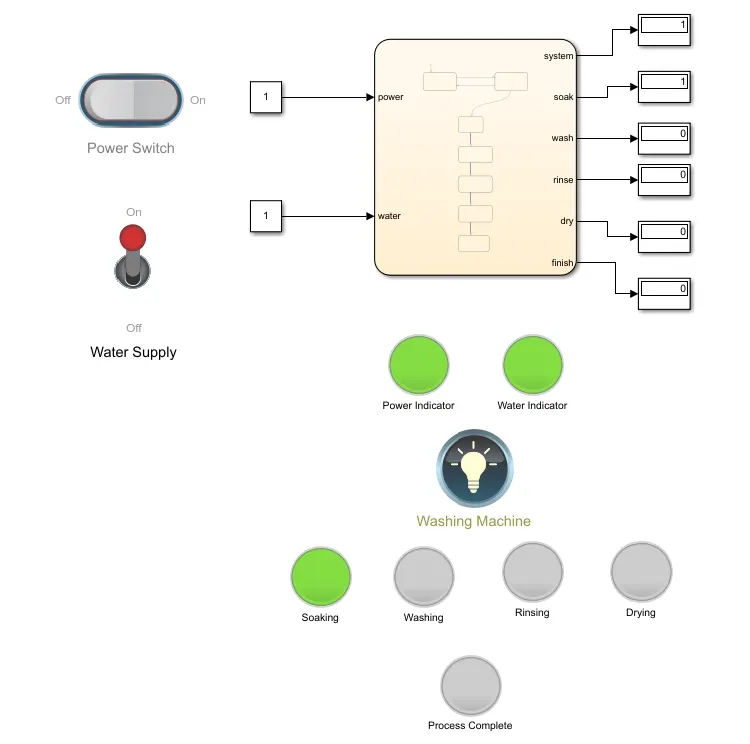
Figure 8 Soaking state, Simulation time=150 sec
For the washing machine model, by adjusting the simulation time, the change in states can be visualized. Figure 8 shows the machine in soaking state. This is because the simulation time is set as 150 sec. The machine remains in the soaking state for 200 sec, so if the simulation time is increased other states could be visualized as well. The power supply and water supply are available, as the corresponding indicators have turned green, which here represents that the supply is available. Since the necessary inputs are available, the indicator for washing machine have also turned on.
When any one of the inputs are not available, the model won’t function, or the washing machine remains in the off state. Figure 9 shows the situation in which the water supply is turned off. In this situation the washing machine can’t function as one of its primary inputs is not available. The corresponding lamps for each of these signals then turn red when the input is not present.
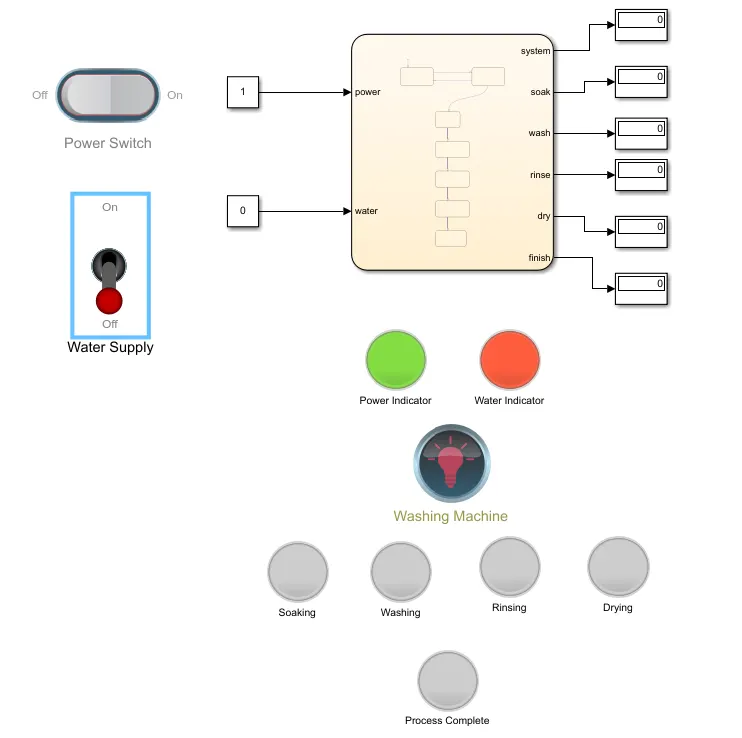
Figure 9 Water supply off
When the simulation time is set as 400 sec or any time greater than 370 sec means that the cycle is completed, provided the inputs are present. Figure 10 shows the completed state, or one complete cycle of the washing machine.
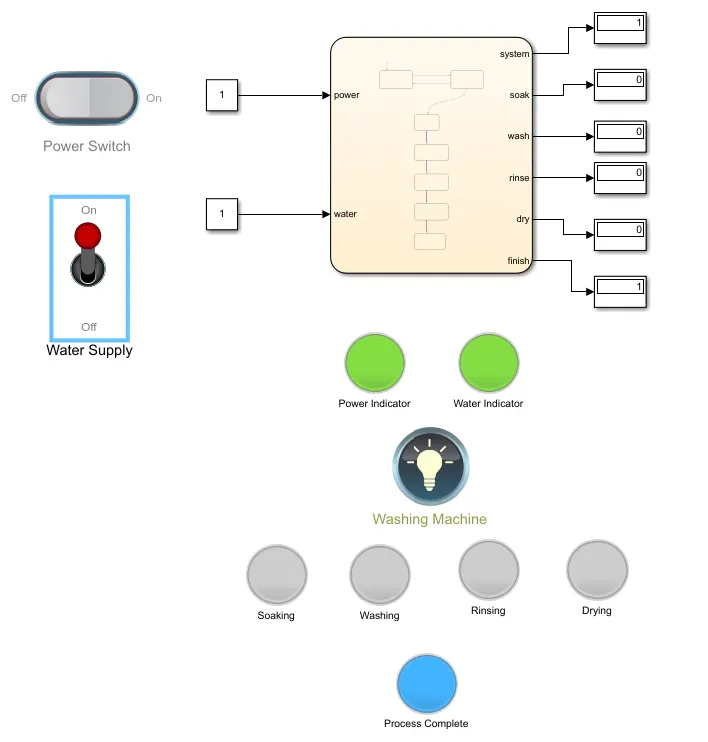
Figure 10 Washing machine process completed
In the gear shift model, the change in gears can be visualized by changing the speed using the slider. To visualize the change in real time, the simulation time can be set as infinite, so that the user can change the speed during the simulation.
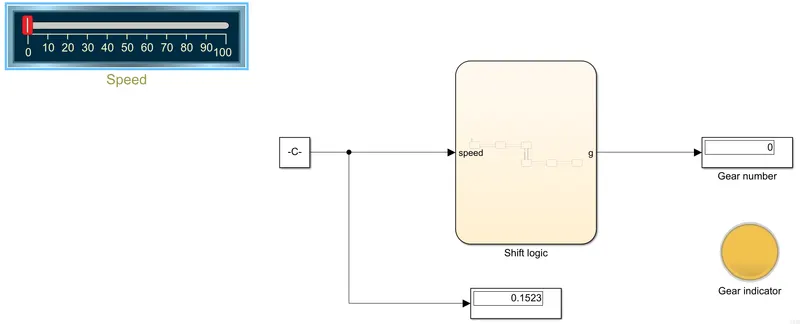
Figure 11 Neutral gear
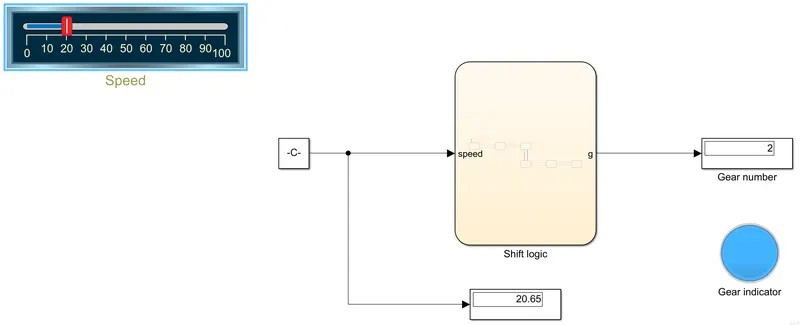
Figure 12 Gear 2
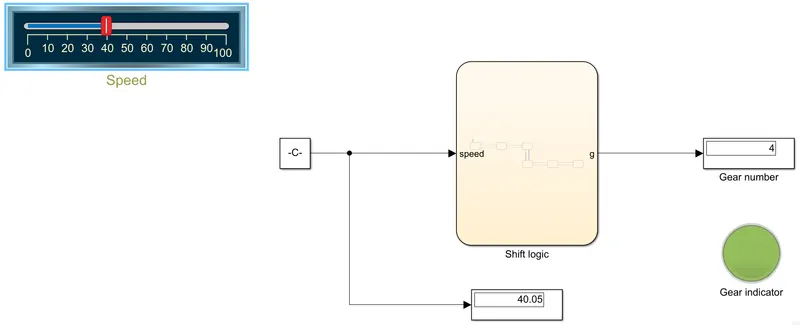
Figure 13 Gear 4
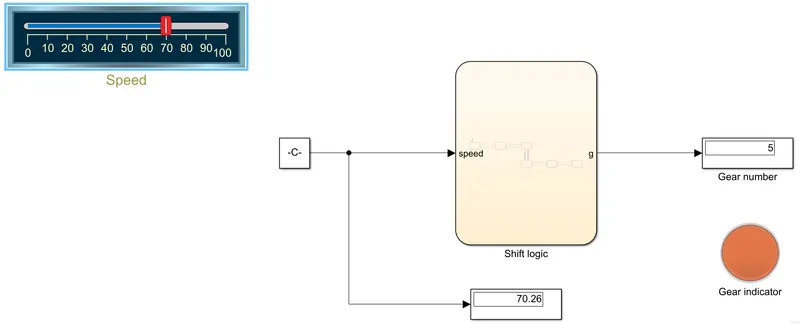
Figure 14 Gear 5
Figures 11, 12, 13 and 14 shows the various gears corresponding to the change in speed. The indicators blink the assigned colour (see Figure 7) for each gear and the gear number, and the speed are shown in the associated display blocks.
5. Inference
The focus of this project was to develop an understanding of Stateflow in Simulink – how to create a control logic for a particular system, what are the necessary blocks, how can various elements in a model be visualized, and how to define the inputs and outputs for a system. The models used in this project are therefore not so complex. But to develop an understanding of a particular concept such simple models are very much useful.
The understanding of Simulink blocks was further deepened through this project. Along with that a new concept of defining the control logic for a system was also attained through the course of this project.
Original Report: https://drive.google.com/file/d/1UXlcvX1r5hKmpX4yBJxu6q8_L2orc79K/view?usp=sharing