Week - 4
Question-1
AIM: To implement the control logic of the Washing machine using Stateflow.
OBJECTIVE:
1. To implement control logic of a washing machine using Stateflow as per given sequence:
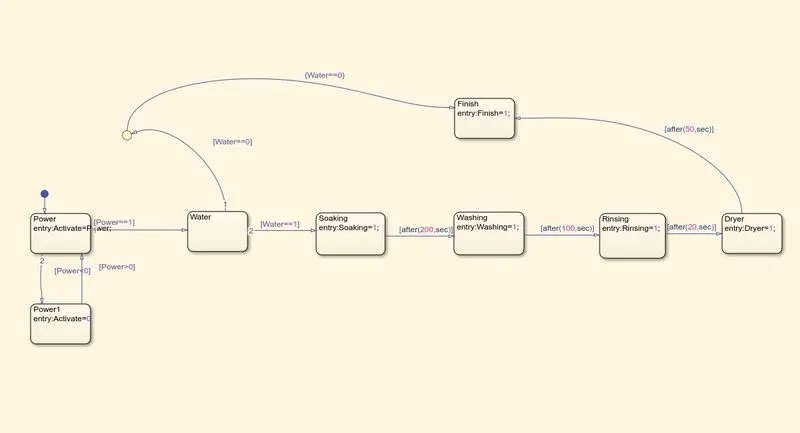
- If the power supply is available, the system gets activated
- If the water supply is not available, stop the process and indicate through LED
- Soaking time should be 200s followed by Washing time of 100s
- Then rinsing happens for next 20s and dryer runs for 50s
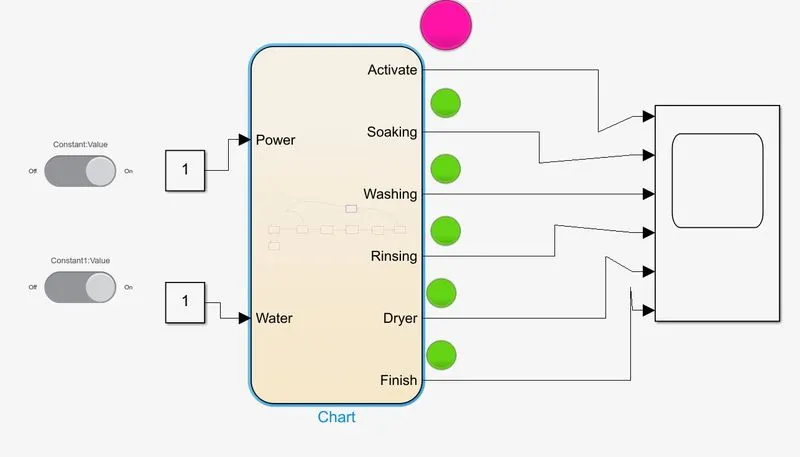
- After all the processes have completed turn on
the finished LED
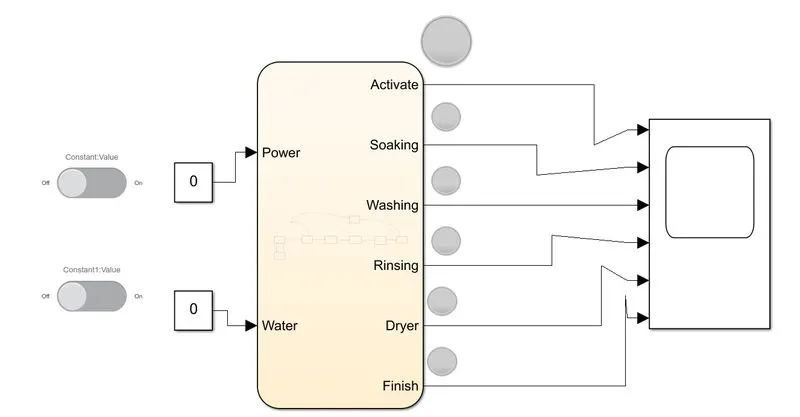
Ideal Stateflow model of Washing Machine-
Stateflow Chart-
CONDITION-1 & 2 Respectively-
If the power supply is available, the system gets activated
If the water supply is not available, stop the process and indicate through LED
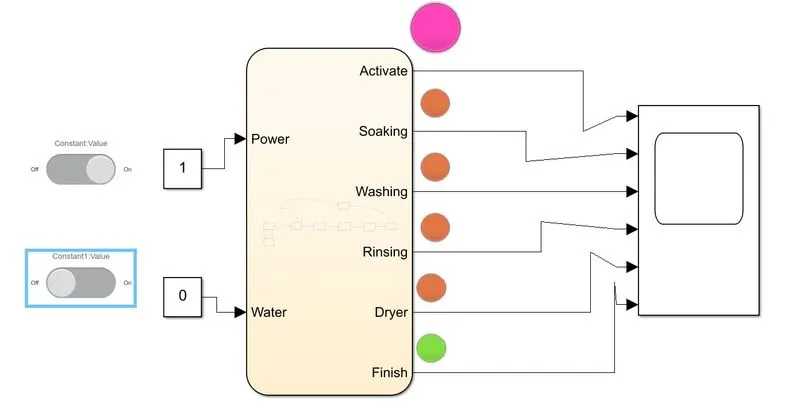
Explanation of Condition 1 &2-
As you see in the image when Power supply is on the system gets activated(Indicated via Pink Lamp)as well as the water supply is not available the system indicates the stop process through LED (programed the stateflow chart accordingly).
CONDITION-3
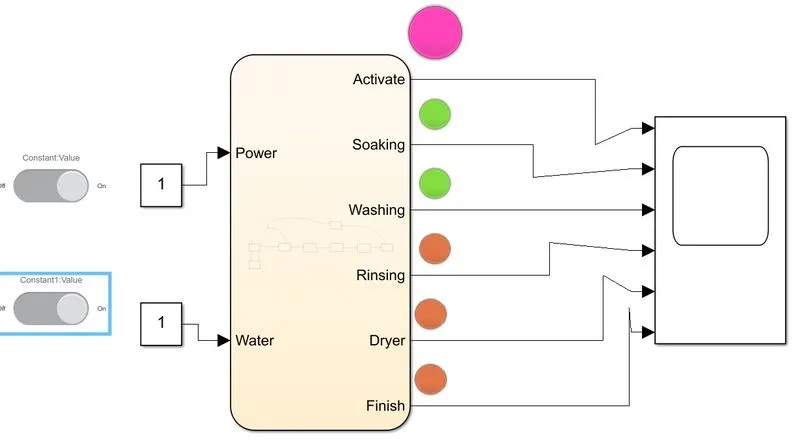
Soaking time should be 200s followed by Washing time of 100s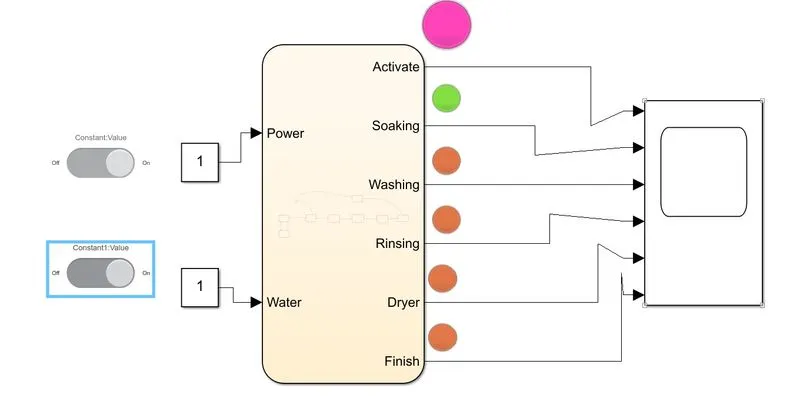
Washing-100S
CONDITION-4
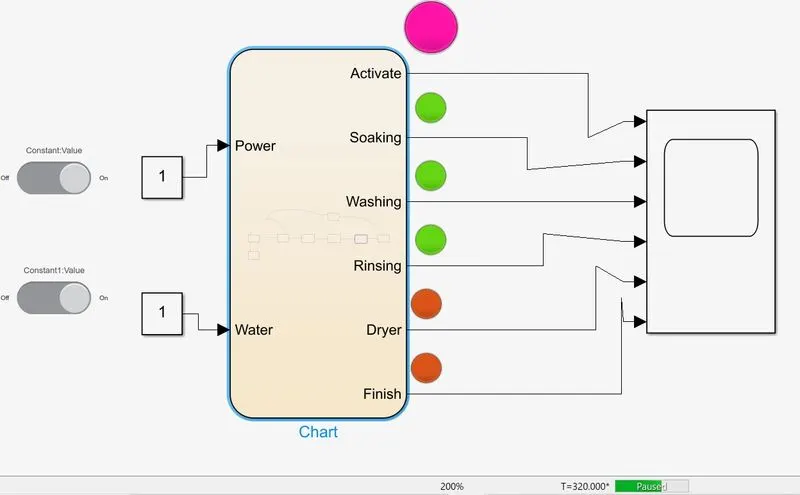
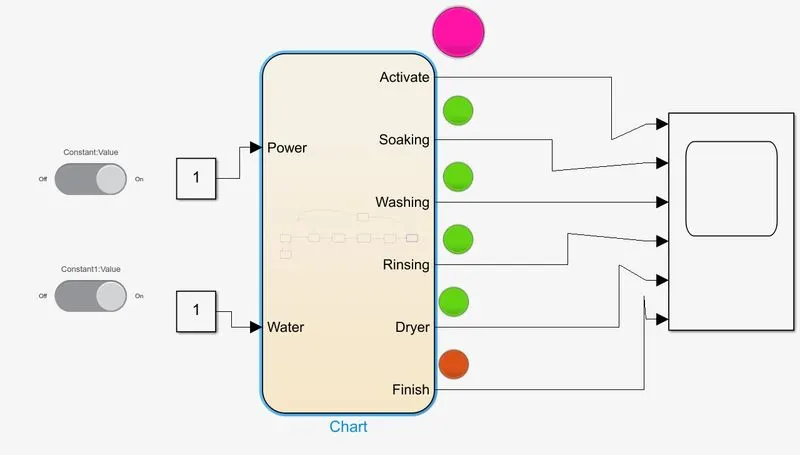
Then rinsing happens for next 20s and dryer runs for 50s
Rinsing for 20S
Dryeing 50S
After all the process Completed Trun on the Finished LED-
Output
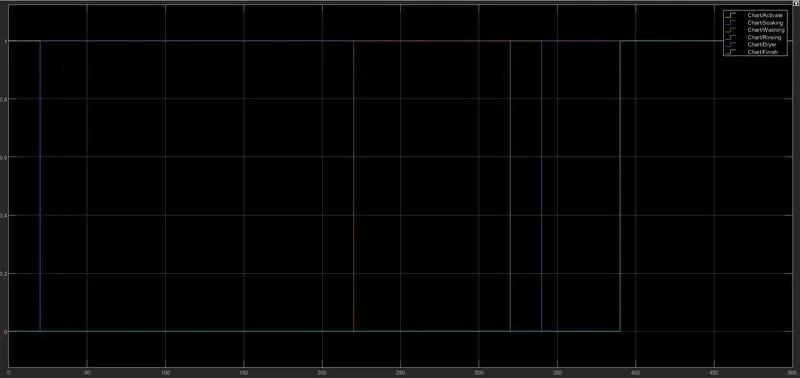
As our input parameters are correct and also the conditon given are perfectly working according to the input given we are getting the output what we had implemented the control logic of washing machine.
Here in the first the system gets activated from 0-20S, Second-we are observing the soak process the soak process start form 20 seconds to 220 seconds the soaking process starts, Third- the wash process starts form 220 seconds to 320 seconds and depicts, Fourth-the rinse process form 320 to 340 seconds and the observes, Fifth-the dry process for 50 seconds means 340 to 390 seconds the process finishes according to the control logic and the last signal represents that the power supply is same for all the process form (0) to (1).
Question-2
AIM: To make a Simulink chart for the "Gear shift" logic as per below conditions:
Speed Range(km/hr) Gear
O to 15 1
16 to 25 2
26 to 40 3
41 to 60 4
Above 61 5
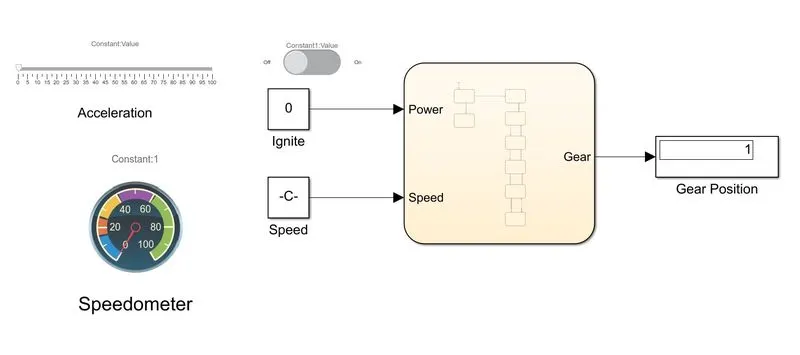
Ideal Model of Gear Shift Mechanism
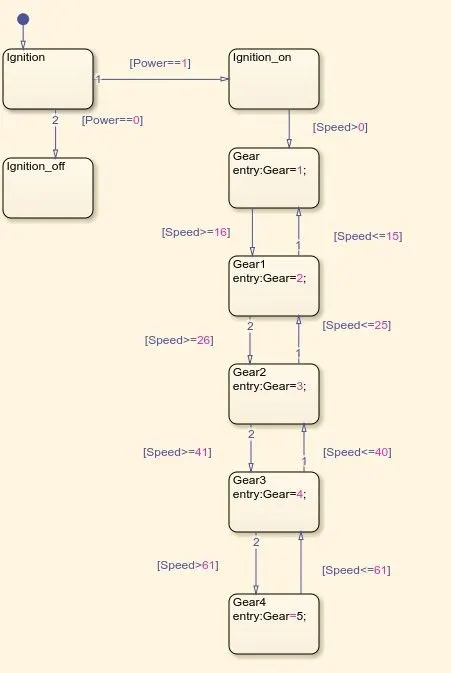
Stateflow Chart
CONDITION-1
Speed Range(km/hr) Gear
O to 15 1
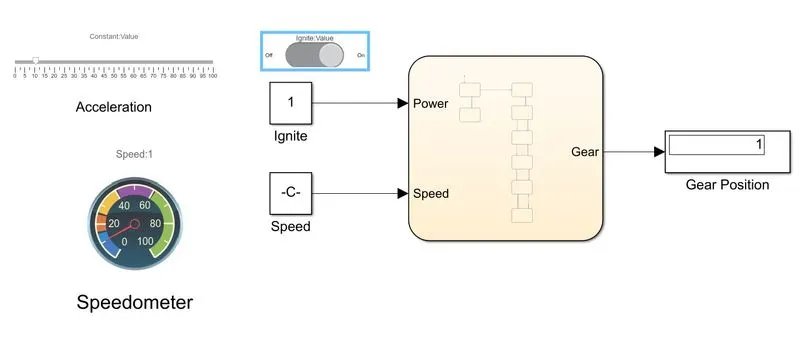
CONDITION-2
Speed Range(km/hr) Gear
16 to 25 2
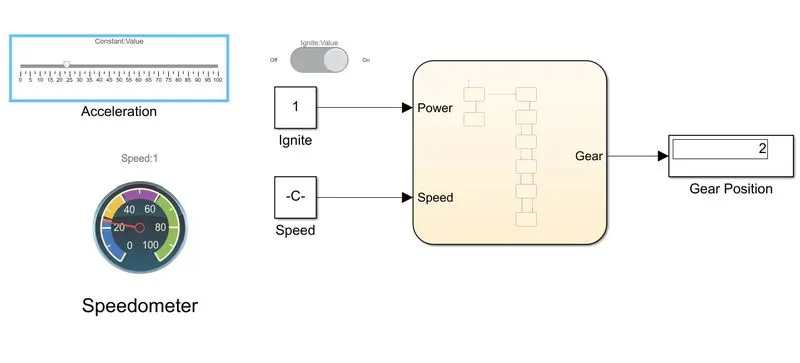
CONDITION-3
Speed Range(km/hr) Gear
26 to 40 3
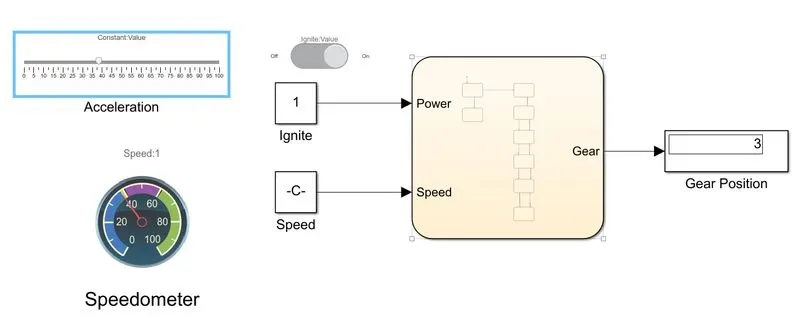
CONDITION-4
Speed Range(km/hr) Gear
41 to 60 4
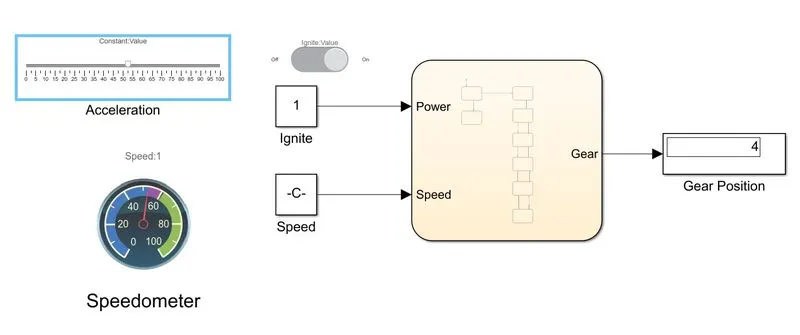
CONDITION-5
Speed Range(km/hr) Gear
Avobe 60 5
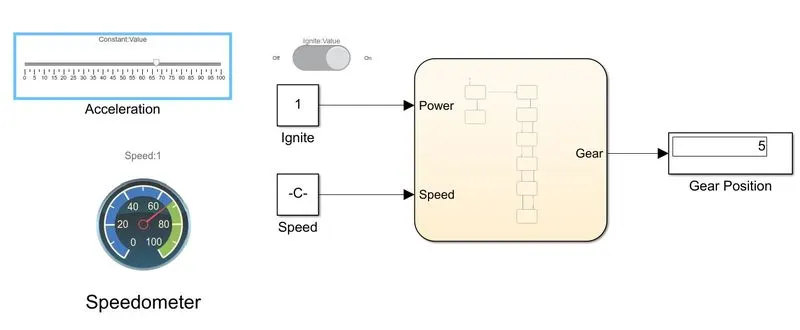
Result: Simulation of gear shift corresponding to the given speed range have been simulated successfully.