Week - 4
Q1] Implement control logic of a “washing machine” using Stateflow as per given sequence:
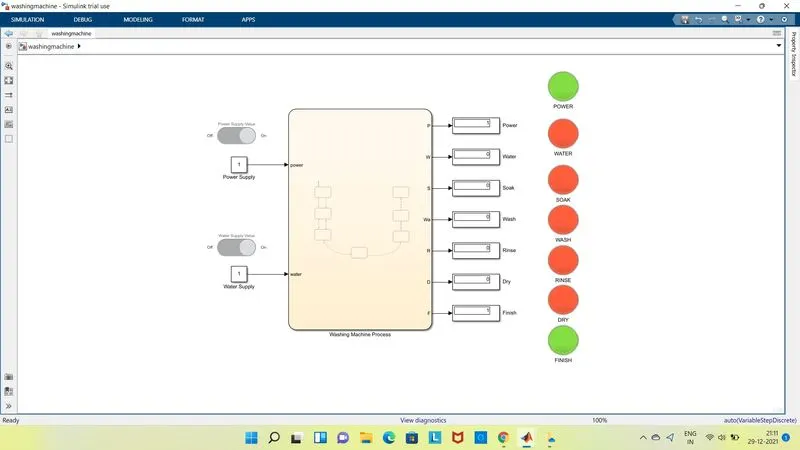
The Simulink Model for above question is below:
Stateflow Model
Explanation:-
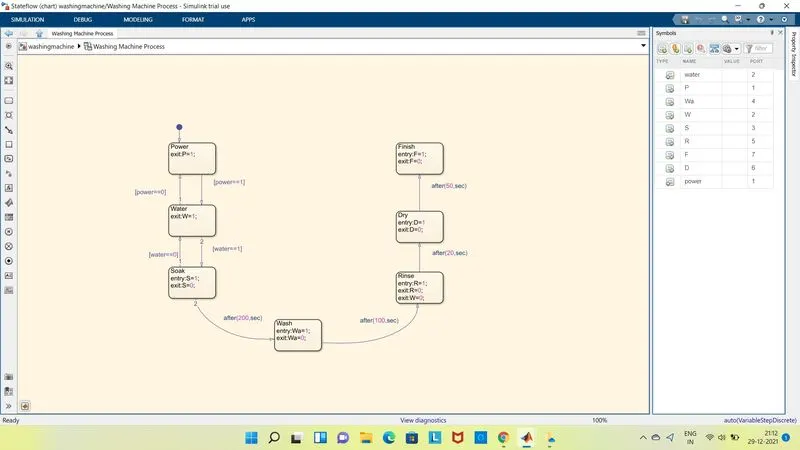
As per given condition the stateflow diagram is drawn. The working of each state is explained below.
Two inputs are given i.e of power and water . Once the power is turned on the 1st condition is turned true the block moves future in water state where the water in is user defined which is given 1 when 1 is feeded ist moves to next stage of soaking but when the water state is 0 then the soaking while not happen the soaking process is done for 200 sec as written in condition post 200 sec the block exit =0 . The washing block is on as entry gets 1 in input the washing phase is defined for 100 secs and exit=0. The rinse is took place, rinsing phase is defined for 20 sec rinsing is done untill the water block is 0 i.e the water is needed is to be fully drained and then rinsing is carried out for 20 sec. In drying phase the clothes are dried for 50 secs. After drying is completed the finish block is turned high.
The above indivisual phase output are taken out a display block is attached to see the output.
The display is attached with indication lamp the lamp is configured is as below.
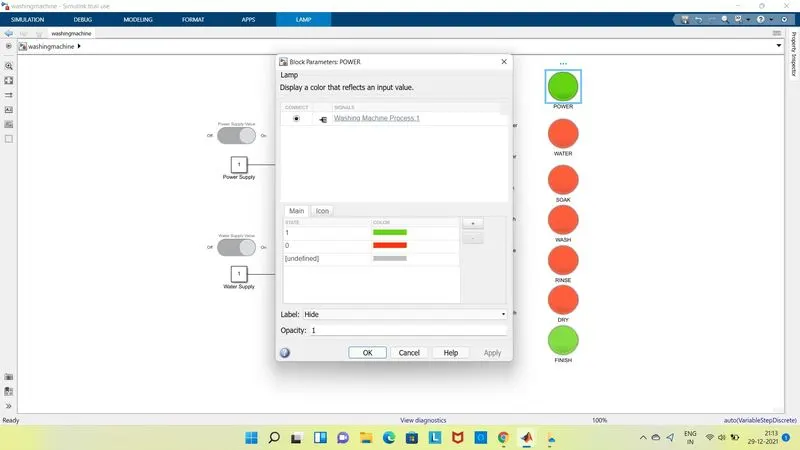
After running the simulation the power lamp is green and the other lamps gets green during their phase when the drying is completed the finish block is 1 . therefore the above results shows the washing process is completed sucessfully.
Q2] Make a Simulink chart for the “Gear shift” logic as per below conditions:
For the given condition the simulink model is drawn, which is attached below.
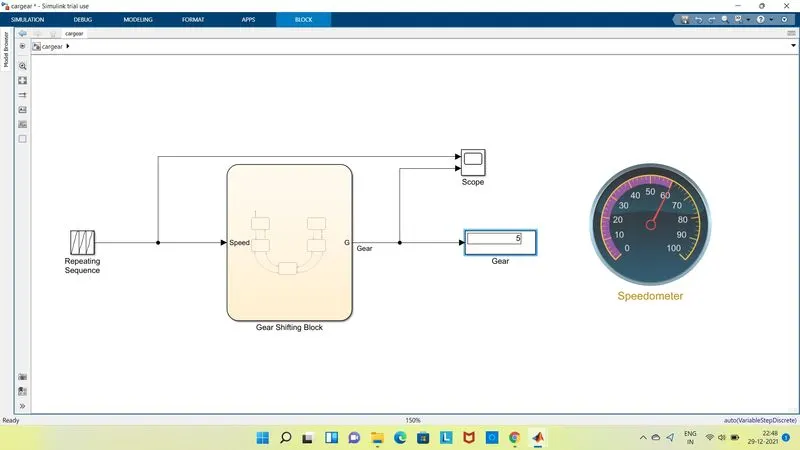
Stateflow block:-
The stateflow chart with all given condition is drawn in chart block.
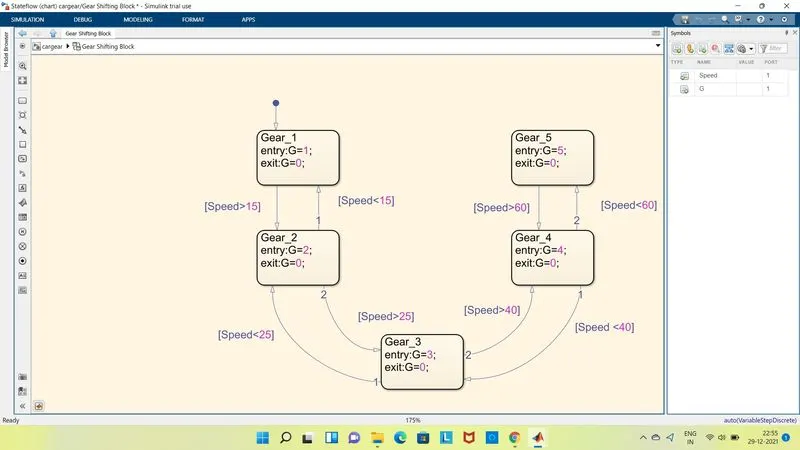
Explanation:
The gear shifting logic for various given speed is drawn in simulink by using chart block.As the gear shifts from 1 to 5 the speed goes on increasing.To observe the output a display,scope & circular guage is used. The display while show the gear which is car is running and the meter will show the coresponding speed.The scope is taken to monitor the input data feeed and same is taken out.
For various speed input repeating sequence block is used in which data is feeded where time and speed is feeded which we can see in below attached block.
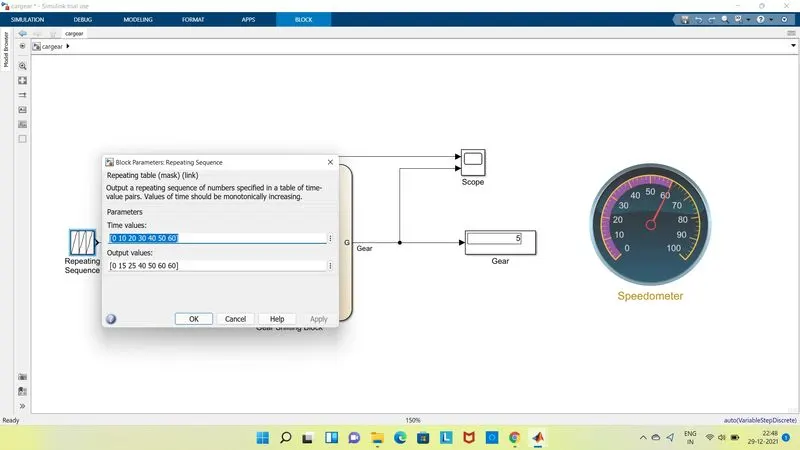
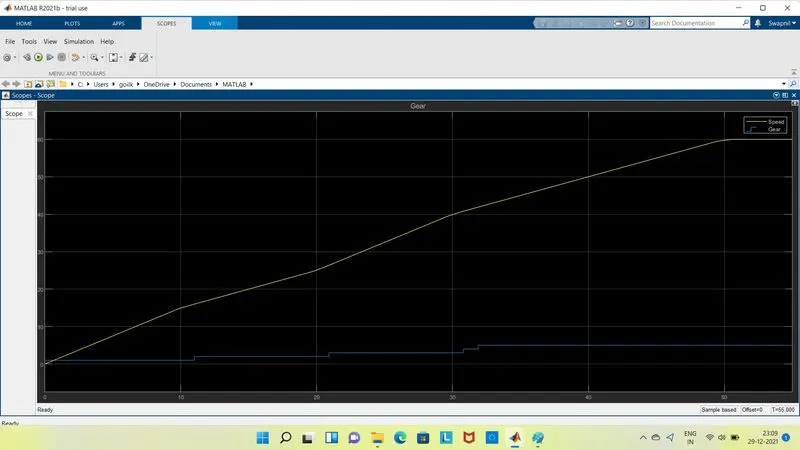
After running the simulation the results are obtain the 1st image shows that the gauge shows speed above 60 rpm for which coressponding gear should be 5 hence the same is displayed in output .therefore the simulation is excuted suceesful.The graph shows the detail variation of speed vs gear.