Project
Aim:- To perform system level simulation of model:baja all terrain vehicle that uses cvt, analyse and interpret the result.
Objective:- To carry understand the lookup tables and dashboard blocks that increases the performance to simulink model.
To understand the close & open loop atv model.
Model Explanation:
CVT model:-
A continuously variable transmission (CVT) is an automatic transmission that can change seamlessly through a continuous range of gear ratio. This contrasts with other transmissions that provide a limited number of gear ratios in fixed steps. The flexibility of a CVT with suitable control may allow the engine to operate at a constant rpm while the vehicle moves at varying speeds.
Four types are Baja Atv model we are going to see that are
- open loop
- open loop with dasboard
- closed loop
- closed loop with dashboard
Frist let see all models/subsystem used in the terrain vechicle which are as follows:-
A] CVT Model:-
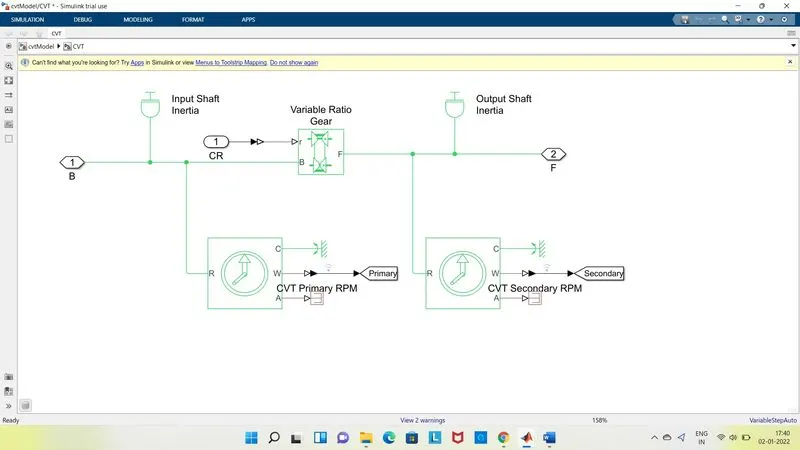
A variable gear ratio block is used where the input will decide the actual gear ratio. To make the block more reality input and output shaft inertia is added to get more practical oriented results.Two CVT primary & secondary rpm counter block is used to see the rpm on both sides of shaft and to analysis the variation ocurring.
B] Vehicle Body:-
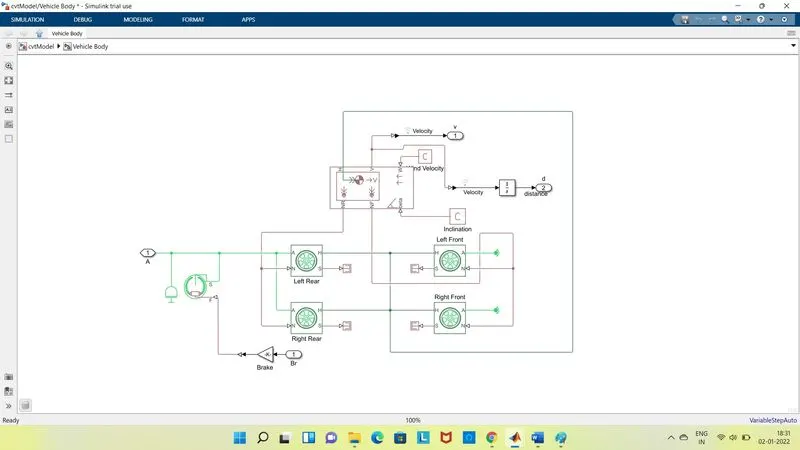
The vehicle body is connected with 4 wheel and the secondary cvt rpm and brakes inputs are given to the subsystem accordinly.The vehicle is define with 250kg mass.Wind velocity and inclination blocks are added to vehicle body.The velocity is taken to the scope by outport block.
C] Speed Torque Curve:-
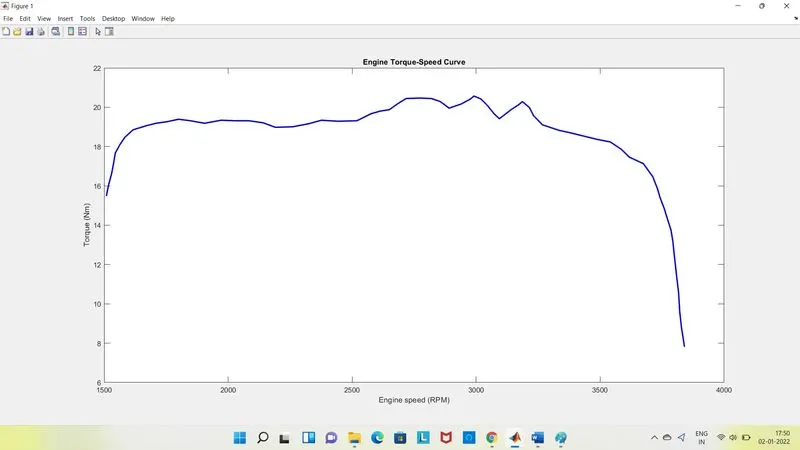
To connect the cvt and the engine, a simple gear with gear ratio 4 is used.This transfer the speed and torque in favourable manner from engine to primary shaft of cvt.
The area properties block is used in engine.It is given speed vector and torque vector by extracting the points from speed torque charateristics shown above.
Lookup Table [model 3 & 4]
A lookup table is an array of data that maps input values to output values, thereby approximating a mathematical function. Given a set of input values, a lookup operation retrieves the corresponding output values from the table.A lookup table block uses an array of data to map input values to output values, approximating a mathematical function. Given input values, Simulink performs a “lookup” operation to retrieve the corresponding output values from the table. If the lookup table does not define the input values, the block estimates the output values based on nearby table values.
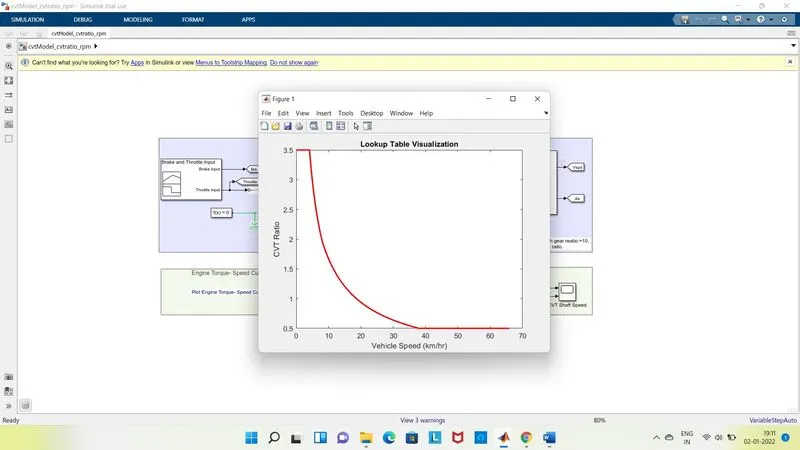
The lookup table is used in the model gives the CVT ratio as the output for respective input vehicle speed.The vehicle speed is fedback to the CVT subsystem where the CVT ratio is calculated using the lookup table block.The resluts are attached below.
Dashboard Element [model 2 & 4]
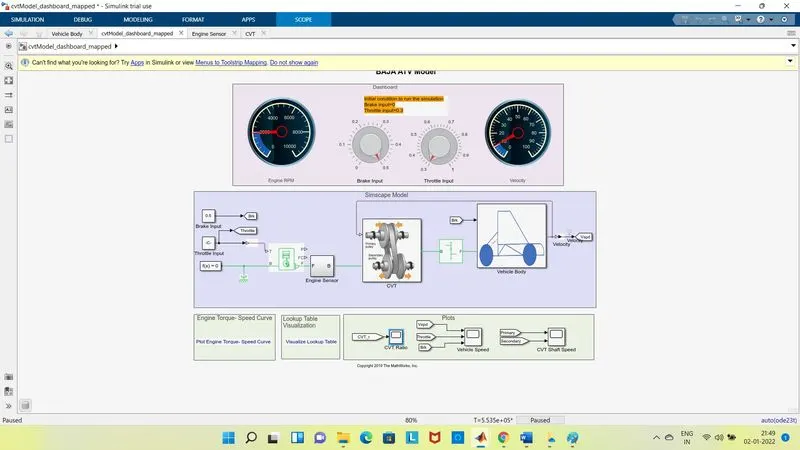
Dashboard allows us the give input and observe the output simulatenously.With help of two knobs the brake and throttle values and at same time two guages shows velocity and speed in rm is observed.
1] Baja ATV open loop model:
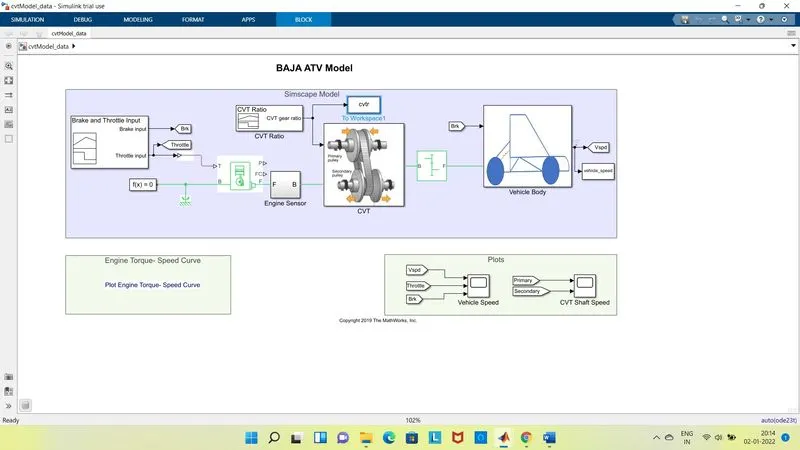
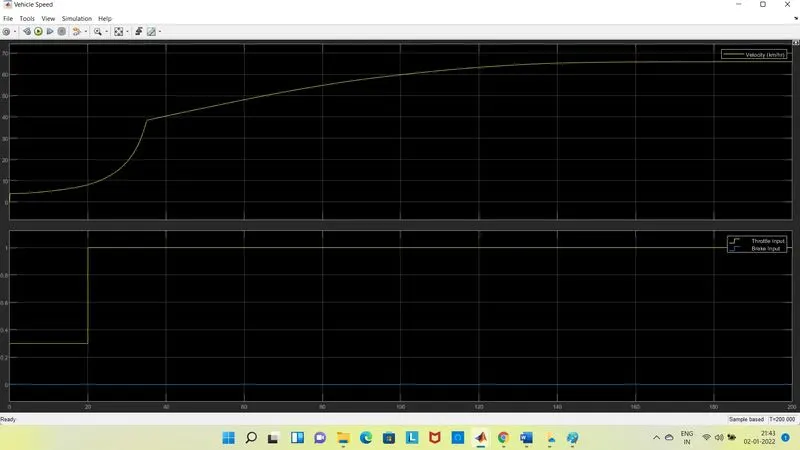
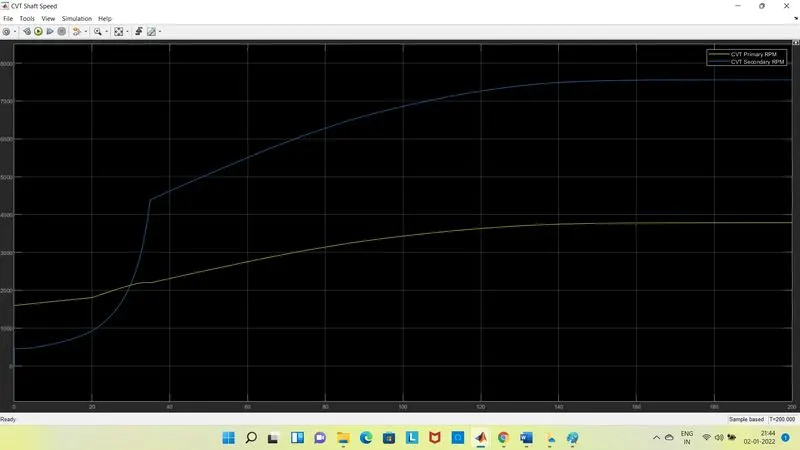
In the above model the brakes are applied 0 same throughout and the throttle is 0.3 till 20 sec and futher 1 constantly.The CVT ratio gives 3.5 ratio at 0 sec then futher gradiuly is decresed and at 35 th sec it gets constant at 0.5 sec. after running the simulation for above inputs we got below resluts.
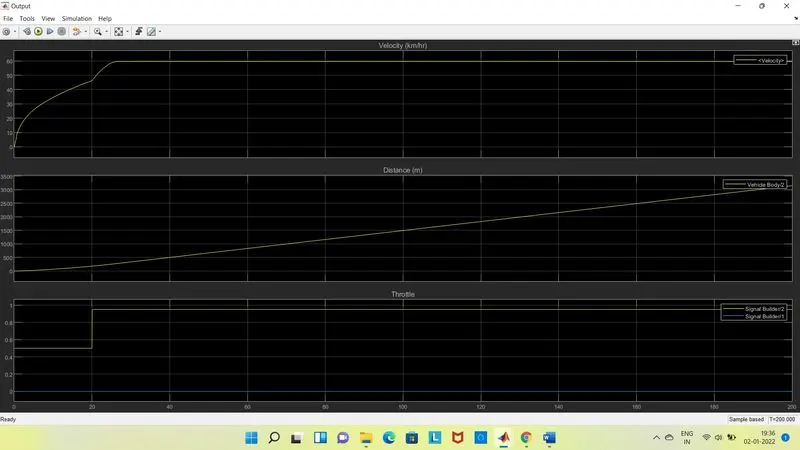
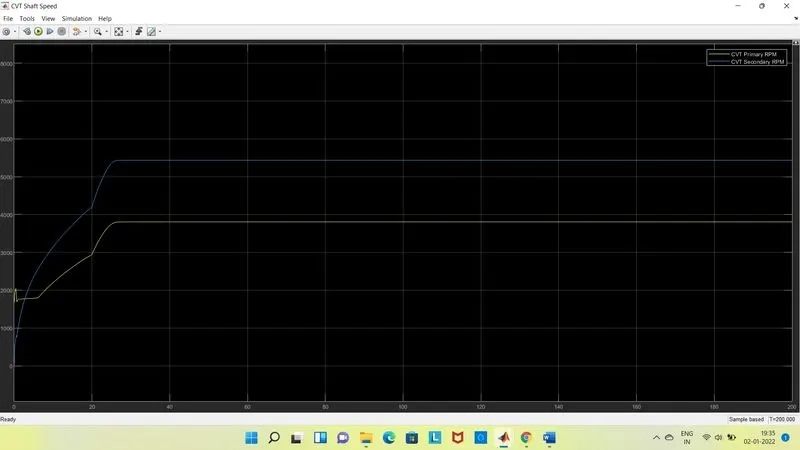
From above results we can say that at 1st instant when the throttle is 0.3 for 0 to 20 sec and brakes are constant the velocity starts increaising gradiuely from 20 to 35 sec once the throttle is constant the velocity also becomes stable after a movement of time, the speed does not increase beyond the limit.
2] Baja ATV dashboard open loop model:
In dashboard model the throttle & brake is changed by using knobs.
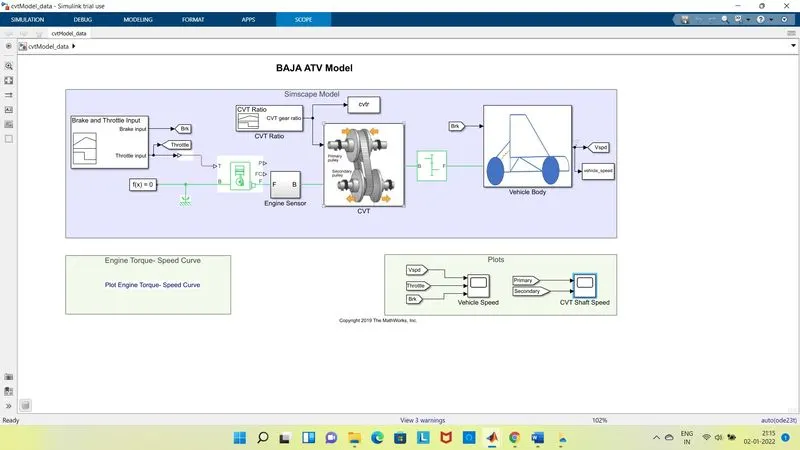
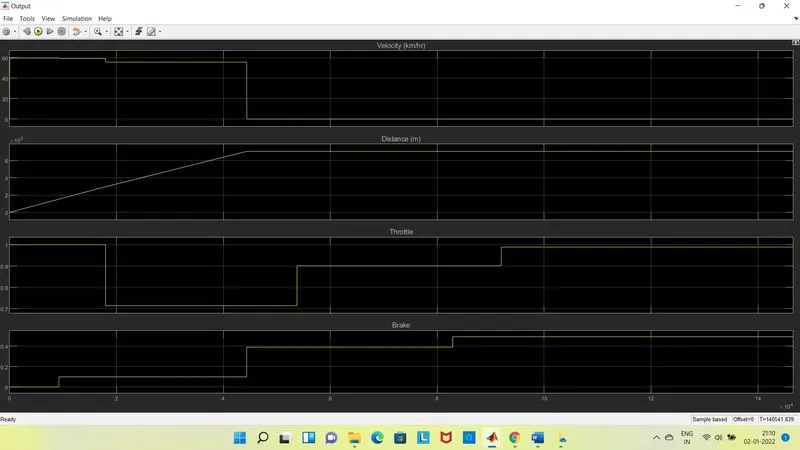
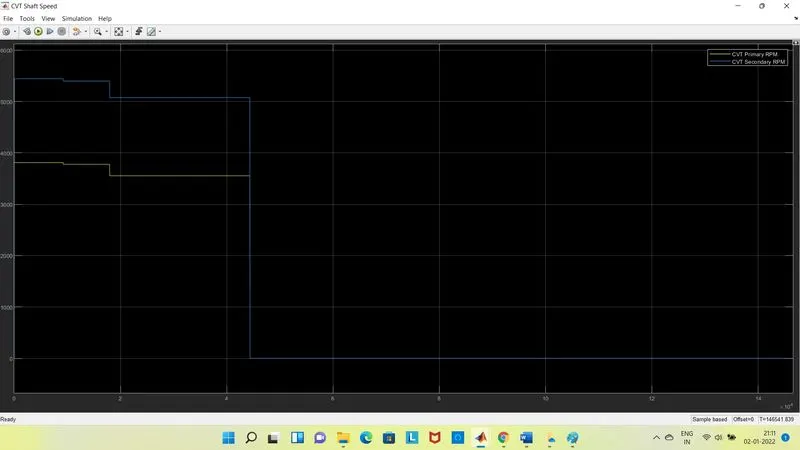
Increasing the throttle increses the speed and increases the brake decreases speed vice-versa.
3] Baja ATV Closed loop model:
This model uses lookup table inside CVT system which decide the gear ratio according to the velocity fed back to the system.
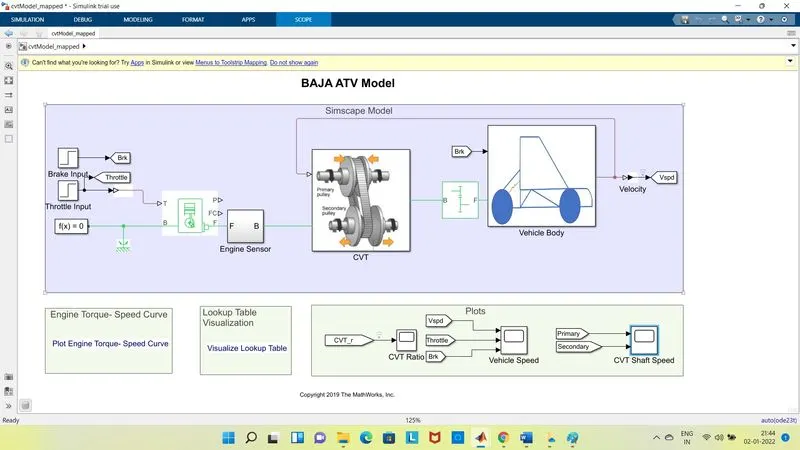
The above is closed loop of atv baja model and below are output in graph which are similar to open looop.
D] AVT closed loop model with dashboard:-
The closed loop with dashboard model is attached below.
Outputs:-
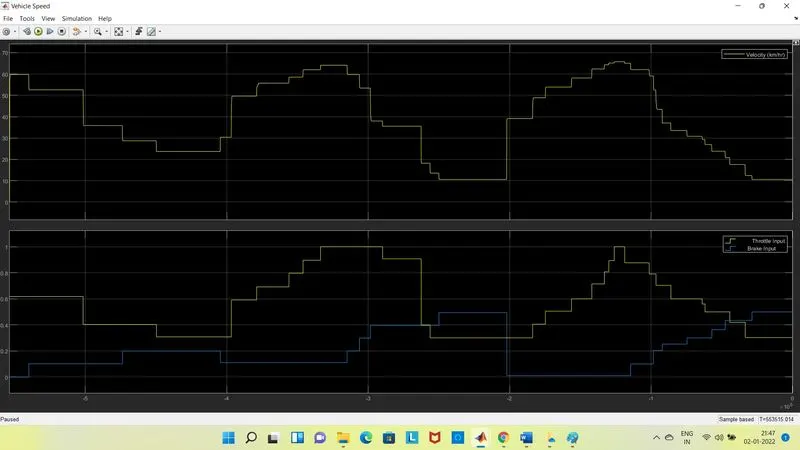
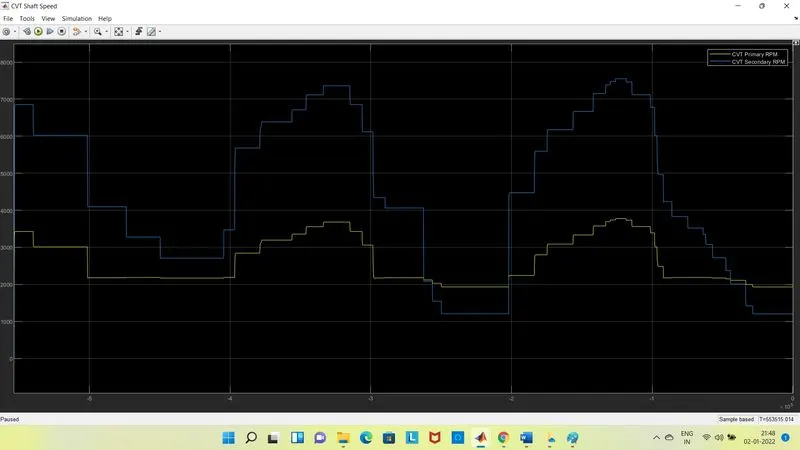
Same procedure for open loop is used and below results are obtain.
Conclusion:-
All the 4 type of model are simulated and output graphs are attached we observe the variation in speed and velocity as the input brake and throttle are varied.
The dashboard elements gives ous varies output w.r.t to changing input in on going simulation and getting output simulatenoulsy.
As the throttle increases more ppower is given by engine and the speed rpm increases same could be reduced by applying brakes.