Week - 4
- Implement control logic of a “washing machine” using Stateflow as per given sequence:
- If the power supply is available, the system gets activated
- If the Water supply is not available, stop the process & indicate through LED
- Soaking time should be 200s followed by Washing time of 100s.
- Then rinsing happens for next 20s & dryer runs for 50s
After all the processes have completed turn on the finished LED
ANS:
- WASHING MACHINE THEORY:
1)A washing machine is laundry machine and is also called cloths washer.
2)is used for home appliences to wqash laundry.
3)the washing machine can be performed many process which can be seen step by step as follows:
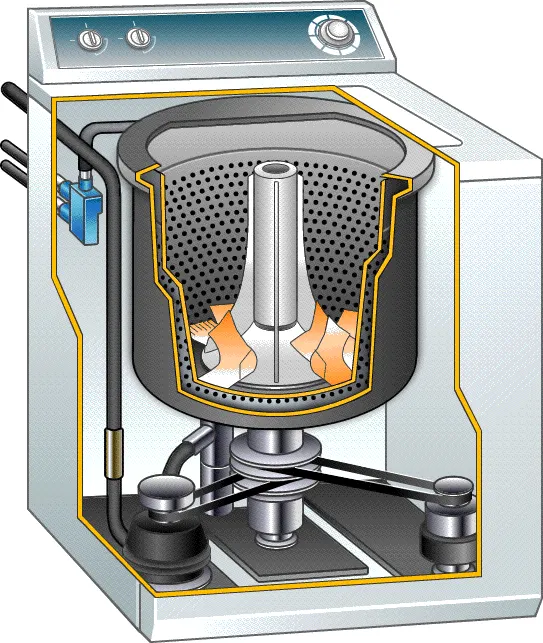
- Working process:
1) Firstly to run thw washing machine the main requirement is power supply and water supply.
2) when washing machine in OFF state we add cloths inside the machine as per cloths weight machine law medium high.
3) when we start the power supply then machine is run and feeling water to inside.
4) then we add the detergent in solid and liquid form in that water therefore washing mahcine get started.
when washing is run the washing machine motor run in forward and reversed direction and cloths are around get washed.
6) then rincing activity is started ,rinsing means water get out and it may be value draining of water the cloth get dried out.
7) After rinsing process spining is occures in this spinning process the cloths are drying out. this process required same kind of heating.
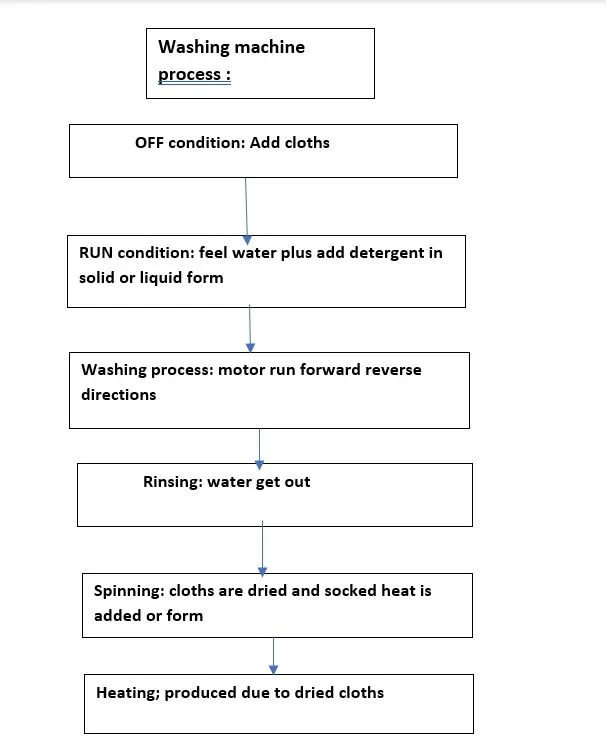
- FLOW CAHRT:
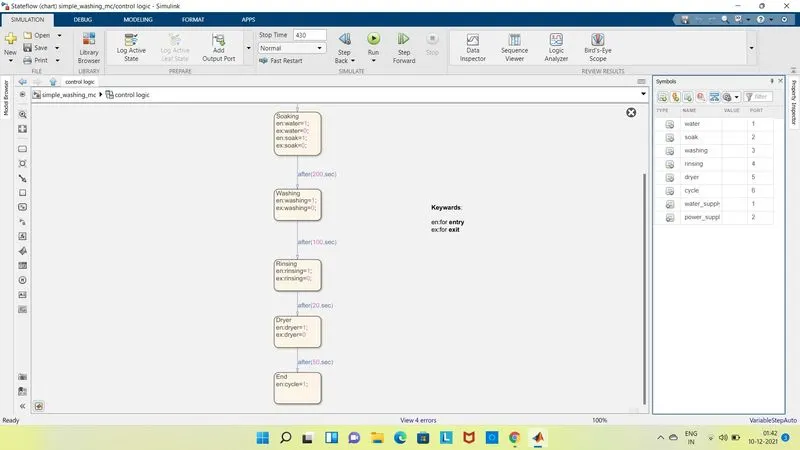
- I make this flowchart by following process:
1) I goes into MATLAB then in folder simulink i take chart block from dashboard.
2) In library browsers i used seven block in that block gives command i.e.start ,water, supply, soaking, washing, rinsing, dryer, end all this process
3)I used keywords i.e. en: for enrty of every processes and ex: for exit
4) Also gives command as per amchine conditions i.e.
- Soaking time-200sec
- Washing time-100sec
- Rinsing time-20sec
- Dryer time-50sec
5)then after make this all chart i goes in symbol pane then what work i have done that can be ddisplayed on symbol pen.
in this way flowchart sucessfully done'
- Simulink model of Washing machine:
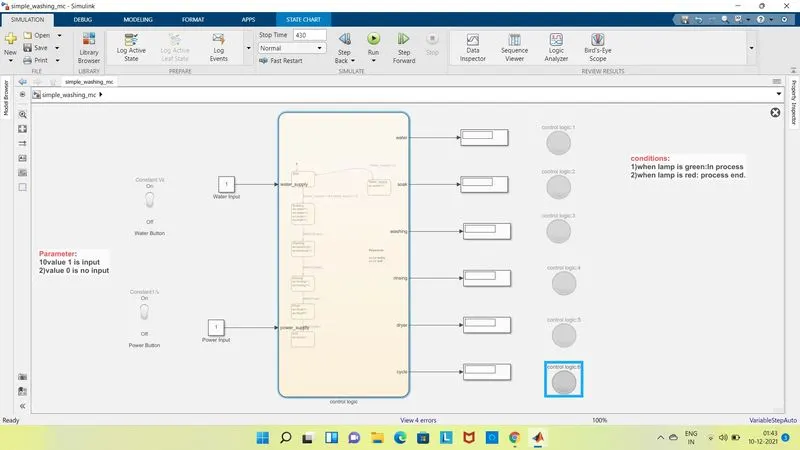
- Procedure for make simulink model of washing machine:
1) Firstly i maked that chart as above fig. I double click on that chart block the one chart block of flow2chart is created in simulink.
2) then i take 6 display block,6 lamp block, 2 cinstant block, two toggle switch.
3) all this block can rearranged as above model.and 6 data block remane as peocedure of washing machine i.e. water_supply, power_supply, water, soak, washing, Rinsing, Dryer, cycle.
4) after rename that block in symbol pen all that data can be seen easily.
5) toggle switch 1 is connected to water_supply block and toggle 2 switch can be connected to power_supply.
6) then all lamp i connected to each display block of as per procedure command .
7) as per conditions i double click on lamp block and set the colour i.e. 0=red 1= green.
- for making this model I used block as follows:
Chart block:
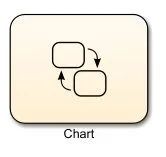
To run the given sequence operation of the washing machine we need to create stateflow chart to perform the operation with respect to time.as per the conditions If the power supply is available the system get activated .to start the machine we need to provide as input signal using the constant block with value as 1 defines ON state i. e. input supply and 0 is defines OFF states i. e. no input supply.And water supply also, i need to provide constant block to tell the ckt about its state.
- Toggle switch:
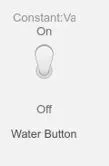
The Toggle Switch block toggles the value of the connected block parameter between two values during simulation. For example, you can connect the Toggle Switch block to a Switch block in your model and change its state during simulation. Use the Toggle Switch block with other Dashboard blocks to create an interactive dashboard for your model.Double-clicking the Toggle Switch block does not open its dialog box during simulation and when the block is selected. To edit the block's parameters, you can use the property inspector or you can right-click the block and select block parameter from the context menu. I used this toggle switch for ON OFF purpose of water supply and paower supply. also this switch one is connected to consatnt block of water supply and switch two is connected to power supply.
- Display:
This display block is display the out put of washing mahines procedures .it gives output as per process and display value wthout errror.
- Lamp:

A lamp block is added to dispaly all the operation and each colour is asssigned to each individual state. i.e. when lamp shows green colour is indicate that procedure is ON and hen lamp shows Red colour the procedure is stoped.
- Constant block:
Output the constant specified by the 'Constant value' parameter. If 'Constant value' is a vector and 'Interpret vector parameters as 1-D' is on, treat the constant value as a 1-D array. Otherwise, output a matrix with the same dimensions as the constant value. By changing the value of constant block of power supply and water supply i checked logic by change of lamp signal. the simulation run time for this logic is 430 second.
OUTPUT:
There is two conditions asked to solve in this question:
- Condition 1:- When water supply is OFF
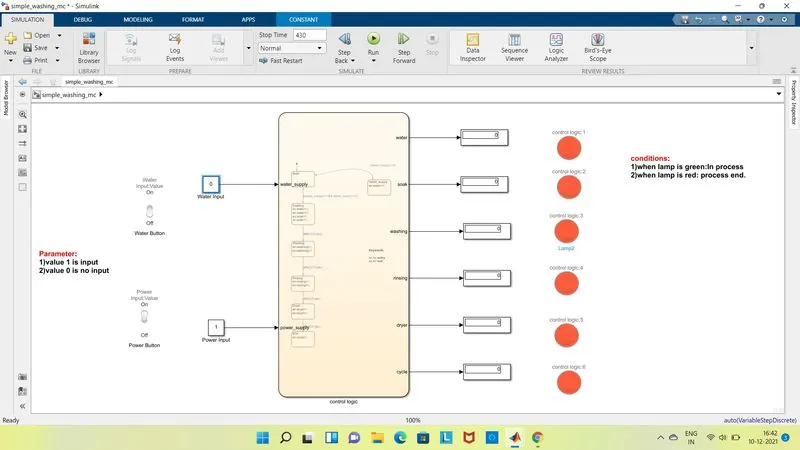
Im not provide water supply and check output....from above figure i can see that water indicator is showing Red i.e. when there is no water supply the process is terminated and Lamp is used to indicate that sate.
Condition2:- When water supply is ON :
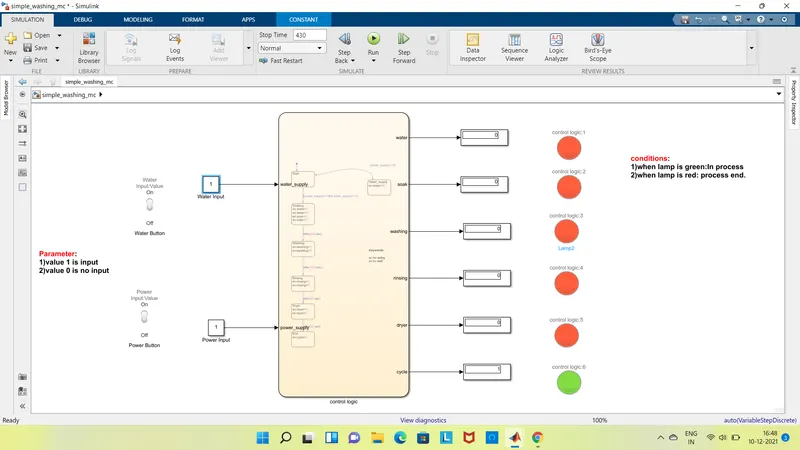
Now I provide the water supply and check the output. as i can observed from the above figure all state have been executed and indicating the process completion indicator names as shown green.
CONCLUSION:
In this way i studied making flowchart and simulation of washing machine using state flow is done and result is satisfacory.
Q.2) Make a Simulink chart for the “Gear shift” logic as per below conditions:
Speed Range(kmph) Gear
0 to 15 1
16 to 25 2
26 to 40 3
41 to 60 4
Above 61 5
Give speed input while the simulation is running & display the gear number.
ANS:
- Gear shifting theory:
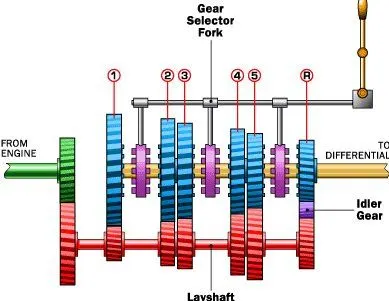
A gear shift is fixture in a vehicle which allows the driver to select the gear ratio most appropriate for the speed and conditions.also known as gear selector,gear lever or simply shifter the gear .the gear shift interface with the gear box in the vehicle drive train .the design of the shifter can vary widely depending on what type of vehicle is involved and whether the transmission is manually or automatically.
- Gear mechanism work:
when a driver uses a gear selector mechanism he is actually shifting the forks inside the gear box to the gear at higher or lower rotational speed the higher speed a gear attain the lower rotational speed the heigher speed a gear attain the lower is amount of torque it transmit it depends upon the wisdom of driver to shift the gear for smooth ride.
- Automatic gear shifting:
the gear shifter allows the vehicle to be put into different gear on a manual transmission in an automatic transmission the gear shifter is known gear selector the gear knob is the top of gear shifter and includes a shift pattern that guide the gear selection.
- FLOWCHART OF GEAR SHIFTING:
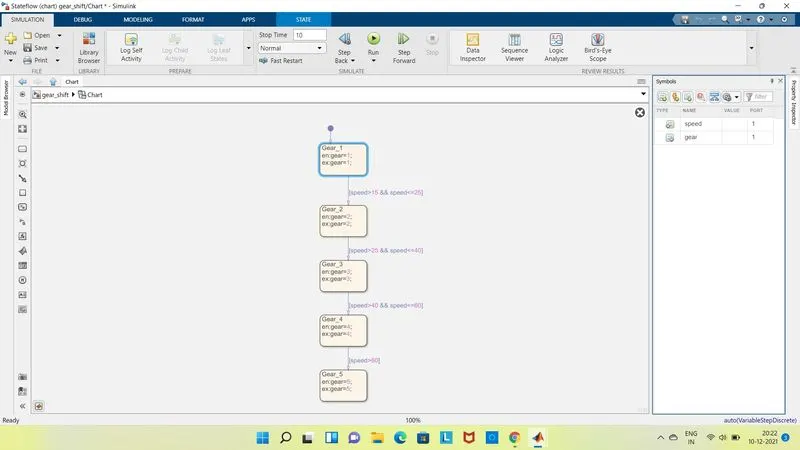
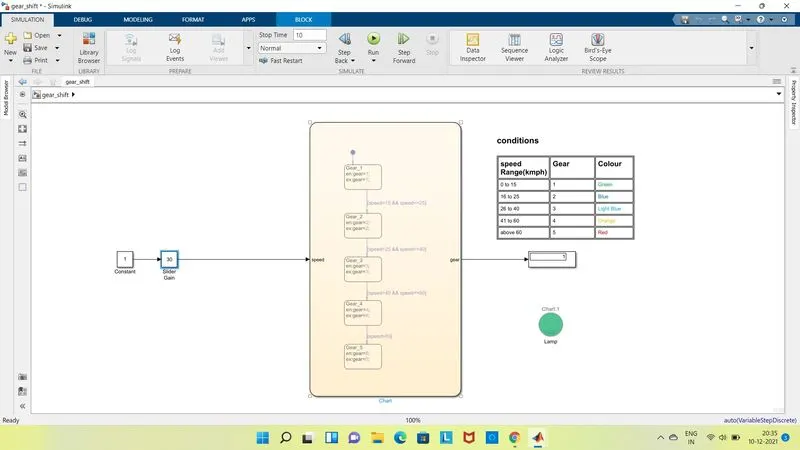
For making this flowchart i goes to MATLAB and duble click on it and take chart block and making flowchart as per given conditions:
| Speed range(kmph) | Gear |
| 0-15 | 1 |
| 16-25 | 2 |
| 26-40 | 3 |
| 41-60 | 4 |
| above 61 | 5 |
then look at the fig.at right side symbol pen box is open here i give speed as input for the chart also speed as an output for this chart.
- Simulink model of gear shifting:
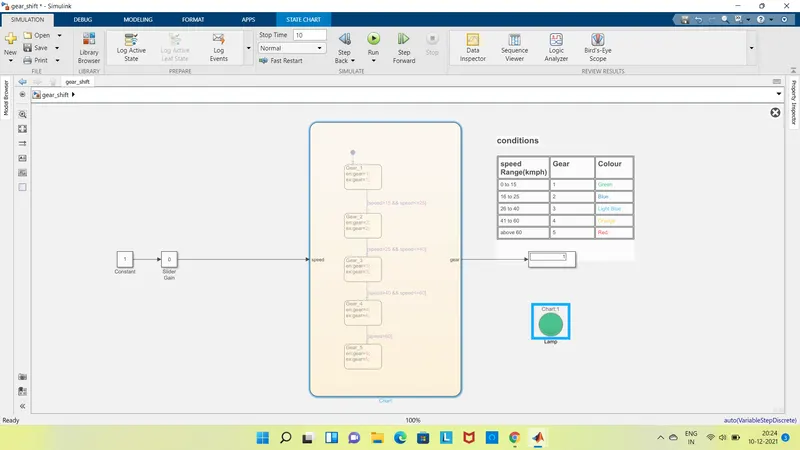
For making this simulink model I used slider gain, constant block, display block, lamp.and this all block used as input and output for flowchart model.the function of each block is as follows:
- Chart block:
To run the gear shifting model this we need this block in that block we can easily draw our system as per given gear name and speed conditions.with the help of this block i easily run my model without error.
- Slider gain block:
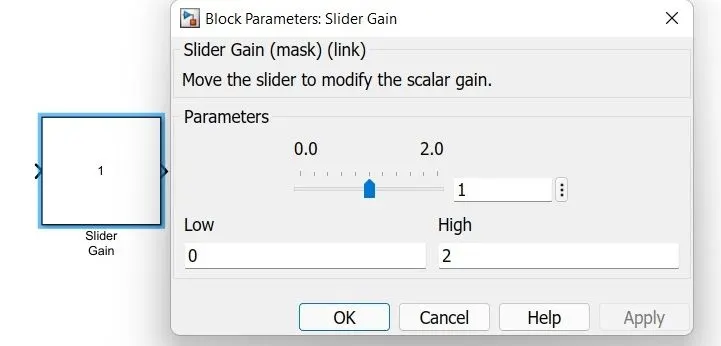
With the help of slider gain block i can easily vary my gear speed and its really easy way to used for input purpose because of this i easily vary my speed as per my requirement get satisfying outputs.
- Display block:
with the help of this display block i easily show my outputs.
- Lamp:
The lamp I mainly used for indication purposed after my gear simulation is run successfully .I connected this lamp to the gear and at display block and also i used different colour of lamp for different gear and varying speed that as follows:
| Speed range (kmph) | Gear | colour |
| 0-15 | 1 | green |
| 16-25 | 2 | blue |
| 26-40 | 3 | dark green |
| 41-60 | 4 | orange |
| above 61 | 5 | Red |
When I vary the speed with help of slider the lamp will glow as per conditions.
- Constant Block:
Output the constant specified by the 'Constant value' parameter. If 'Constant value' is a vector and 'Interpret vector parameters as 1-D' is on, treat the constant value as a 1-D array. Otherwise, output a matrix with the same dimensions as the constant value.
- Outputs With Conditions:
The outputs produced is recorded when its displaying the each gear.
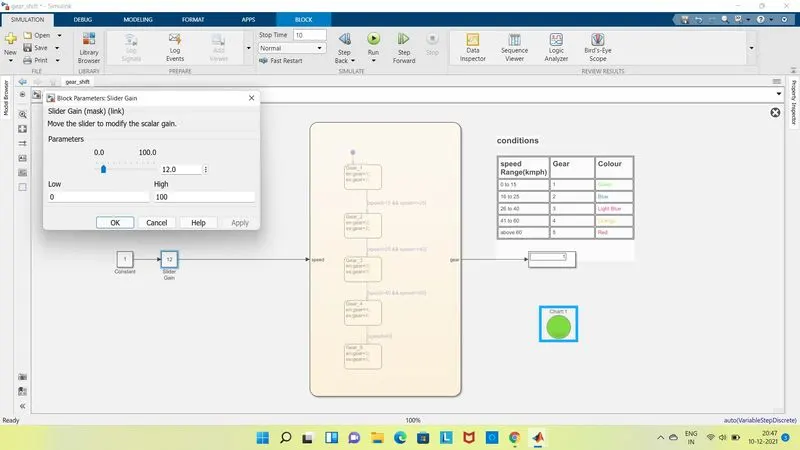
- Gear_1:-
speed range: 0 to 15 kmph
Input speed : 12 kmph
colour of lamp shows: Green
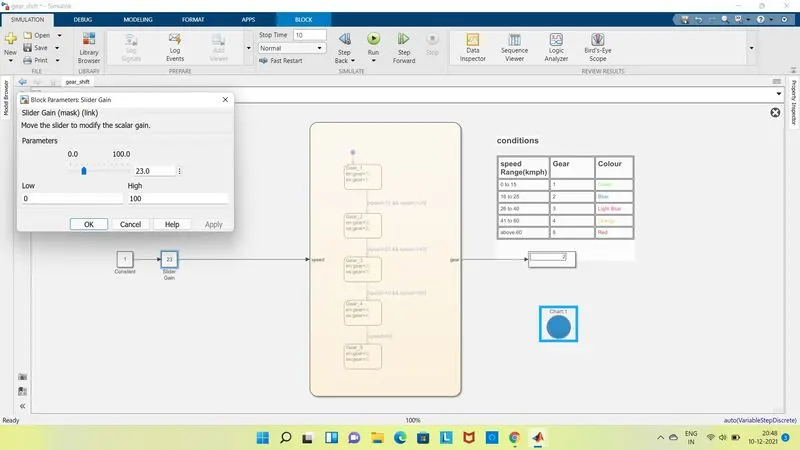
Gear_2:
Speed Range : 16 to 25kmph
Input speed: 23kmph
colour of lamp: Blue
- Gear_3:
speed Range: 26 to 40kmph
Input speed: 30 kmph
colour of lamp: Dark green
- COCLUSION:
Gear_4: Gear_5
speed range : 41 to 60kmph speed range : above 60kmph
Input speed: 50kmph Input speed: 80kmph
clour of lamp: Orange clour of lamp: Red
In this way I created state flow chart and with help of this state flow chart i maked simulink model and run this simulationfor 100 sec and getting outputs as above and as per given range of speed the lamp is glow in different colour for indication and gives outputs satisfactory.