Week - 4
Aim 1 :- Implement control logic of " Washing Machine " using stateflow as per given sequence .
1) If the Power supply is available , the system gets activated
2) If the water supply is not available , stop the process & indicate through LED.
3) Soaking time should be 200 sec followed by washing machine time of 100 sec.
4 ) Then rising happens for next 20 sec & dryer runs for 50 sec.
After all the process have completed turn On the finished LED
Solution :-
State flow :- State flow is a method to convert a flow chart or any truth table into systematic manner . It provides a graphical language which indicates a state transition tables and flow charts . With the help of state flow we can also explain MATLAB algorithm react to time based condition .
With the help of state flow we can give condition as per our requirement and monitior the process , we can easily detect the fault and quickly rectify it .
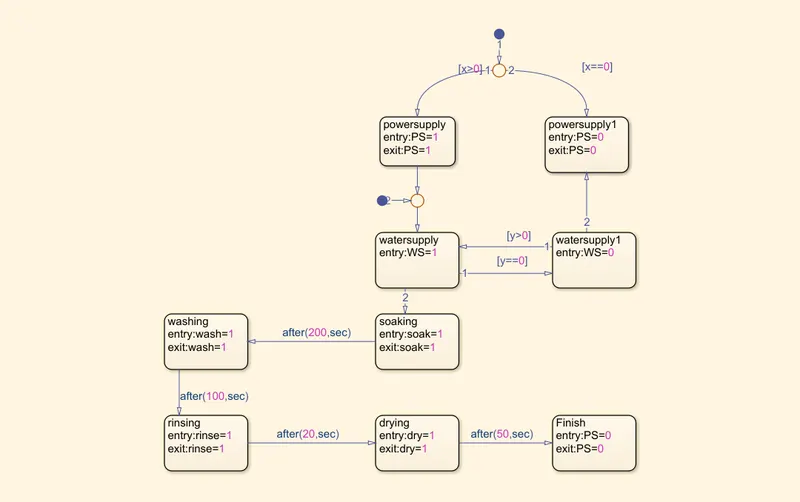
Control logic of Washing Machine :-
Process :-
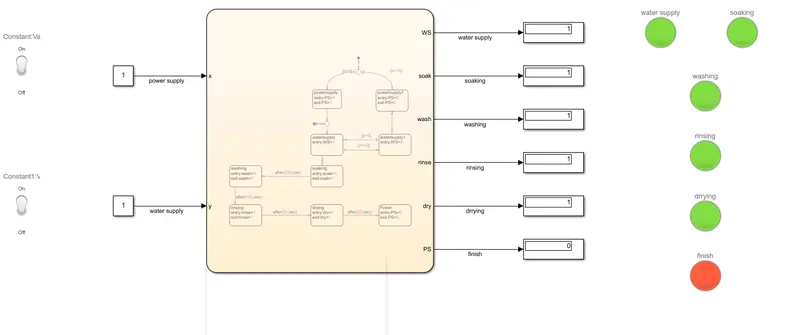
1) In the above control logic at junction 2 condition has been put 1 when power supply is on i.e [x>0] and another when power supply is off i.e [ X==0]. If the power supply is ON state then only machine is going to perform the next step or else it will be remain in OFF state .
2) Further it will similarly check the water supply condition , If the water supply is on then only all the function will work and if water supply is in OFF state machine will not process further if [Y>0] that means water supply is ON and machine is ready to perform further task , whearas if water supply is off i.e [y==0] that means supply is off
3) Further soaking activity is performed for 200 sec . If water supply is ON , further for 100 sec washing activity is done after those 100 sec rinsing activity is done for 20 sec followed by drying for 50 sec .
4) Once all the activity of total time of 370 sec has been done all activity has been stopped and finished LED has been blown , which denotes that washing of clothes has been completed .
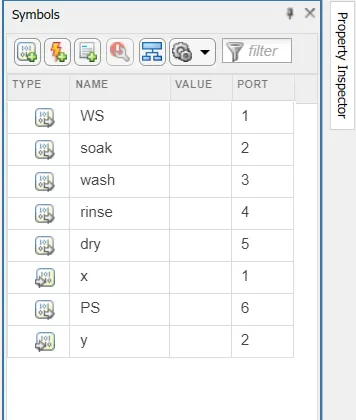
Following table is of symbol span
Following table shows Symbol span variable where " x " and "y " are the input port of the chart which denotes the power supply and water supply where as rest of variable are output of chart.
Following is complete arrangement of washing machine along with switch and indicators
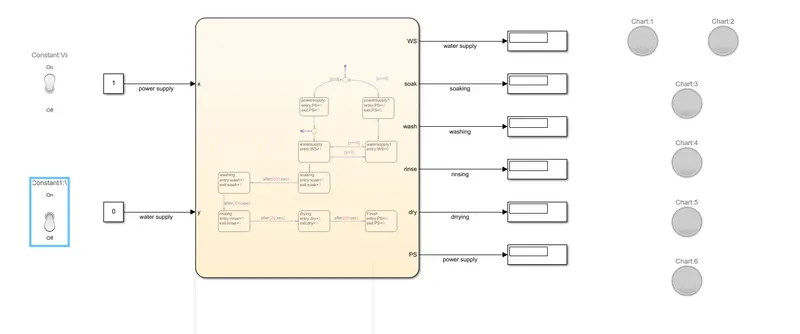
Result :-
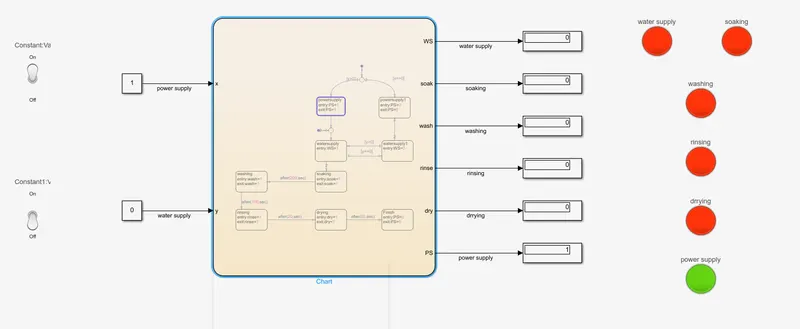
Conditions :- 1) If the power supply is available system gets activated .
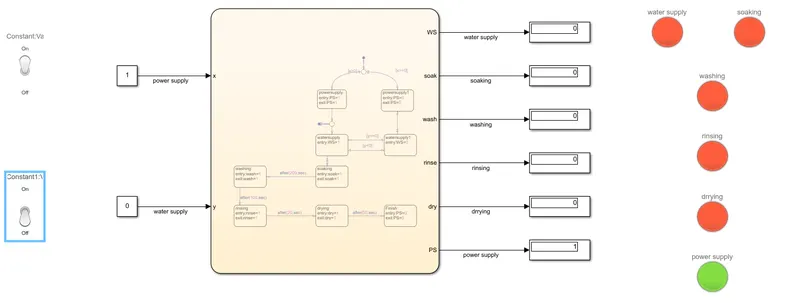
2) If water supply is not available system stop working
for 100 sec machine has been tested but as water supply is off so system doesn't show any response .
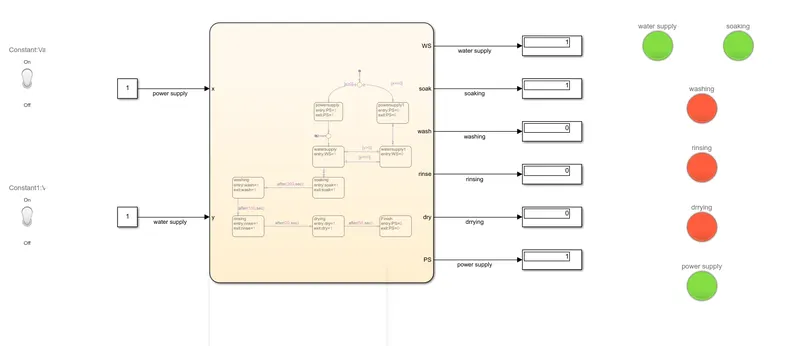
3) After 200 sec , soaking has been done .
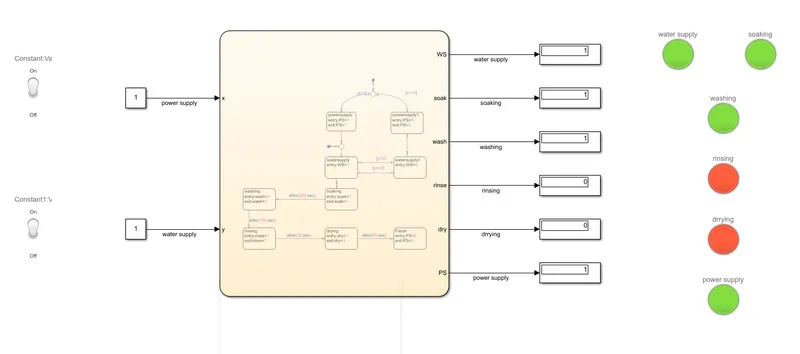
4) After 300 sec , Soaking and washing has been done .
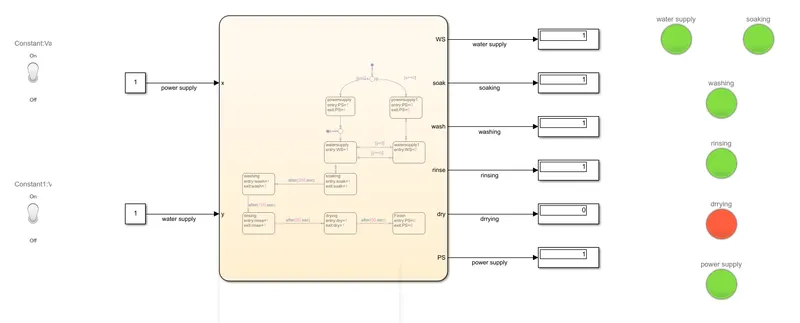
5) After 320 sec
6) After Completion of all the function after 370 sec finished LED is glown .
Aim 2 :- Implement a Simulink chart for the " Gear shift " logic as per the below conditions
| Speed range ( Kmph) | Gear |
| 0 to 15 | 1 |
| 16 to 25 | 2 |
| 26 to 40 | 3 |
|
41 to 60 |
4 |
| Above 61 | 5 |
Give speed input while stimulation is running and display the gear number .
Solution :-
Simulink chart for gear shift logic can be made according to given condition by
1) In Slimulink Open an chat block , inside chat block a new page has been opened on which complete gear shift logic has been made
Which would be looking like as
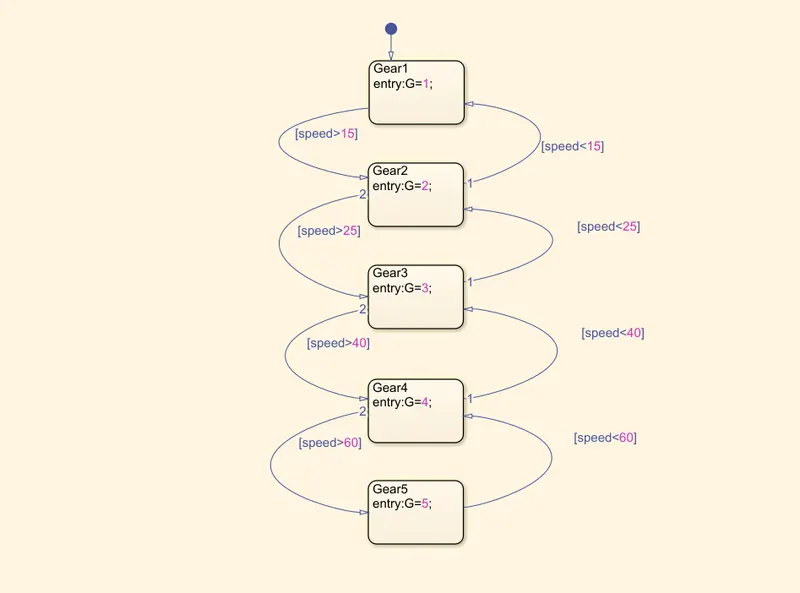
Following state flow denotes control logic of gear shift
In the above control logic we can seen that if the speed limit is 0 to 15 kmph Gear displayed is 1 and if speed exceeds the 15 a logic has been given in above diagram we can seen (speed>15 ) then Gear 2 will be displayed . Similarly a speed limit has been set for each gear . Whear as we can seen that there is return arrow towards gear 1 with logic ( speed >15) that denotes that if the speed limit reached below 15 the automatically displayed Gear will be 1 . Similarly it will be followed for different speed range . For speed range 16 to 25 kmph Gear 2 will be displayed , for 26 to 40 kmph Gear 3 , for 41 to 60 kmph Gear no 4 whereas above 61 kmph Gear no 5 will be continued .
| Speed Range (kmph) | Gear |
| 0 to 15 | 1 |
| 16 to 25 | 2 |
| 26 to 40 | 3 |
| 41 to 60 | 4 |
| Above 61 | 5 |
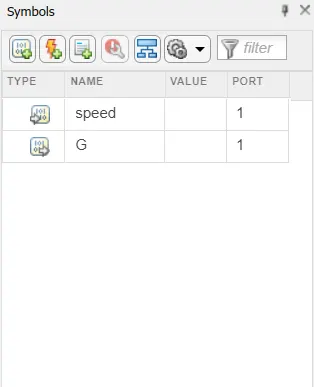
Above image is symbol span of the chart of Gear logic where speed is input port and G that is gear is output port .
Following fig shows the systematic arrangement of displayed screen with respect to speed .
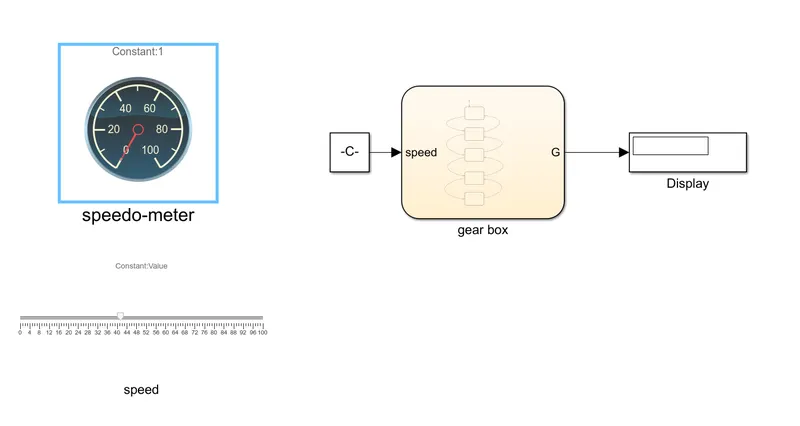
In the above fig A constant block has been added to the speed side , whearas displayed block has been added to G so that
gear number should be displayed on screen
A slider and speedo meter has been placed to give input as speed as speedometer to displayed how much is speed at present . Both block has been connected to the constant block .
Result:-
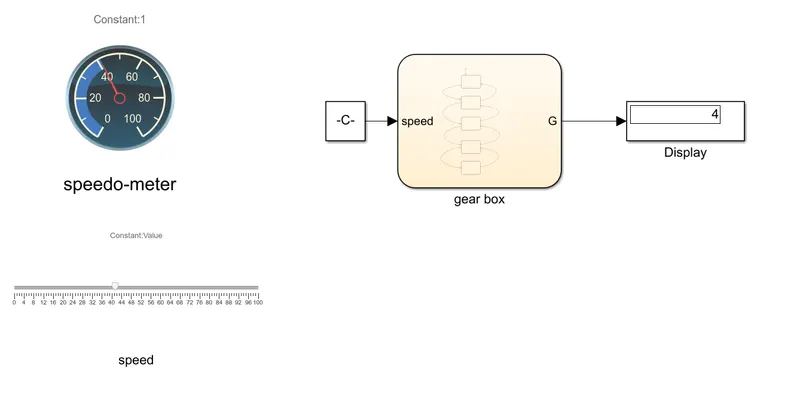
Following Figure shows when the speed near by 42 kmph is maintained then perfectly the display screen is showing as gear no 4 . Which is accordingly to our requirement .