Week - 4
A)Title:-
1)Implement control logic of a “washing machine” using Stateflow as per given sequence:
- If the power supply is available, the system gets activated
- If the Water supply is not available, stop the process & indicate through LED
- Soaking time should be 200s followed by Washing time of 100s.
- Then rinsing happens for next 20s & dryer runs for 50s
After all the processes have completed turn on the finished LED
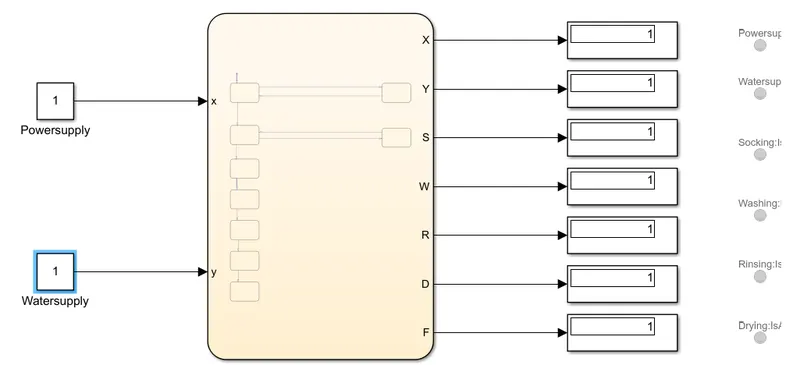
B)Simulink model:-
C)Stateflow:-
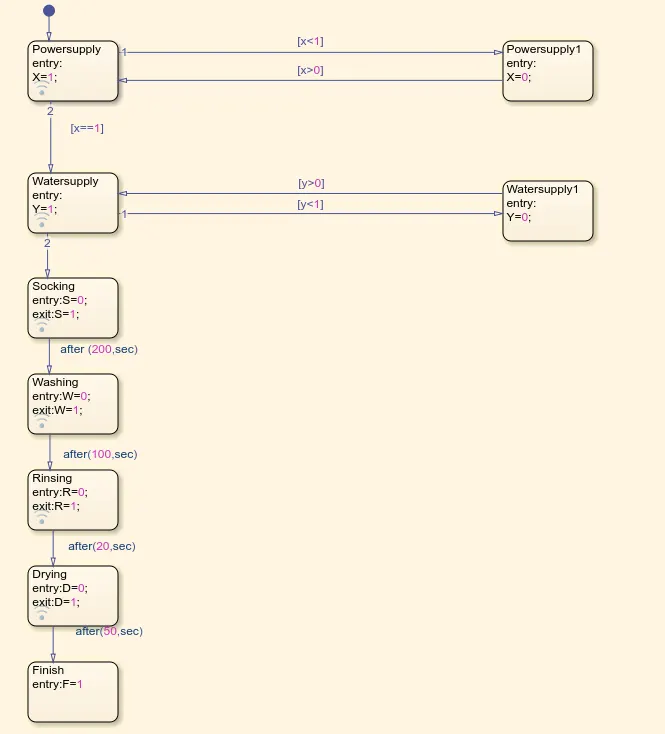
D)Explanation:- 1)Above figure shows the stateflow of the washing machine operation.
2)In washing machine their are various process like socking,washing,rinsing, drying. all the process are given in the stateflow
3)In our stateflow iwe are given two input that is power supply and water supply.
4)According to question the socking time is 200sec, for washing 100sec, for Rinsing 20sec, and for drying 50sec.
5)Logic is created in the stateflow and used by simulink model.
6)In simulink model we have to give two constant for two input i.e water supply and power supply.
7)In the starting all the display showing zero and after start of the simulation one by one showing 1 that means this process is running or completed in the end all display showing one that means all the process is completed.
8)Also used 7 Display for all the process(output) and input. ans 7 lamp also used to show the which process is processing.
E)Output:- All lamp is glowing one by one according to the time delay is given in the question for each process.
------------------------------------------------------------------------------------------------------------------------------
A)Title:-
2. Make a Simulink chart for the “Gear shift” logic as per below conditions:
Speed Range(kmph) Gear
0 to 15 1
16 to 25 2
26 to 40 3
41 to 60 4
Above 61 5
Give speed input while the simulation is running & display the gear number.
B)Simulink Model:-
C)Stateflow:-
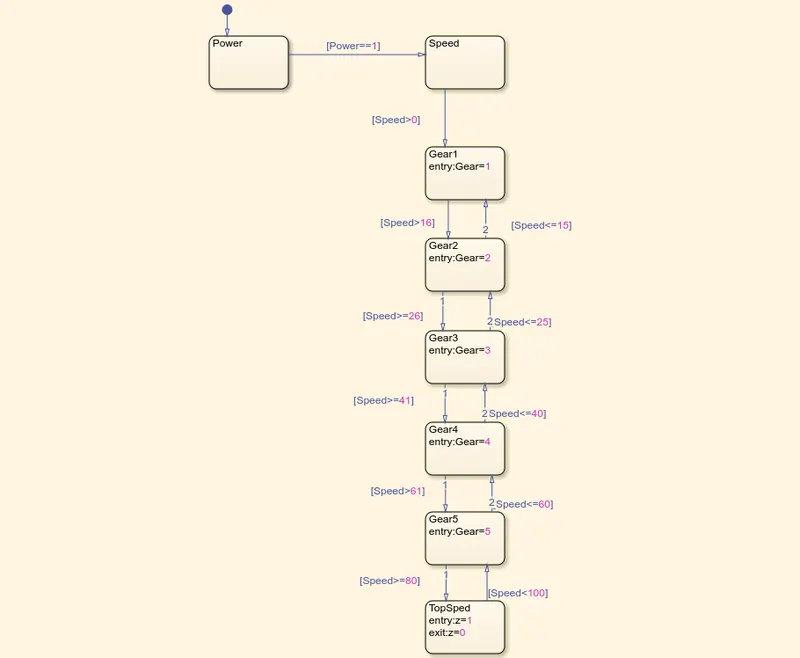
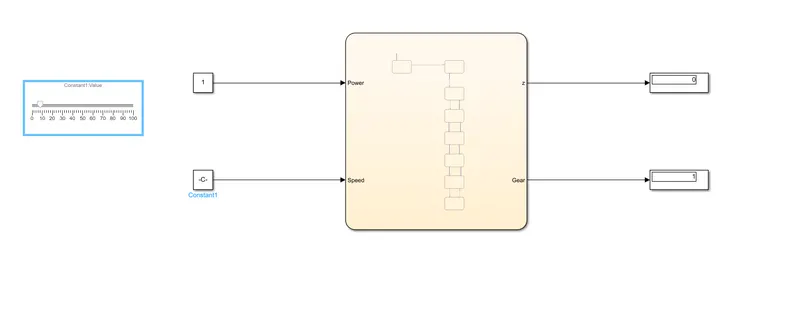
D)Explanation:- 1) In the a above simulink model gear shift process is shown.
2) According to the question at what speed which gear should give is shown below.
SPEED GEAR
0 to 15 1
16 to 25 2
26 to 40 3
41 to 60 4
Above 61 5
3) According to above condition Gear shift chart is created and this chart is used by the simulink model and show the output.
4) In simulink model their are two input i.e ome is speed and another one is power.
5) For one input i.e Power we have to give constant block and for speed also used constant block but constant value is provided by the slider and the slider range is 0 to 100.
E)Output:- In the output we observe that at time of runing the simulation if we change speed by slider the gear will be change according to the given conditon.
0 to 15 1
16 to 25 2
26 to 40 3
41 to 60 4
Above 61 5