Week - 4
1. AIM
- To implement control logic of a “washing machine” using Stateflow.
OBJECTIVE
- When the power supply is available, the system should be activated.
- When the water supply is not available. the process should be stopped and indicated through the LED.
- The soaking time should be 200s, followed by a washing time of 100s.
- Then rinsing happens for the next 20s and dryer runs for 50s.
- finally finished LED should be turned on after the completion of the process.
STATEFLOW CHART
- Firstly chart block is selected and entered into the chart environment.
- State's are selected according to our design.
- State blocks are created with proper names and state actions.
- The below diagram shows the chart for the washing machine model
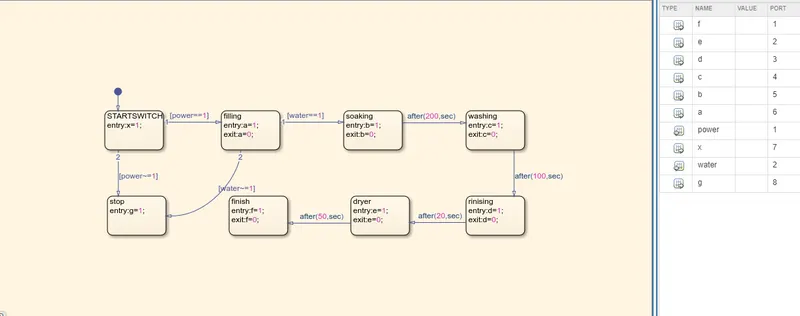
- There are 8 blocks, with names start switch, filling, soaking, washing, rinsing, dryer, finish, and stop. we have 2 inputs - power, water, and 8 outputs - x, a, b, c, d, e, f, g.
- The direction of the arrow is important ie. from which block to another one.
- Here we have given the conditions for power, water ([power==1]) and messege names (after(200,sec)) for delay purpose.
EXPLANATION
- When both the power and water conditions are satisfied ie. [power/water==1], the process works and gets completed.
- when anyone's condition is not satisfied ie [ power/water~=1], the process does not work and ends at stop block.
- After both conditions are true [power/water==1] soaking process will take place for 200 sec, then washing for 100 sec, then rinsing for 20 sec, then dryer for 50 sec, and finally the process finishes.
COMPLETE MODEL
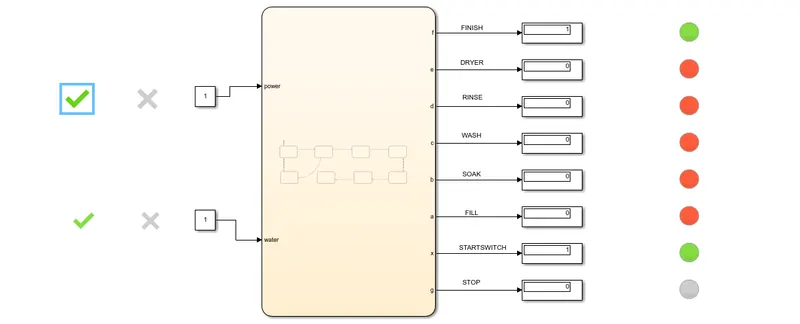
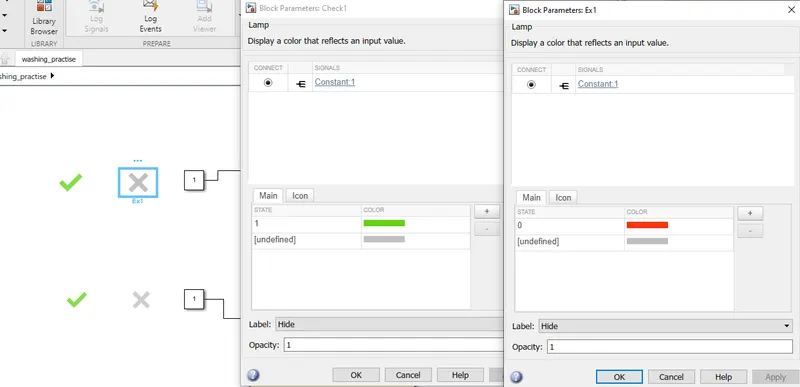
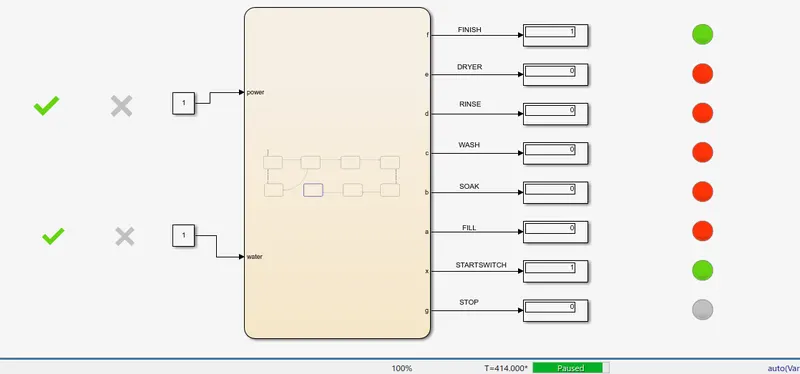
- The input power, water are connected to constants, and these are connected with the icons
 , such as 1 for check and 0 for Ex.
- The outputs are connected with corresponding displays and lamps. where displays are used for displaying values 0 and 1, the lamps are used for indicating their present state and for clear understanding.
- further explanations are done with the following output diagrams.
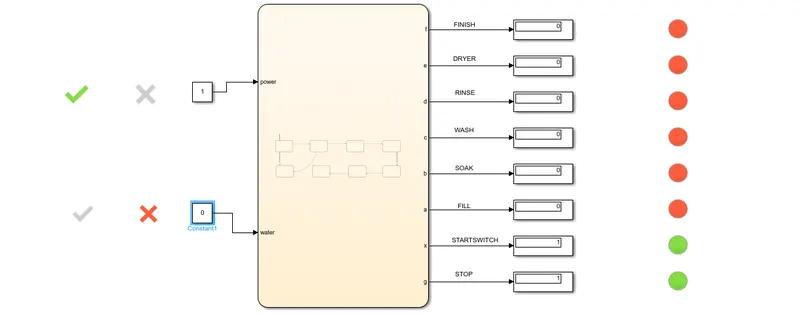
- Generally, green lamps indicate the present state of the process while the red indicates off state ie. not occurring or happening.
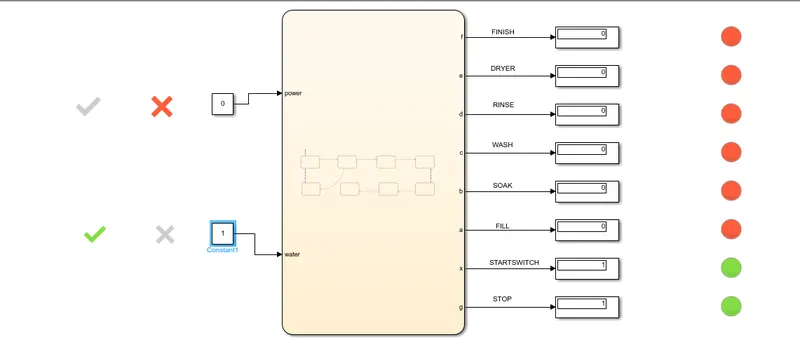
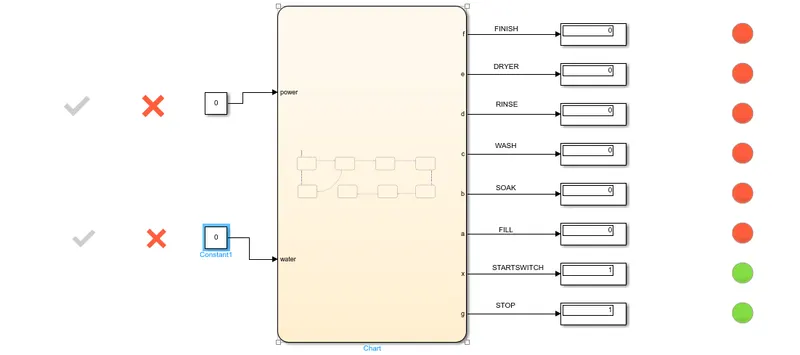
OUTPUT 1 - When any one input or both are not satisfied, the process does not work and it stops with the indication lamp. only the startswitch and stop lamp are green.
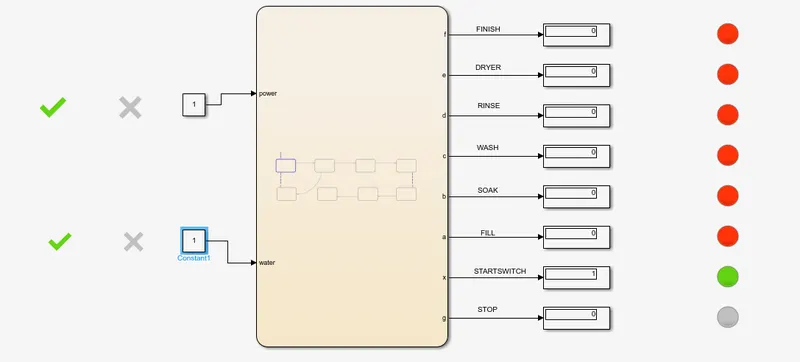
OUTPUT 2 - When both the input are satisfied the startswitch , fill lamps are green
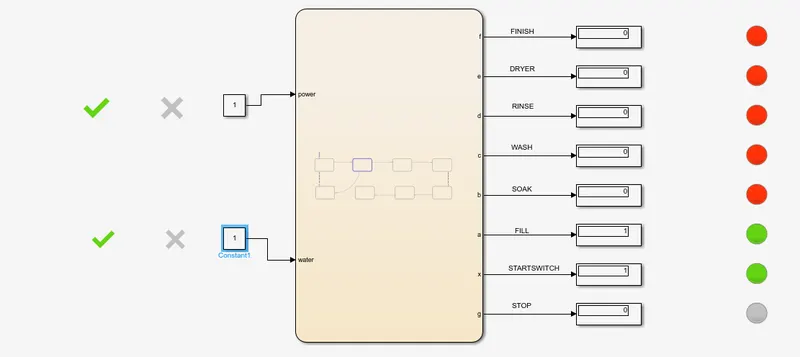
OUTPUT 3 - After filling soaking occurs for 200s. startswitch and soak lamps are green
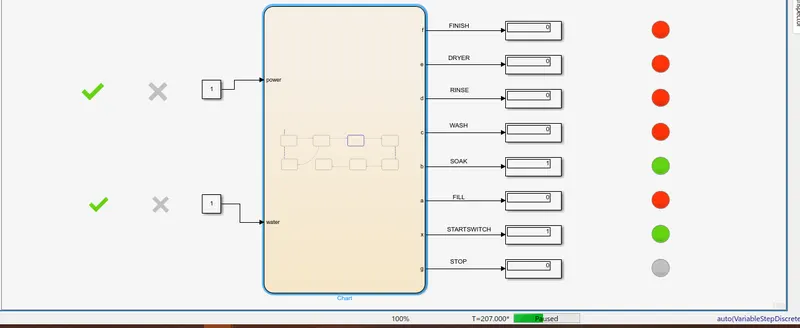
OUTPUT 4 - Then washing occurs for 100 s.
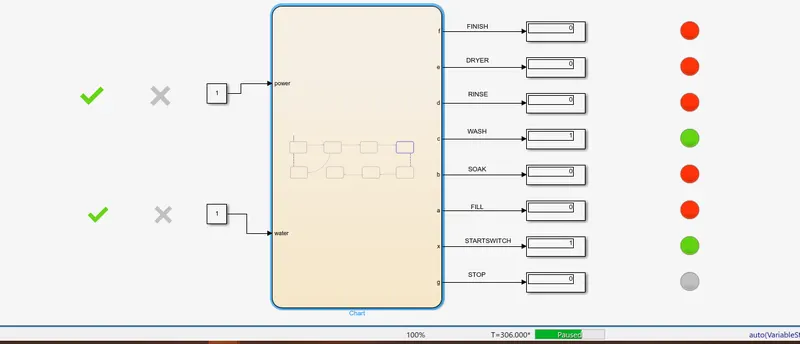
OUTPUT 5 - Rinsing for 20 s.
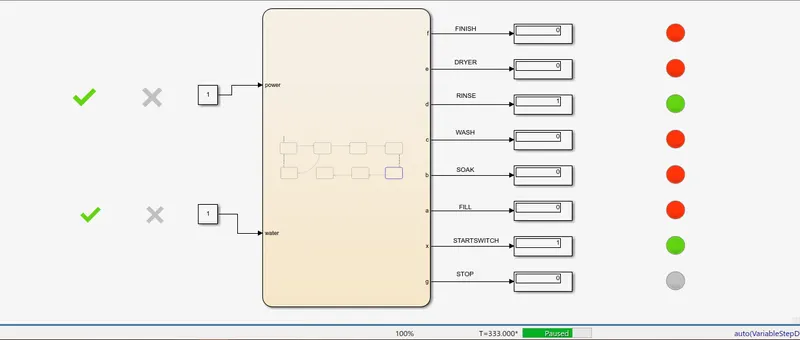
OUTPUT 6 - Dryer for 50 s.
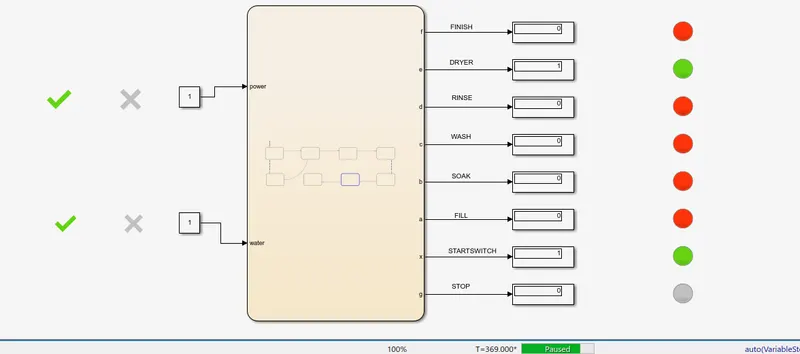
OUTPUT 7 - The process is completed leaving startswitch and finish lamps in green.
RESULT
- Thus the control logic of a “washing machine” using Stateflow is implemented.
2. AIM
- To make a Simulink chart for the “Gear shift” logic and to implement the Stateflow.
OBJECTIVE
Speed Range(kmph) Gear
0 to 15 1
16 to 25 2
26 to 40 3
41 to 60 4
Above 61 5
- According to the input speed range, the gear numbers should be displayed.
STATEFLOW CHART
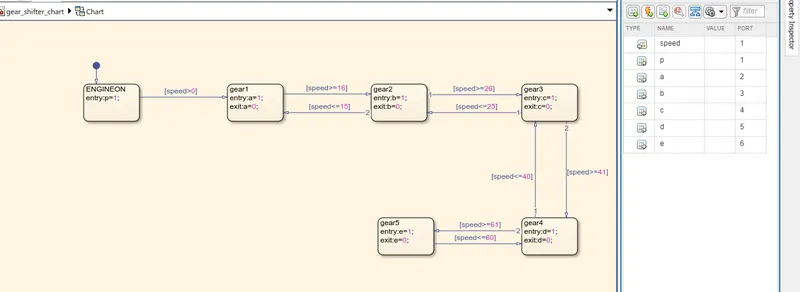
- There are 6 blocks with names engineon, gear1, gear2, gear3, gear4, gear5, 1-input (speed), and 6-outputs, p, a, b, c, d, e.
- The speed conditions according to directions are conditioned.
- when 0 < speed <= 15, gear1 block should be active.
- when 16 >= speed <=25, gear2 block should be active.
- when 26 >= speed <=40, gear3 block should be active.
- when 41 >= speed <=60, gear4 block should be active.
- when speed > 61, gear5 block should be active.
COMPLETE MODEL
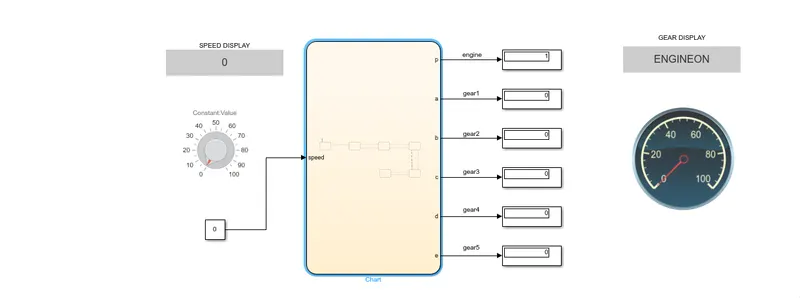
- The constant is given as the input (speed) to the chart.
- The knob is connected to the constant block which helps us in varying the speed range from 0 to 100 during simulation.
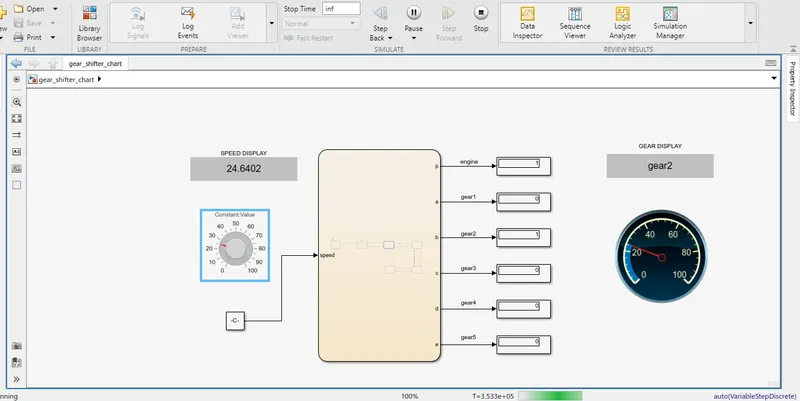
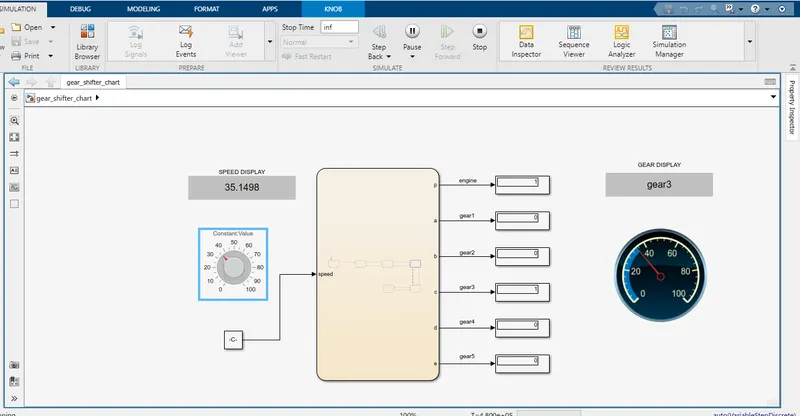
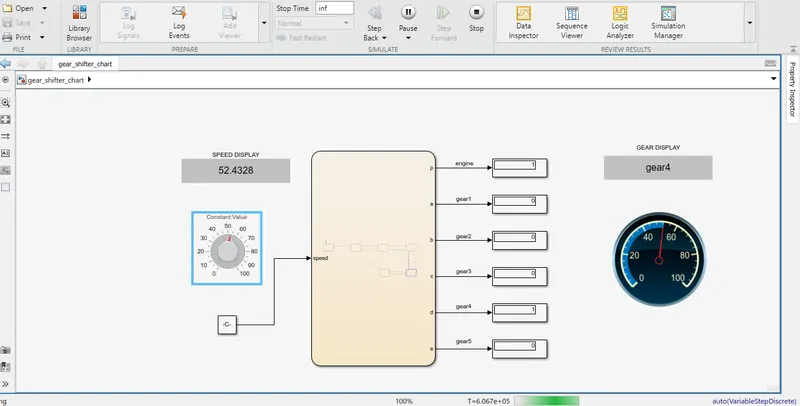
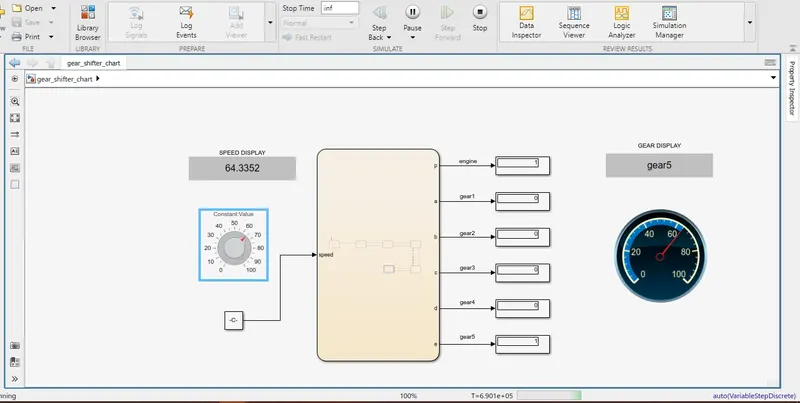
- Speed display and circular gauge are connected to the constant, so when we are varying the input speed through the knob, input speed is displayed.
- The gear display is connected to the chart, so according to the logic inside the chart, the gear number is displayed.
- The displays are used for observing the present state of the process.
- The stop time for this simulation is set to inf.
- the above diagram shows the initial state when speed is 0 and the engineon block inside the chart is active.
- from the below outputs, we can observe that according to the speed variations the gear number varies.
OUTPUT 1 - speed range 1-15 || gear1
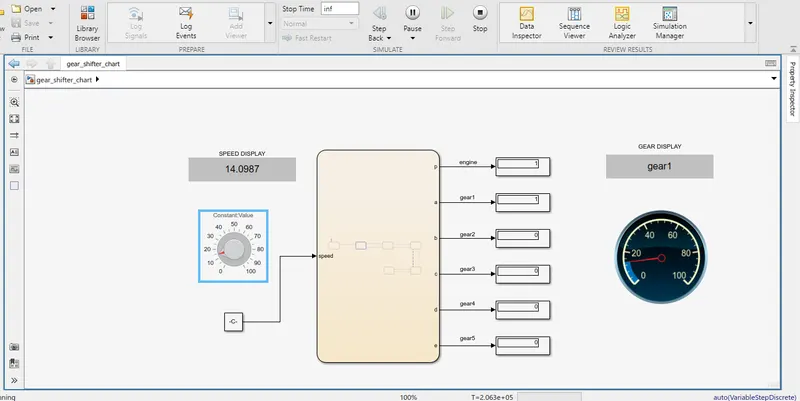
OUTPUT 2 - speed range 16-25 || gear2
OUTPUT 3 - speed range 26-40 || gear3
OUTPUT 4 - speed range 41-60 || gear4
OUTPUT 5 - speed range > 61 || gear5
RESULT
- Thus a Simulink chart is made for the “Gear shift” logic and implemented using the Stateflow.
REFERENCE - Video lessons, library browser, FAQ.
LINKS
- WASHING MACHINE: https://drive.google.com/file/d/12QhpBcxn2MNECDxTSfdW9c1btSJ1_3os/view?usp=sharing
- GEAR SHIFTER: https://drive.google.com/file/d/1p-0Elg_5URy0Y5w3njwIXnDYiZPuXS4g/view?usp=sharing