Week - 4
USING STATEFLOW IMPLEMENTING CONTROL LOGIC OF A WASHING MACHINE:
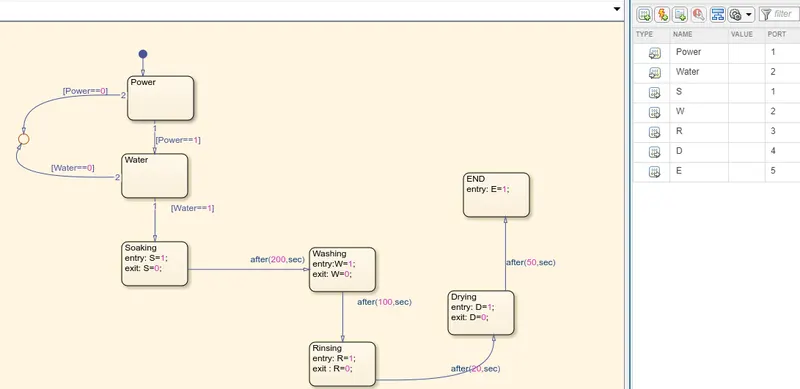
The stateflow model of a washing machine consists of a chart which is a kind of simulink scripting in which the whole control logic of the machine is designed. Following are the elements it consists of :
- Power block and Power input is provided and also a switch is connected as power input.
- Water block and water input is provided and also a switch is connected as whether the water level is good to go or not,
- Soaking block which runs for 200 seconds.
- washing block which runs for 100 seconds.
- Rinsing Block which runs for 20 seconds.
- Drying Block which runs for 50 seconds,
- End Block.
- Also, led switches are provided at the end of the process and when the water level is not optimum.
Below is the block:
1) When the power input is not provided such that P=0 AND W=0.
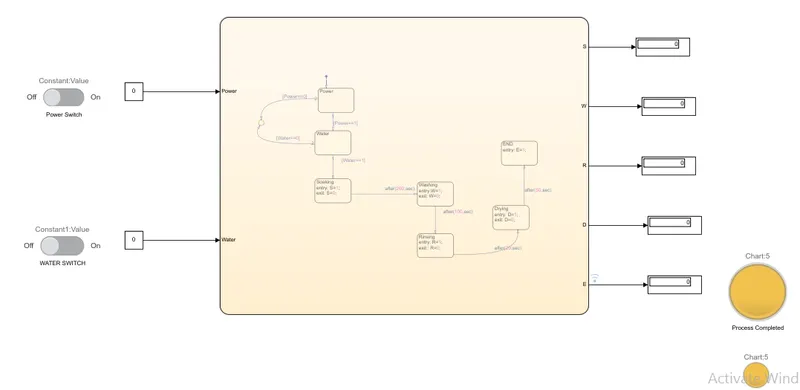
2) RESULTS- WHEN SWITCH IS CONNECTED SUCH THAT P=1 AND W=1 AND STOP TIME=400sec
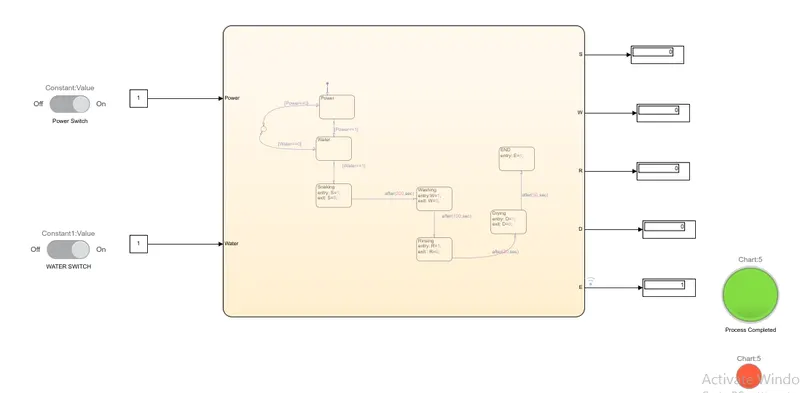
RED LED- water level down
GREEN LED- process completion
MAKING A SIMULINK CHART OF GEAT SHIFT LOGIC AS PER THE GIVEN CONDITIONS:
Here , following is the situation given for the simulation:
- 0-15 km/hr --------Gear 1
- 16-25 km/hr -------Gear 2
- 26-40 km/hr -------Gear 3
- 41-60 km/hr ------Gear 4
- Above 61 km/hr----Gear 5
Following are the blocks/componets are used in this simulation:
- Charts- Here conditions are set for the gear speed as given above and with use of chart on speed input is provided and for monitoring outputs, gears are displayed such that when the speed increases or decreases the block in the chart representing gears displayed on the led lamp.
- Constant Block- Here i provided constant block and connected slider with it, so that i can play with the simulation.
- Scope- It is provided to check the graphical validity of the gear speed simulation such that it represents at what speed, which gear was used during simulation.
- LED lamps- These are provided so that when speed increases or decreases, accordingly the gear value emits on the led lamps.
- Slider- Here in this simulation it worked as a throttle such that it is connected with the constant block and simultaneously when i increased or decreased the slider value, gear values also changes accordingly.
How i interacted during the simulation:
I used stop time as infinite which result in never ending process of simulation till the time we hit the stop button and during that time , i used slider from dashboard library browser , which is connected with constant block and given as speed input and its value can be increased from 1 to 100. So accordingly the value of the gears changes from 1 to 5.
Given below is the full representation of simulink model:
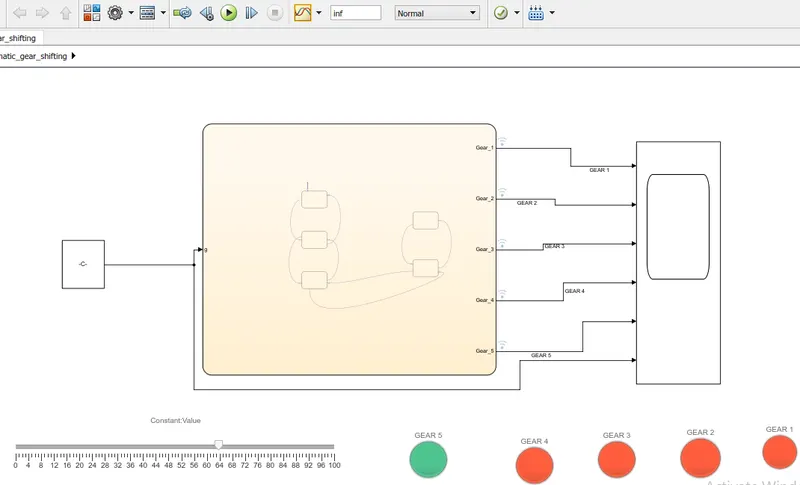
In the above model, it is clearly shown that stop time was used as infinite.
Also when the speed is above 61 km/hr as shown in the slider , Gear 5 LED lamp is glowing green.
Below is the inside view of chart where scripting is done with the help of blocks and conditions:
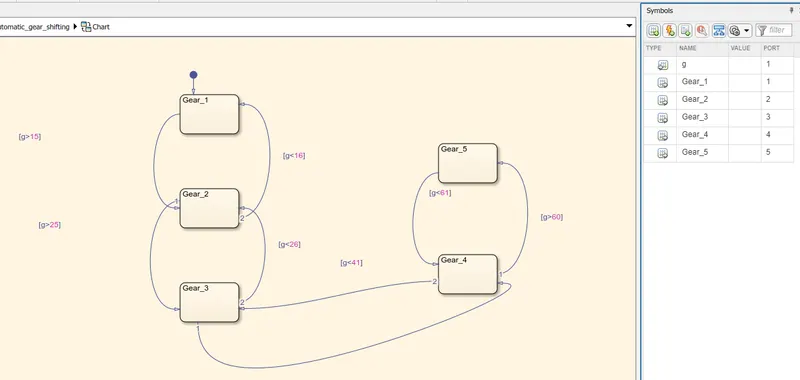
Below is shown interaction while the simulation is running at various speed:
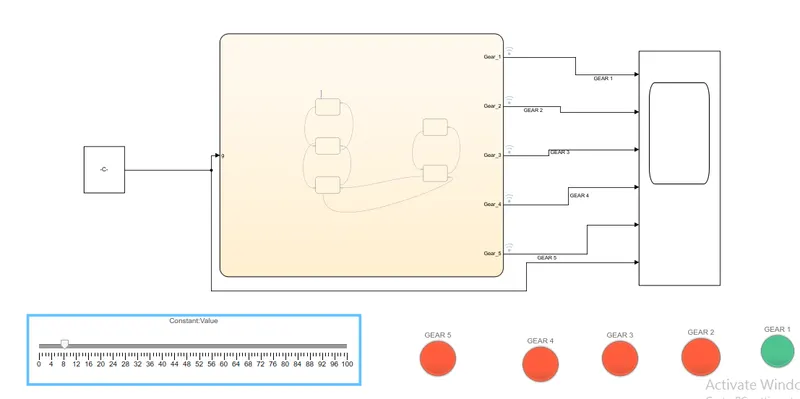
Here speed is below 15 km/hr, so Gear 1 LED GREEN LAMP IS GLOWING.
When the speed is between 16 to 25 km/hr:
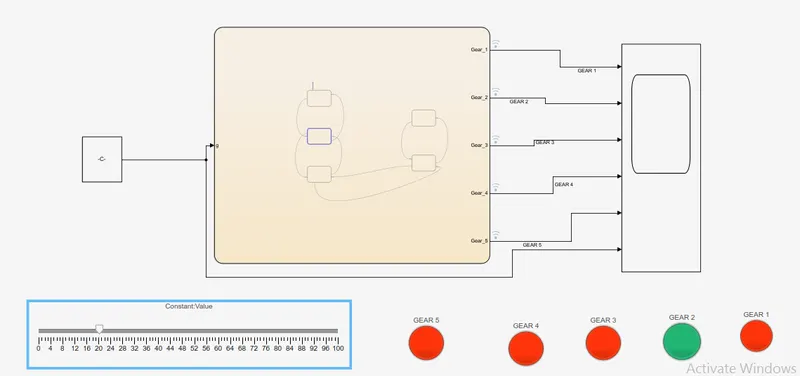
here gear 2 Green LED lamp is glowing.
When speed is between 26 to 40 km/hr:
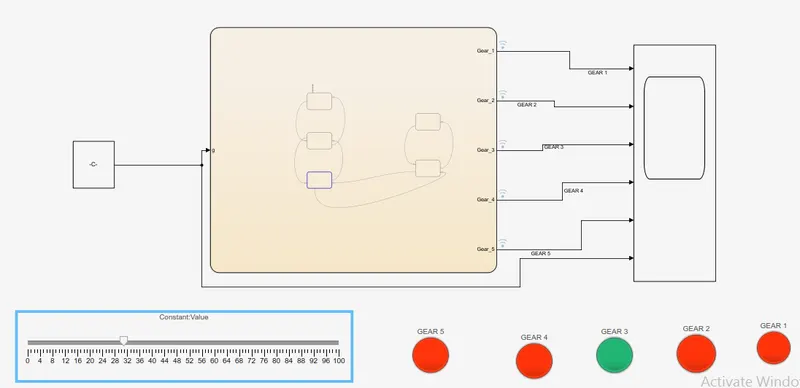
Here gear 3 Green LED lamp is glowing.
When the speed is between 41 to 60 km/hr:
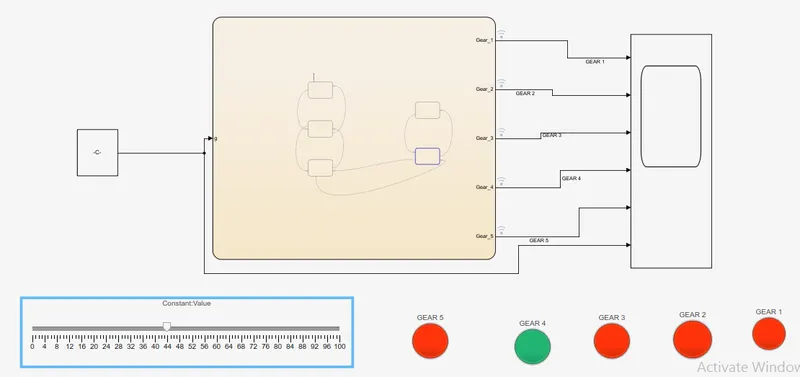
Here Gear 4 Green LED lamp is glowing.