Week - 4
1. WASHING MACHINE
AIM: To implement control logic of a “washing machine” using Stateflow.
OBJECTIVE: Design a Stateflow with the following conditions
- If the power supply is available, the system gets activated.
- If the Water supply is not available, stop the process & indicate through the LED.
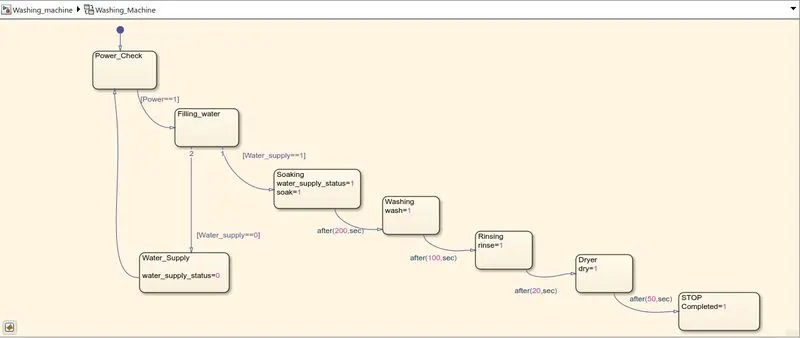
- Soaking for a time period of 200s.
- Washing time of 100s.
- Rinsing happens for the next 20s.
- Finally, the dryer runs for the 50s.
- After all the processes have been completed turn on the finished LED.
BLOCKS USED:
- Statechart
- State
- Transition
- Constant
- Display
- Toggle Switch
- Slider Switch
- Lamp
- Check3 icon
- Ex4 icon
SIMULATION MODEL
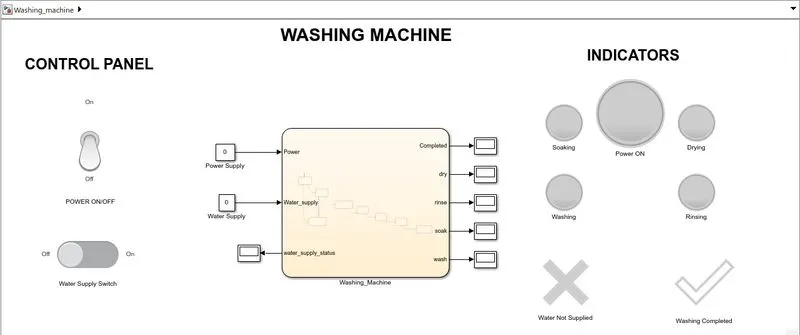
EXPLANATION
A Stateflow chart is used here to implement the control logic.
Power Supply and Water Supply are given as input data to the chart. Inside the chart, the first state is power check where the status of the power supply input is checked. It will move to the next state only if the supply is ON. Similarly, water supply status is checked in the second state. If the supply is OFF, a LED will indicate it, and if it is ON then the control moves to the next state.
Third state soaking is done and the LED indication for this state is given. After 200 secs the control will move to the fourth state that is washing. The LED indication for the same is also given. Then after 100 secs, the Rinsing state takes control. Then the last state, Dryer is done for 50 secs. Then the Stateflow is ended with a stop state.
Outside the Stateflow, all the LED indicators for each state are arranged under the Indicators label for easy identification. The Power and Water supply inputs can be controlled with the switches given under the Control Panel label. Once the whole process is completed, the washing completed LED will indicate it.
RESULTS
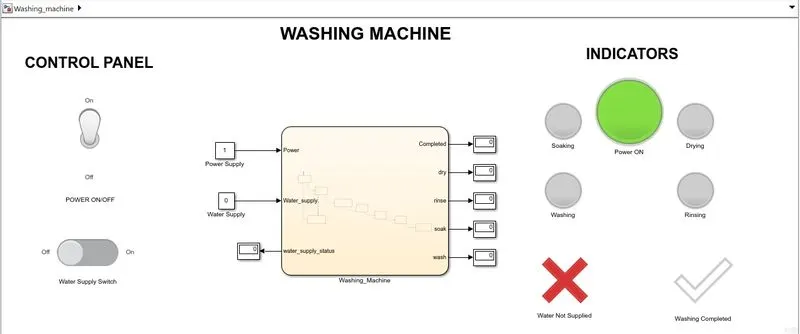
The above photo shows simulation indicating that the water supply is OFF through the red X LED.
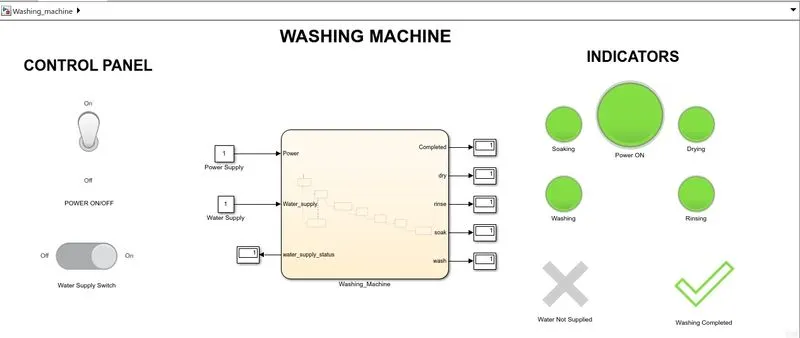
The above photo shows the completed simulation. The simulation model is attached below.
CONCLUSION
Control logic of a “washing machine” using Stateflow is successfully implemented.
2. GEAR SHIFT
AIM: Make a Simulink chart for the “Gear shift” logic.
OBJECTIVE: Select the gear as per the following conditions
Speed Range(kmph) Gear
0 to 15 1
16 to 25 2
26 to 40 3
41 to 60 4
Above 61 5
Should be able to give speed input while the simulation is running and the corresponding gear should be displayed.
BLOCKS USED:
- Stateflow chart
- Slider
- Circular Gauge
- Constant
- Display
- Lamp
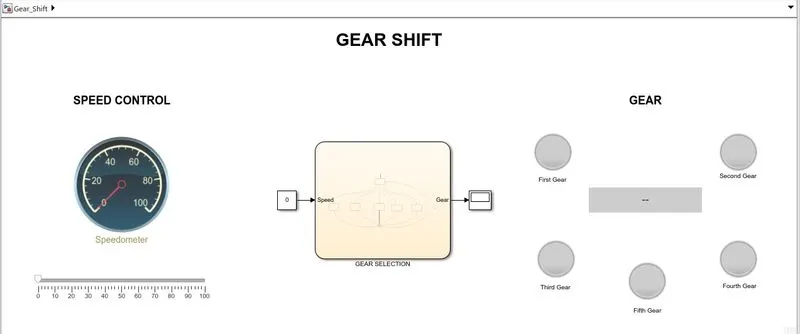
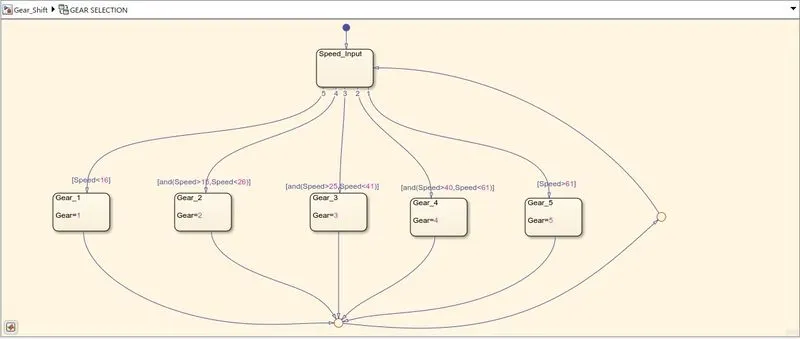
SIMULATION MODEL:
EXPLANATION:
A Stateflow chart is used here to implement the control logic.
Speed is given as input to the chart. The speed value can be selected through the slider and the gauge shows the speed chosen. In the chart, the first state analyses the speed input and passes control to the state based on transition conditions given for each state. Thus selecting the appropriate state and gear value by checking the speed. The control is then passed through a junction and back to the first state for analyzing the change in speed.
Outside the chart, display and lamps are arranged under the gear label for easy identification.
RESULTS:
The following pictures show the gear selection for different inputs of speed.
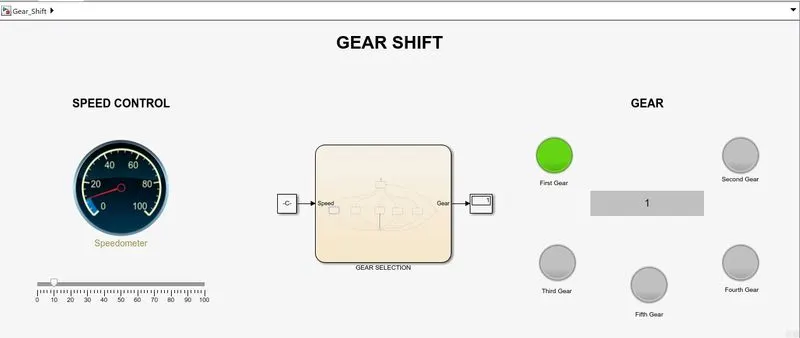
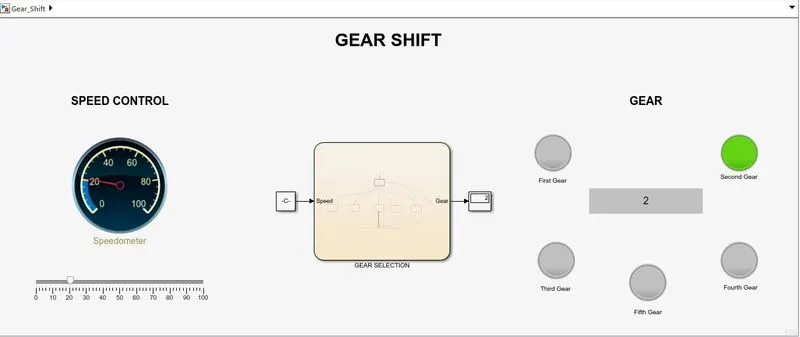
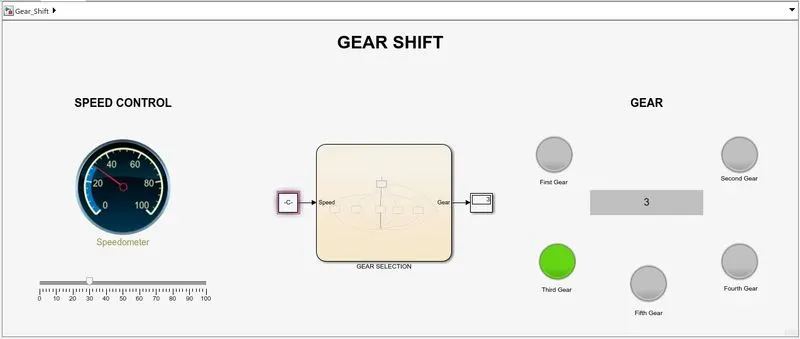
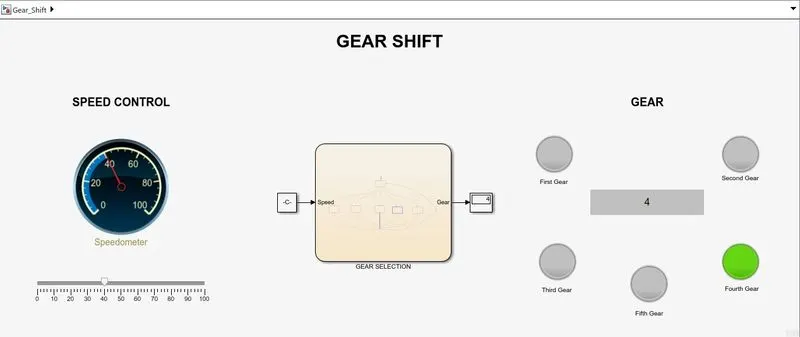
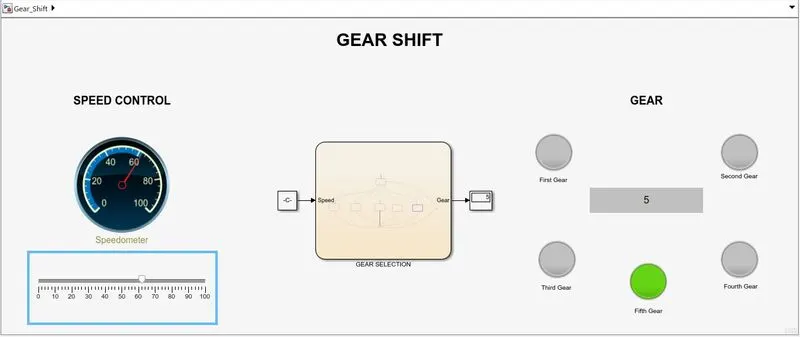
The simulation model is attached below.
CONCLUSION
Simulink chart for the “Gear shift” logic is successfully implemented.