Week - 4
AIM: Implement control logic of a “washing machine” using State flow as per the given sequence.
Objective:
- If the power supply is available, the system gets activated
- If the Water supply is not available, stop the process & indicate through LED
- Soaking time should be 200s followed by Washing time of 100s.
- Then rinsing happens for the next 20s & dryer runs for 50s
Washing Machine: The washing machine automatically takes in the amount of water and detergent required and it also automatically sets the timer for washing, rinsing, and drying as per the selected mode and the number of clothes.
Simulink model:
power supply
Water supply
Soaking time
Washing time
Rinsing
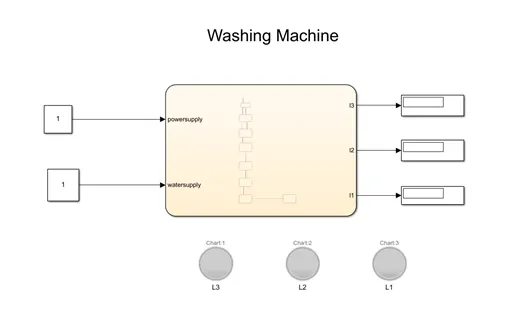
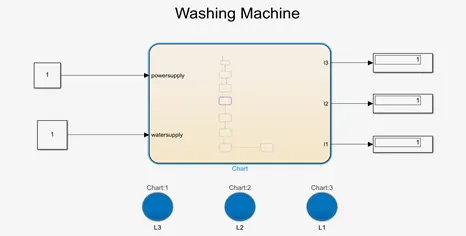
The above block diagram shows that it’s in off condition,
Initial state
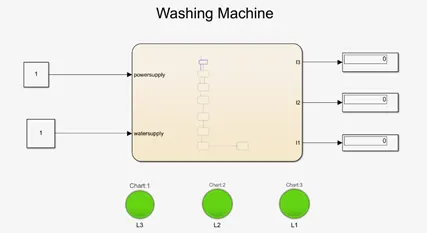
Power supply:
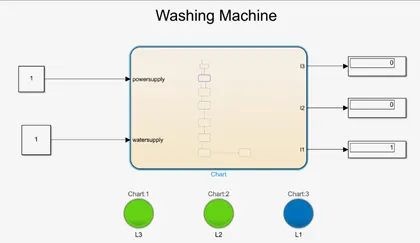
Water Supply:
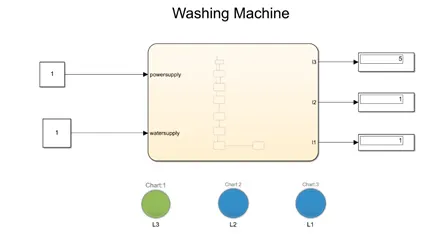
Soaking time:
Washing time:
Rinsing time:
Drying time:
Ending process:
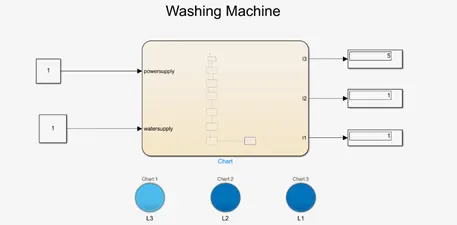
Name of the blocks:
2 Constant block - To output a constant enumerated value, consider using the enumerated constant block instead. The Constant block provides block parameters that do not apply to enumerated types, such as Output minimum and Output maximum.
Chart - A finite state machine is a representation of an event-driven (reactive) system. In an event-driven system, the system responds to an event by making a transition from one state (mode) to another. This transition occurs if the condition defining the change is true.
3 lamps- The Lamp block displays a color to indicate the value of the input signal. You can use the Lamp block with other Dashboard blocks to build an interactive dashboard of controls and indicators for your model. You can specify pairs of input values and colors to provide the information you want during the simulation.
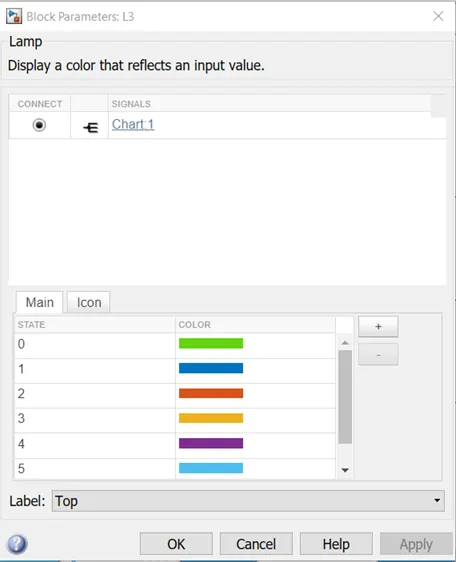
Displays: Show information about variables or results of the expression.
State flow chart:
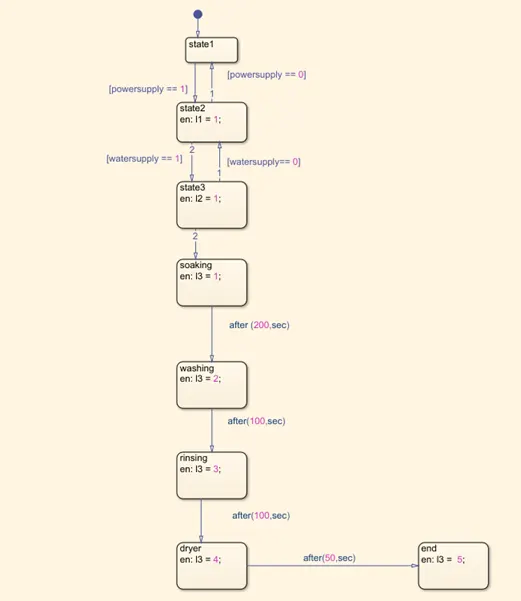
Procedure
- First, we have created a chart using 'CHART BLOCK' to define the logic of the washing machine.
- The first state is the 'Power state, this is where the program checks whether the power is ON/OFF. If the power is ON the process will go to the next state or else it will not go further. Here we have defined a variable 'P' as it will help us to indicate whether this particular state is going On or not.
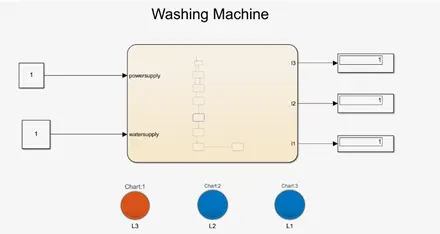
- Next, we have the 'Water' state where water will be filled, and similar to that of the power state we have defined variable 'W' which will help us to see whether is being filled or not. The process between 'Power State and Water State' is defined as if power is equal to one which means if power is on then only it water state will start, and power equal to zero refers as power is OFF then it will remain in power state only. 4. Now the next state is 'Soak State, this is where the clothes are soaked once the water is filled. Here we have defined inside this state that when it enters the state the value of variable 'S' will 1 which means that this state is going on. Once this state is over the process exits by a value 'S-0' which means now this state is not going on.
- Now next is the 'Wash State, this is where the clothes are washed, here as per the conditions mentioned above after 200s of soaking the washing state takes place. This condition is mentioned from between 'Soak State and Wash State
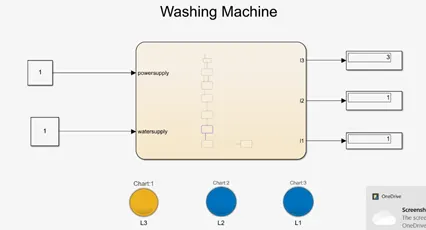
- Then, 'Rinse State' takes place where all the water is drained out, here when the state is in this state it will indicate 'R-1' once this state is over it will indicate 'R-O' and it will move next state. The process between 'Wash State' and 'Rinse State is defined as per the condition mentioned above.
- The next stage is the 'Dry State where the clothes are dried inside the machine. Similar conditions are defined in this state as in previous states. The process is defined as mentioned above.
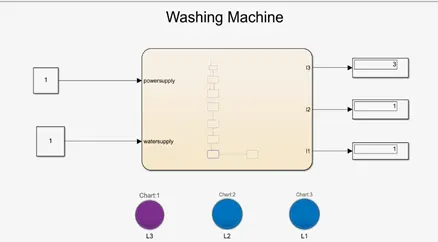
- The final state is the 'Finish state, this where the process ends and the power needs to be switched off manually. Here also similar conditions are mentioned,
- Now once the machine logic is created, we have defined the variables entered as output variables and power and water as inputs as these have to be provided to the machine in real-time.
- To give power and water input, we have used a 'Slider Switch Block' and 'Constant Block'. Each slider switch is connected to each constant block. When the slider switch is ON the value in a constant block will be 1 and this constant block is connected to the chart block where the washing machine program is defined.
Conclusion
Here, Power Switch & W(water supply) is as the input given while all others like Washing State, D(dryer), Wa(washing), S(soaking), R(rinsing). Washing Completed are all output given.
AIM: Make a Simulink chart for the “Gear shift” logic as per the below conditions.
Objectives:
Give speed input while the simulation is running & display the gear number.
Speed Range(kmph) Gear
0 to 15 1
16 to 25 2
26 to 40 3
41 to 60 4
Above 61 5
Transmission System:
The mechanism that transmits the power developed by the engine of an automobile to the engine to the driving wheels is called the TRANSMISSION SYSTEM (or POWER TRAIN).
Simulink model:
Block diagram
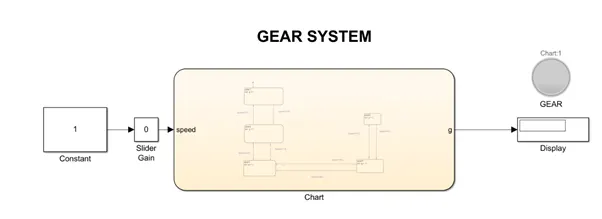
Name of block:
Constant – To output a constant enumerated value, consider using the enumerated constant block instead. The Constant block provides block parameters that do not apply to enumerated types, such as Output minimum and Output maximum.
Chart - A finite state machine is a representation of an event-driven (reactive) system. In an event-driven system, the system responds to an event by making a transition from one state (mode) to another. This transition occurs if the condition defining the change is true.
A State flow chart is a graphical representation of a finite state machine. States and transitions form the basic elements of the system. You can also represent stateless flow charts.
For example, you can use state flow charts to control a physical plant in response to events such as temperature and pressure sensors, clocks, and user-driven events.
Display -
Lamp - The Lamp block displays a color to indicate the value of the input signal. You can use the Lamp block with other Dashboard blocks to build an interactive dashboard of controls and indicators for your model. You can specify pairs of input values and colors to provide the information you want during the simulation.
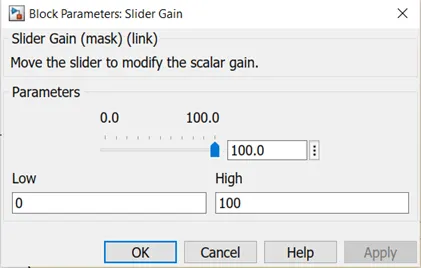
Slider gain - The Slider Gain block performs a scalar gain that you can modify during simulation. Modify the gain using the slider parameter.
This block is one of the main blocks that represents the speed ratio, and also gear shift timing.
Chart - A finite state machine is a representation of an event-driven (reactive) system. In an event-driven system, the system responds to an event by making a transition from one state (mode) to another. This transition occurs if the condition defining the change is true.
A State flow chart is a graphical representation of a finite state machine. States and transitions form the basic elements of the system. You can also represent stateless flow charts.
For example, you can use state flow charts to control a physical plant in response to events such as temperature and pressure sensors, clocks, and user-driven events.
Display -
Lamp - The Lamp block displays a color to indicate the value of the input signal. You can use the Lamp block with other Dashboard blocks to build an interactive dashboard of controls and indicators for your model. You can specify pairs of input values and colors to provide the information you want during the simulation.
Slider gain - The Slider Gain block performs a scalar gain that you can modify during simulation. Modify the gain using the slider parameter.
This block is one of the main blocks that represents the speed ratio, and also gear shift timing.
Slider Gain block parameter’s
State flow chart:
State flow provides a graphical language that includes state transition diagrams, flow charts, state transition tables, and truth tables. You can use State flow to describe how MATLAB® algorithms and Simulink® models react to input signals, events, and time-based conditions.
State flow enables you to design and develop supervisory control, task scheduling, fault management, communication protocols, user interfaces, and hybrid systems.
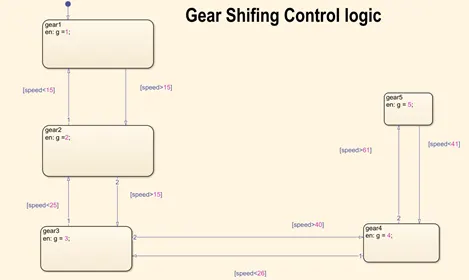
given data:-
- 1st gear-(0-15kmph)
- 2nd gear-(15-25kmph)
- 3rd gear-(25-40kmph)
- 4th gear-(40-60kmph)
- 5th gear-(greater than 60kmph)
1st gear
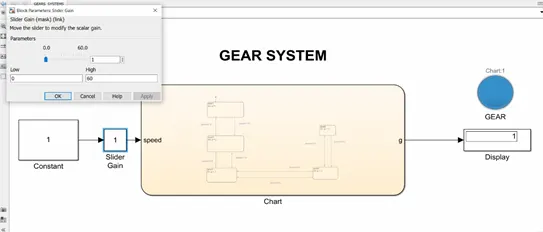
In 1st gear, the engine makes 2.97 revolutions for every revolution of the transmission's output.
2nd gear
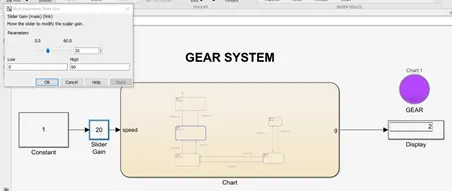
Second gear works just like the first gear, except you should only enter second gear once you're done with the first.
3rd gear
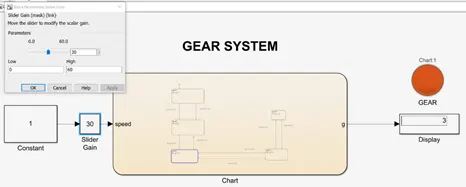
This is another way of saying that gear A rotates 3 times while gear B rotates 1 time. It's the same as saying the gear ratio is 3:1. If we know the number of times gear A rotates, we can divide that number by 3 to find the number of times gear B rotates.
4th gear
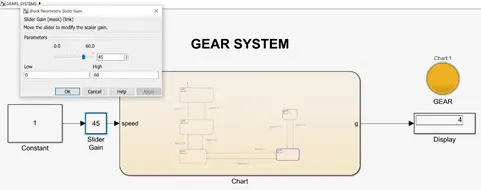
When the gear ratio is 1:1, the amount of torque is the same, and the speed is the same. However, as soon as you increase the gear ratio (1:4, for example), you're going to cut the amount of torque but significantly increase the amount of speed.
5th gear
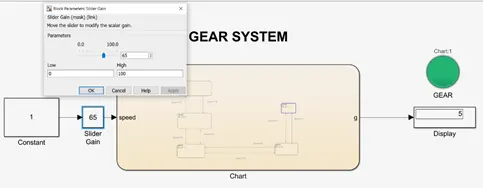
If you're trying for high efficiency, do so at only a little higher speed than when you shifted up into 4th (60KM/H is about right for a 4-to-5 shift point for flat, level roads in good condition)
procedure:
- At the initial position, the slider is at O.
- when we increased the speed, the input is given to the state flow chart where it checks the input speed and displays the gear number.
- according to the given data the range of the first gear is 0-15kmph.
- the range of the second gear is 15-25kmph.
- the range of the third gear is 25-40kmph.
- the range of the fourth gear is 40-60kmph.
- the range of the fifth gear is greater than 60kmph.
Conclusion: From the output, we can say, that the gear shifting takes place according to the given speed input.