Week - 4
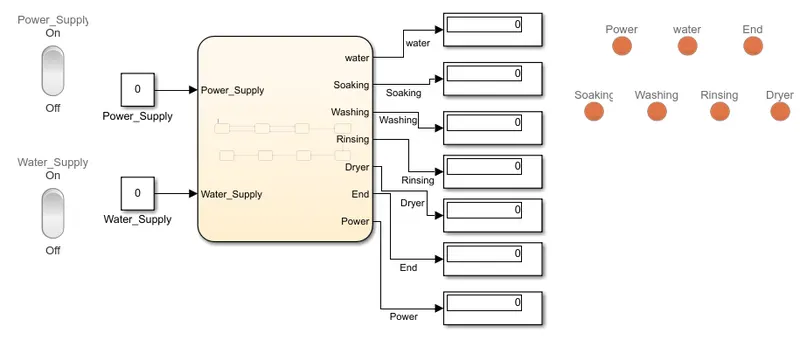
Answer 1: The control logic of a washing machine is implemented using stateflow and is attached as Washing_Machine.slx
The below image is the model developed and works as follows, the indications represent the respective status. Green indicates that paticular process or condition is on. Red indicates that particular process or condition is off.
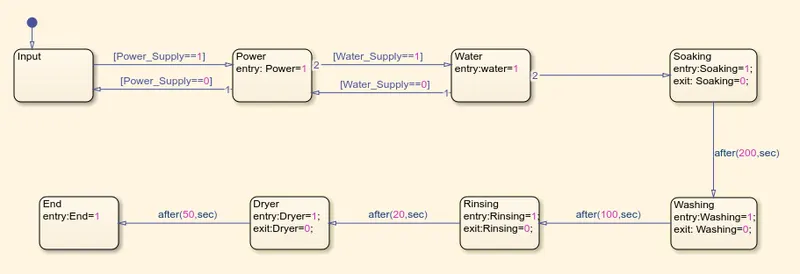
The below image is the chart or the logics defined,
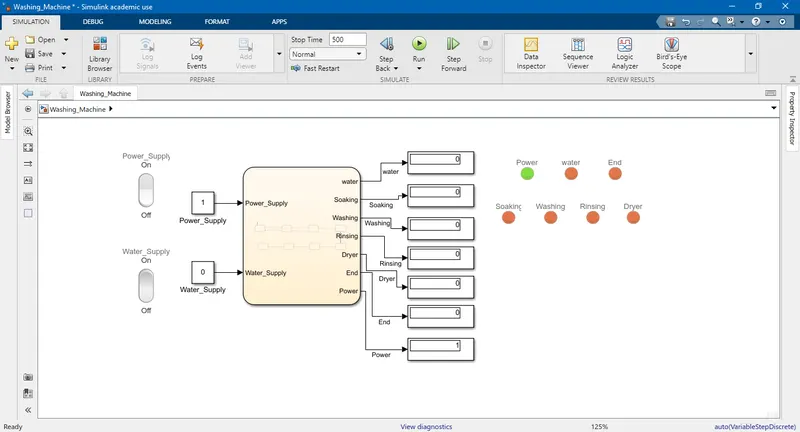
The below image is the result when Power_Supply is on and Water_Supply is off. When the water supply is off the process stops there and donot move forward.
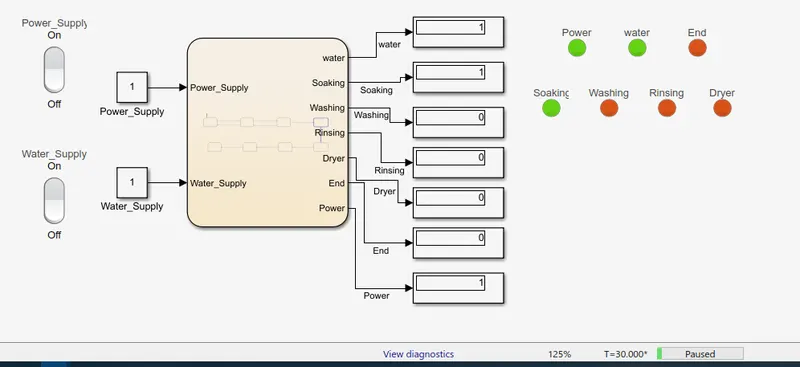
The below image shows when the power supply and water supply are both on and after a time period of 30sec the display are as shown below,
The same process is continued and after time period of 500sec the display is as shown below,
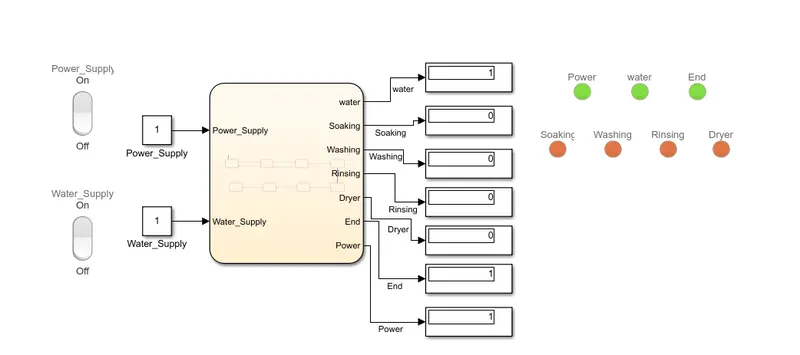
These above all images show that the required logic is met and the working is succesful.
Answer 2: The simulink chart for the gear shift logic as given below is designed and attached as Gear_Shift.slx
Speed Range(kmph) Gear
0 to 15 1
16 to 25 2
26 to 40 3
41 to 60 4
Above 61 5
The speed input is given to the chart through a slider block so it can be varied during the running of simulation and as the speed varies the gear display value changes according to the logic mentioned above. The below image attached shows the speed and gear display
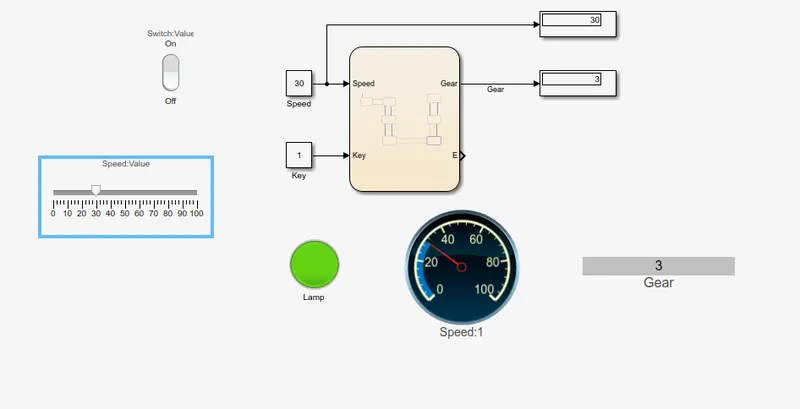
Since the speed is 30 so the gear displayed is 3. The lamp will be green if the key is on and red if key is off.
The below image shows the chart logic for the same.
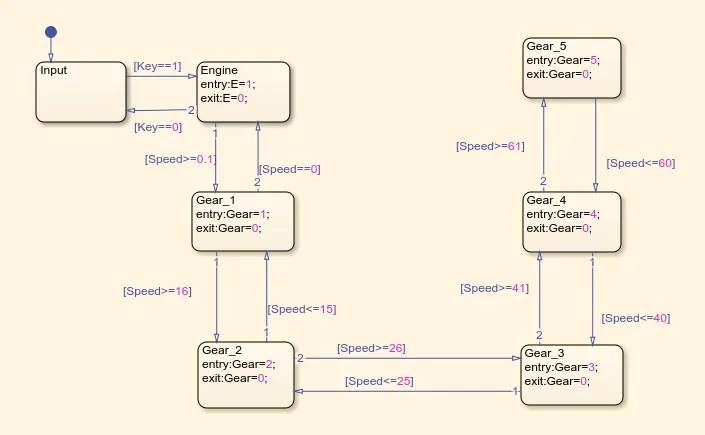
Thus with above said results it can be seen that the gear shift logic given is achieved using chart in simulink.