SIMULATION OF CONTROL LOGIC OF A WASHING MACHINE AND GEAR TRANSMISION USING SIMULINK
SIMULATION OF CONTROL LOGIC OF A WASHING MACHINE AND GEAR TRANSMISION USING SIMULINK
Aim: To implement control logic of washing machine and Gear transmission using state-flow
Objectives:
- To implement control logic of a washing machine
- To make a simulink chart for Gear shift
Platform Used
MATLAB - SIMULINK
Generate A Simulink Model And Implement Control Logic Of A Washing Machine Using Stateflow
A washing machines cycles has one or more programs from which we can choose, operations like soak, wash, rinse, dry and which can done with our desired time.
The following operations are performed
- Soaking – 200 sec
- Washing – 100 sec
- Rinsing – 20 sec
- Dryer - 50 sec
And initially the availability of water is also checked.
Main Blocks used
- Constant
- Slider switch
- Led / lamp
- Chart – stateflow
- Mux
- Display
Simulink model
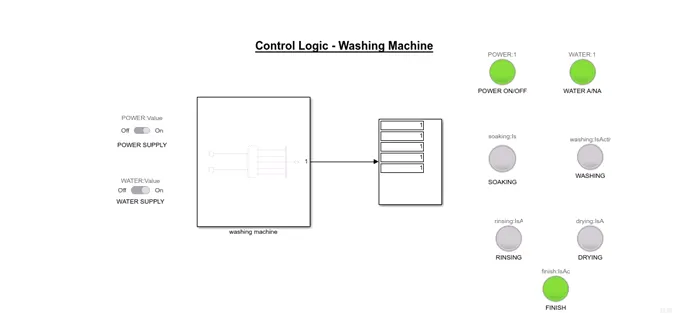
SUBSYSTEM – Washing machine
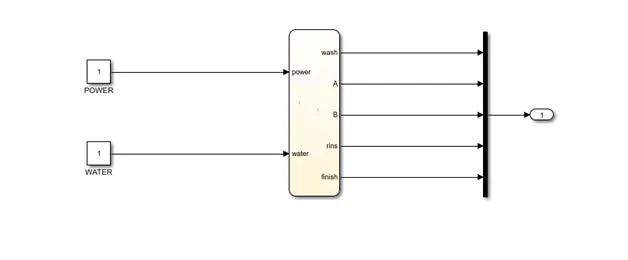
STATE FLOW
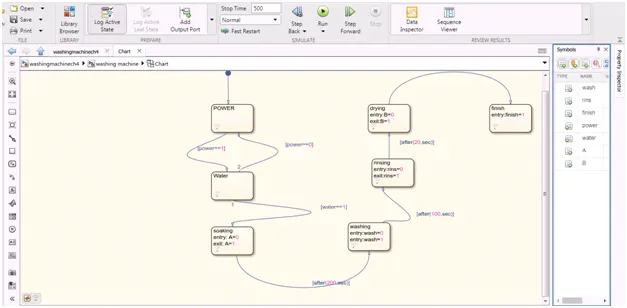
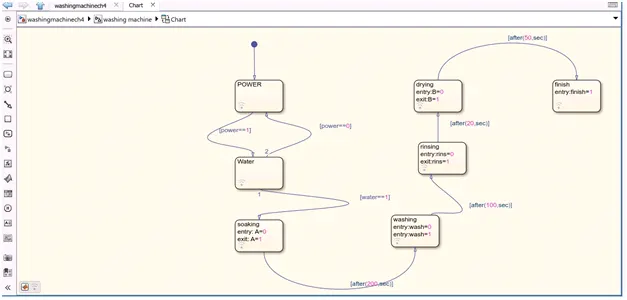
Overall Methodology
- State flows power check, water availability check, soaking, washing, rinsing, drying and finish are implemented
- Entry and exit condition is defined as ‘1’ & ‘0’.
- The full flow of the state is set as, only if power and water value equals to “1” which is hints the availability of power and water source
- And the next states are controlled by the duty or delay, 200 sec, 100 sec, 20 sec, 50 sec by the respective states
- The total time period required to complete washing machines process is 370 sec so sampling time is set above 370 sec
- The LEDs are connected to indicate when the respective processes are running, power and end/finish of the process.
- Slider switch is connected to control the power and water source.
- LEDs and results on Display gives a better understanding of the state flow
Condition Check
- Power ON
- Water Available
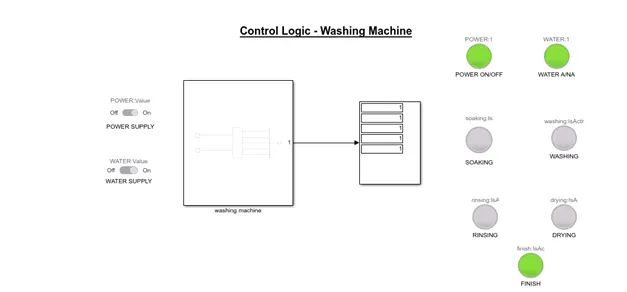
State flow successfully completes every state and finish LED turns ON
Condition check – soaking (0-200sec ) for checking sampling time is set to 199 sec
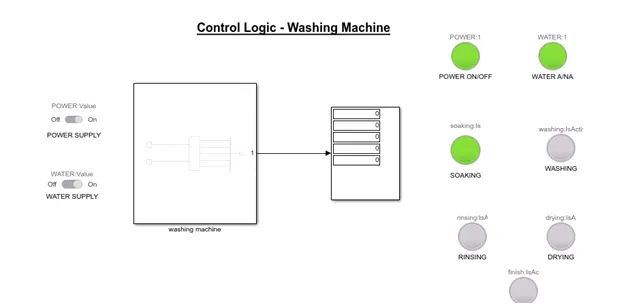
Soaking is executing as the LED indicated
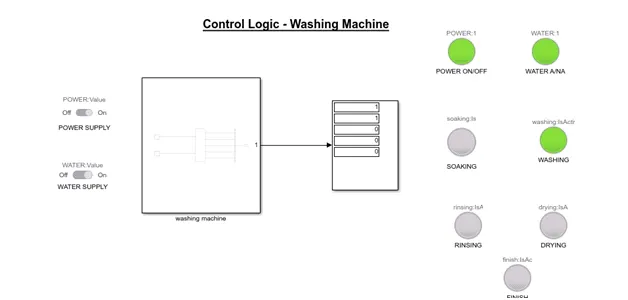
Washing state : T= 200-300 SEC
Rinsing state
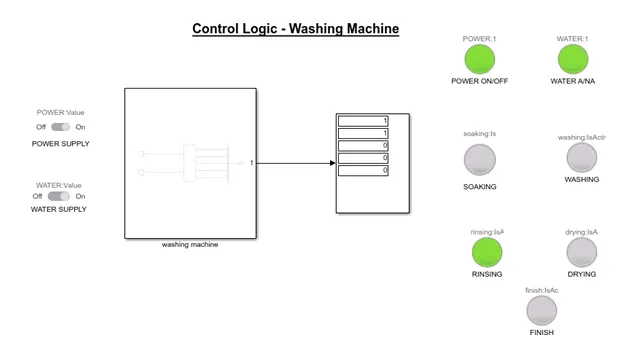
Drying state
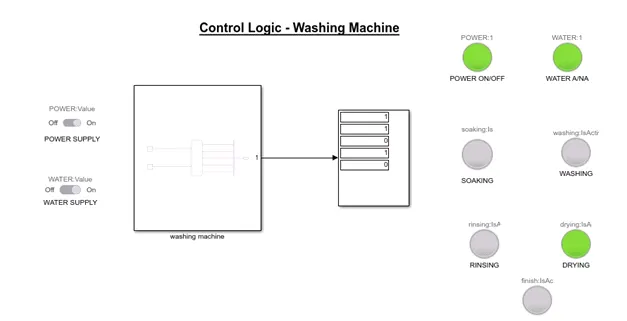
When water is not available
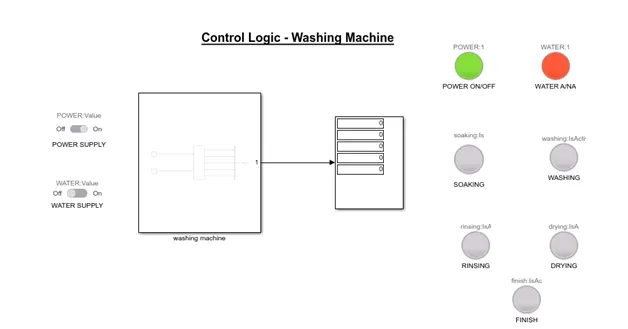
When water is not available, washing machine indicates the ‘water not available’ as LED turns red
Conclusion
The simulation of washing machine control logic is successfully implemented
TO GENERATE A SIMULINK CHART OF A GEAR SHIFT ACCORDING TO INPUT SPEED
An automatic transmission is multi speed transmission used in motor vehicles that does not require any driver input to change the gears under normal driving conditions.
Operation criteria
- 1st gear - 0 to 15 kmph
- 2nd gear - 16 to 25 kmph
- 3rd gear - 26 to 40 kmph
- 4th gear - 41 to 60 kmph
- 5th gear - above 61
Main blocks used
- Constant
- Circular guage - used as speedometer
- Slider gain – used as accelerator
- State chart
- Mux
- Display
Overall Methodology
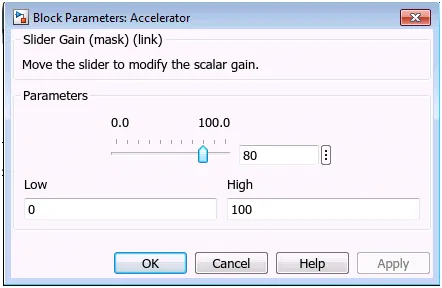
- Slider gain is used as the accelerator which is has a limit of 100 and a constant is connected to the input
- The state chart is implemented to meet our requirements that, when the 1st gear state is activated when the speed is 0-15 kmph, 16-25 for 2nd gear, 26-40 for 3rd, 41-60 for 4th gear, above 61 for 5th gear and vice versa when the speed decreases.
- The accelerator / slider gain is manually controlled. So that while running the process we have to change the gain value. So the sampling time is set to infinite ‘inf’.
- Speedometer shows the speed and display act as a gear position indicator.
Simulink Model
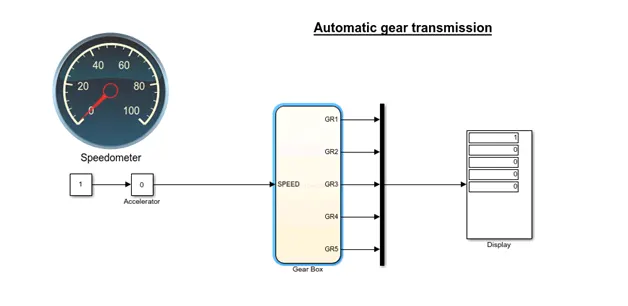
State flow chart
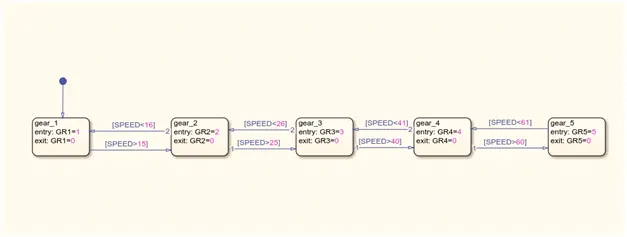
1ST GEAR
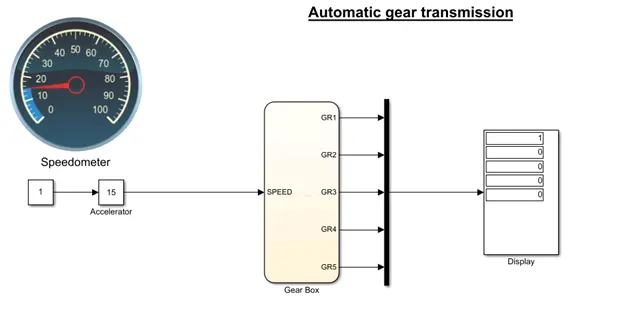
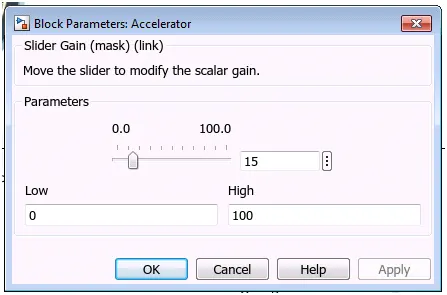
When the speed is between 0-15, it runs on the first gear
2ND GEAR
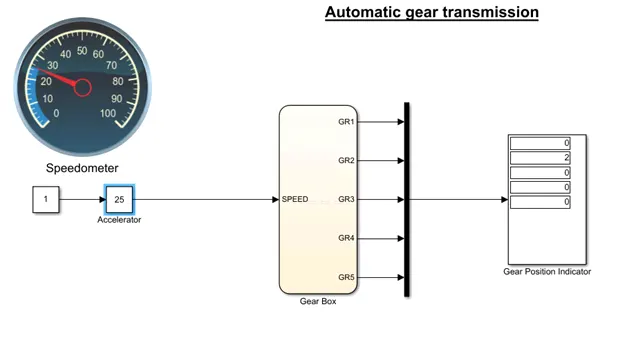
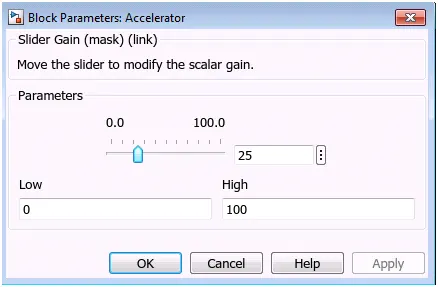
When speed is 16-25, the gear is shifted to 2nd gear
3RD GEAR
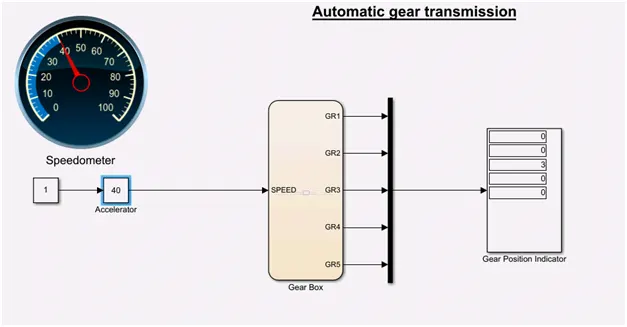
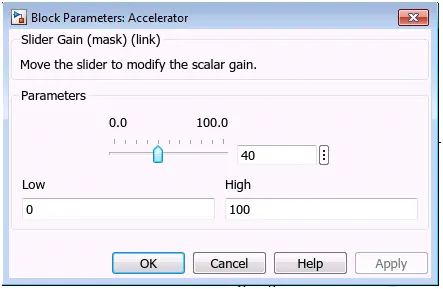
When speed is 26-40, the gear shift from 2nd to 3rd gear.
4TH GEAR
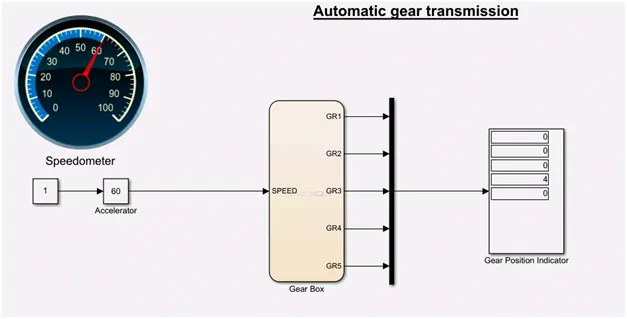
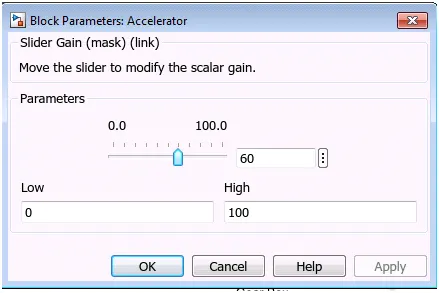
When speed 41-60, the gear shifts from 3rd gear to 4th gear
5TH GEAR
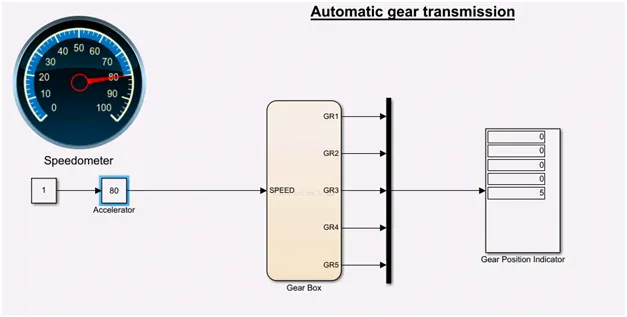
When speed is above 61, the gear shifts to 5th gear.
The gear shift is carried out when speed decreases also. The gear position is indicated in the display.
RESULT
SPEED VS GEAR SHIFT
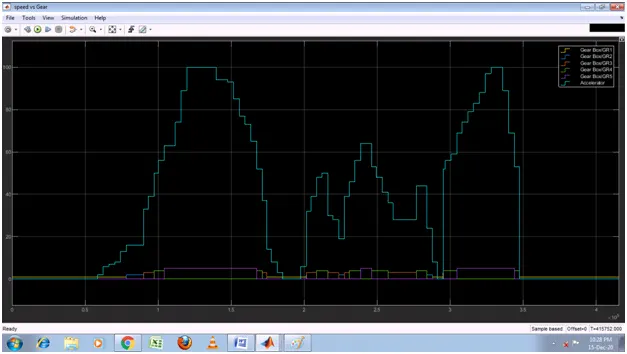
From the speed vs Gear shift graph , we can conclude that the gear is shifted with respective to the speed.