Week 4.1 - Solving second order ODEs
FUNCTION CODE TO SOLVE SECOND ORDER ODE:
function [dtheta_dt] = solve_pend(time, angle, daming_coefficent, gravity, length_of_pendulum, mass_of_pendulum)

theta1=angle(1); %the actual theta angle

theta2=angle(2); %angular velocity

dtheta1_dt=theta2; %this shows that theta2 is angular velocity in rad/s

dtheta2_dt= -(daming_coefficent/mass_of_pendulum)*theta2 - (gravity/length_of_pendulum)*sin(theta1);
%this shows that dtheta2_dt is angular acceleration in rad/s^2

%thus the matrix notation is
dtheta_dt=[dtheta1_dt;dtheta2_dt];

end
ACTUAL CODE:
close all
clear all
clc

%inputs
b=0.05; �mping coefficient
g=9.81; �eleration due to gravity in m/s^2
l=1; %length of pendulum in meters
m=1; %mass of pendulum in kg

%initial conditions
w=3; %angular velocity at t=0
theta0=[0;w]; %where 0 is inital angle in radian and  is initial angular velocity in rad/s

%time span to be integrated along
t_span=linspace(0,20,616); %where 616 is number of frames being captured in M
%I found this value by trial and error. when frames is 1200 the video was
9 seconds, even though it is thea nimation of first 20 seconds, the video
%was kind of slowed, so dividing it by 39 seconds and multiplying with 20
%seconds we get 615.38 (rounded up to 616), thus at this number of divisions in linspace
%command we can get the actual video to be of 20 seconds as well, this the
%animation will be at 1x speed

[t,results]=ode45(@(t,theta) solve_pend(t, theta, b, g, l, m),t_span,theta0);

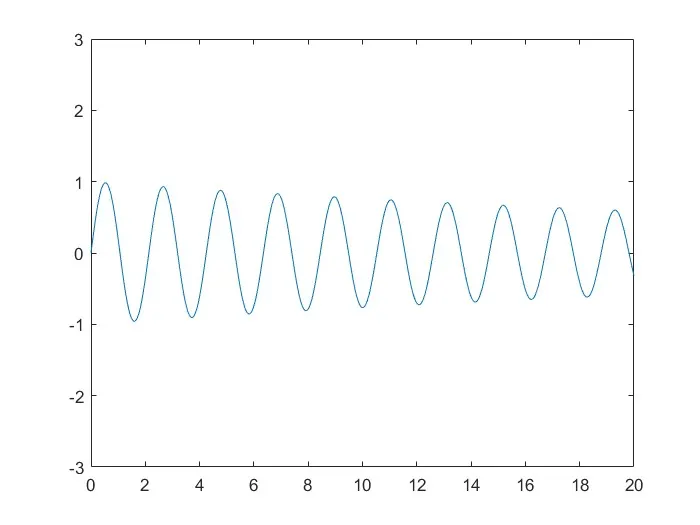
%plot showing how theta changes with time
figure(1);
plot(t,results(:,1))
axis([0 20 -3 3])


%we can represent the bob of the pendulum in cartesian co-ordinate by the following [l*sin(theta) , l*cos(theta)]
%animation coding
figure(2)
ct=1;
for i = 1 : length(t_span)

% to show the motion and the y-coordinate of the pendulum bob is negative, since it is hanging down
%x-coordiante of pendulum bob is positive, because I want motion to start towards the right
 plot([0 (l)*sin(results(i,1)) ] , [0 -(l)*cos(results(i,1))],'LineWidth',2)
 hold on;
 plot([-1 1] , [0 0],'k', 'LineWidth', 3) %to indicate from where the pendulum is hanged
 plot((l)*sin(results(i,1)), -(l)*cos(results(i,1)), 'o', 'LineWidth', 6) %to plot the pendulum bob
 hold off;
 axis([-1 1 -1.25 1]);
 M(ct)=getframe(gcf);
 ct=ct+1;
end

movie(M) %plays in the movie frames in the structure M
videofile = VideoWriter('pendulum.avi','MPEG-4'); %VideoWriter creates a file to write video into
open(videofile)
writeVideo(videofile,M) %writes the frames in structure M into the file named videofile
close(videofile)
SCREENSHOT OF CHANGE IN ANGLE WITH RESPECT TO TIME (0 to 20 seconds):
ANIMATION:
<video controls="controls">