Week 4.1: Project - Steady state simulation of flow over a throttle body
Aim:
In this project we run a steady state simulation of air over a throttle body using converge cfd and post process the results.
Theory:
A throttle is used to control the amount of fluid flowing.The throttle in open position allows the full passage of fluid whereas a throttle in closed position is used to hinder the flow of fluid . The throttle valve can be rotated at various angle depending on the amount of fluid to flow through.
Throttles are mainly used to control the amount of power by regulating the amount of fluid passage eg:Turbines,ICE
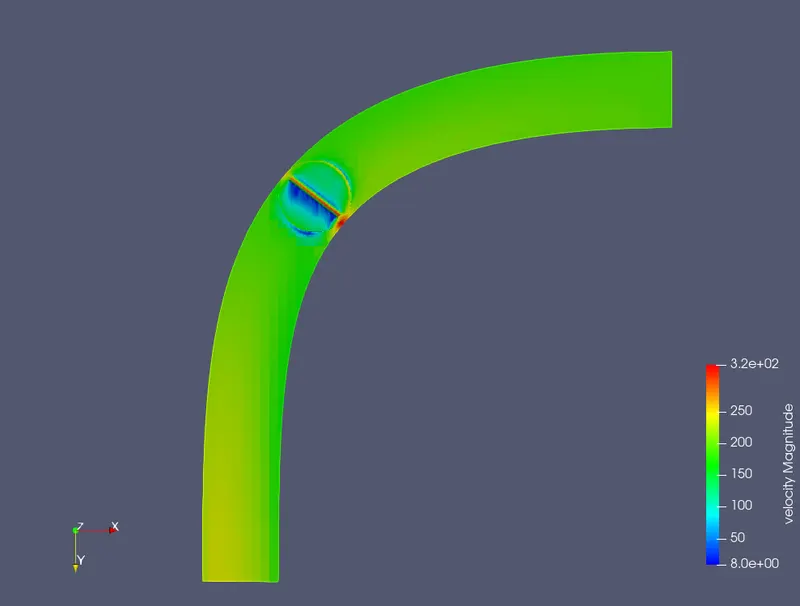
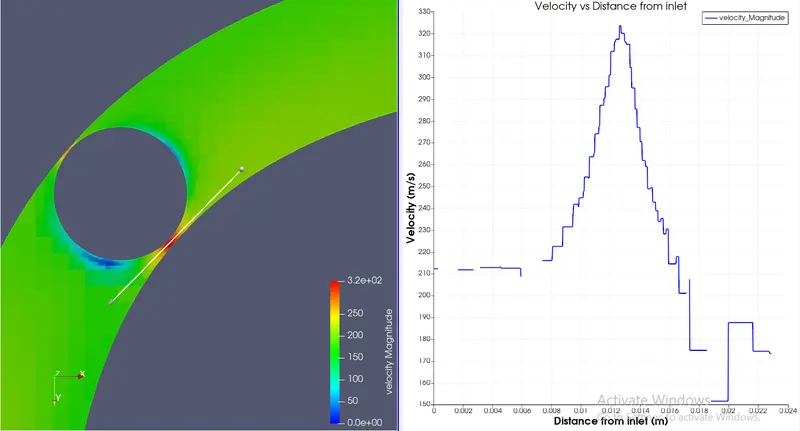
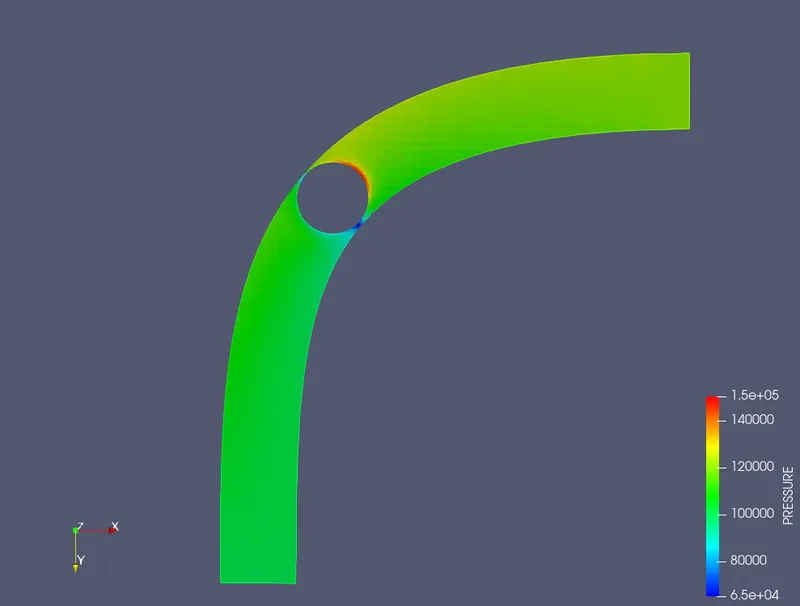
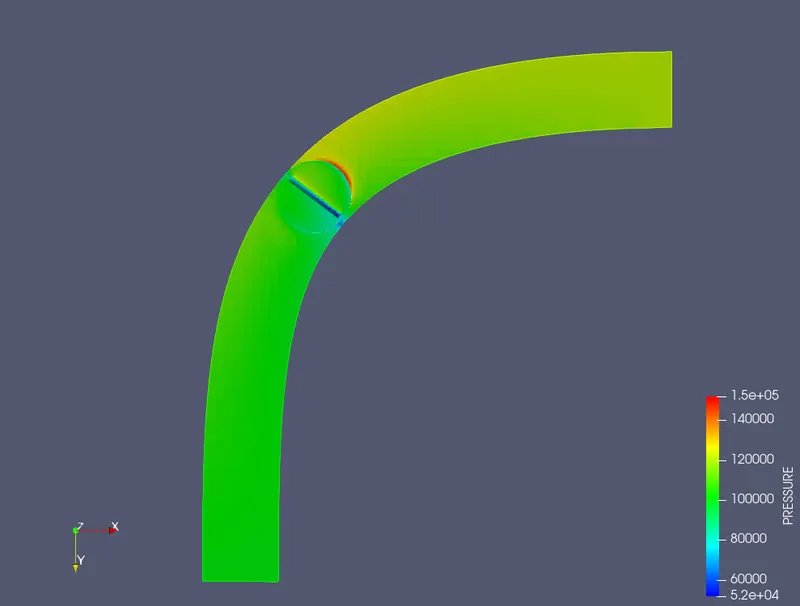
In a flow thorugh a throttle some the fluid may flow under the throttle through the contriction created between the throttle and elbow walls. In this case the flow follows a venturi flow where the velocity increases with a decrease in static pressure.This follows the bernoullis theorem which states that with an increase in kinetic energy the pressure energy decreases and vice versa.

Flow seperation also occurs when the fluid encounters the throttle and has to flow over it.This produces a low velocity region downstream of the throttle a characteristic of flow seperation.
1. Geometry:
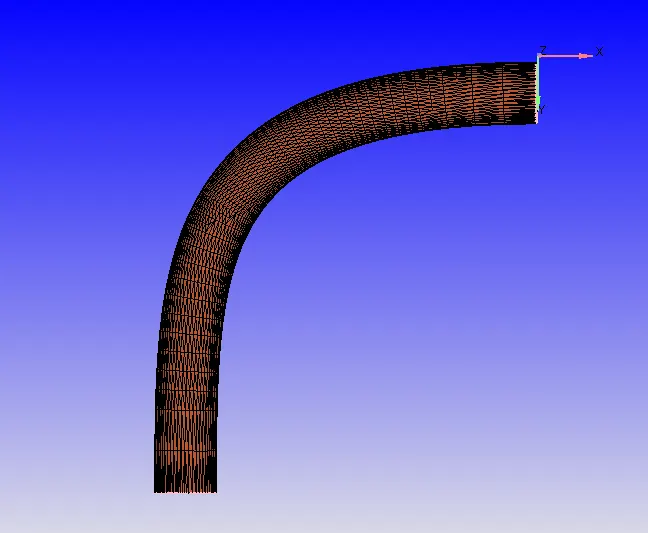
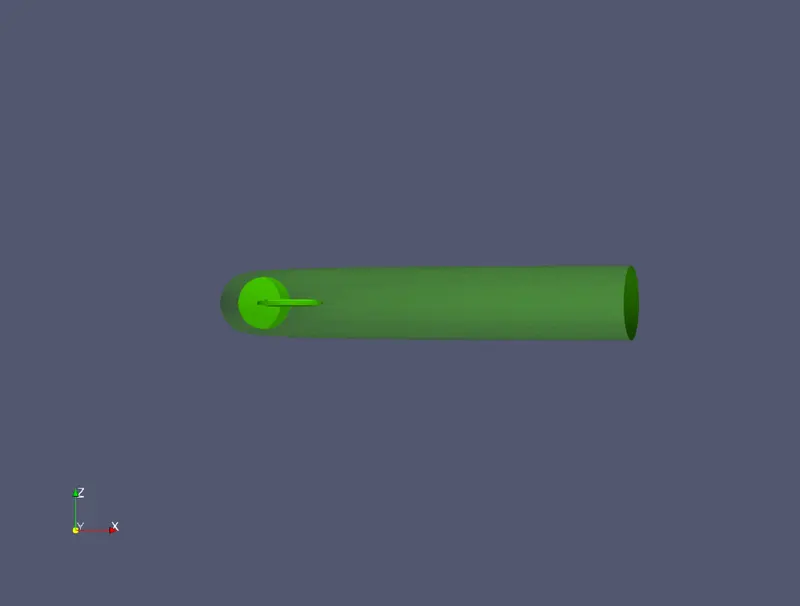
The geometry is imported as a .stl file into converge.
1.1 Boundary Flagging
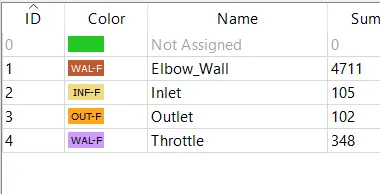
The required boundaries are flagged
Case Setup:
1. Materials
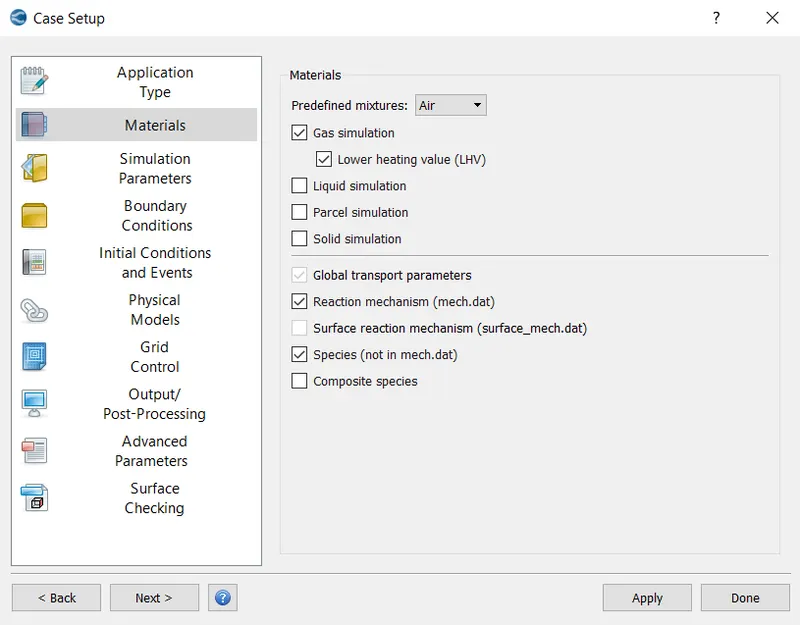
The predefined mixture is selected to be air.
2. Simulation Parameters
2.1. Run Parameters
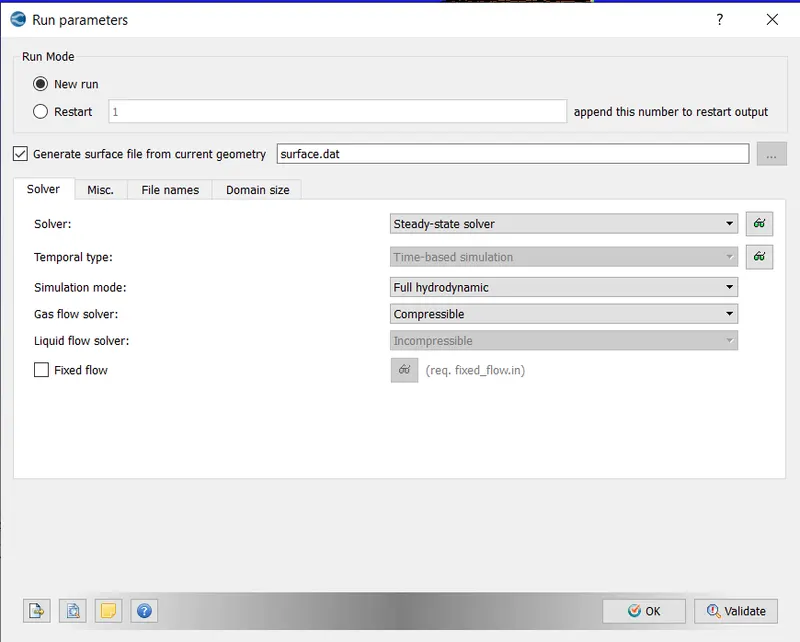
The solver type is chosen as steady state and simulation mode is full hydrodynamic
2.2 Steady State Monitor
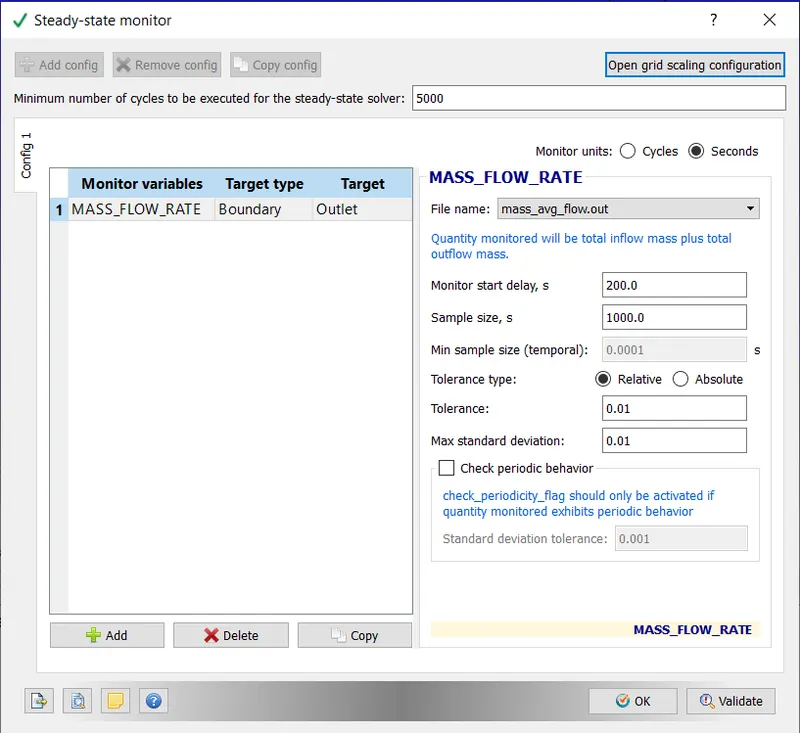
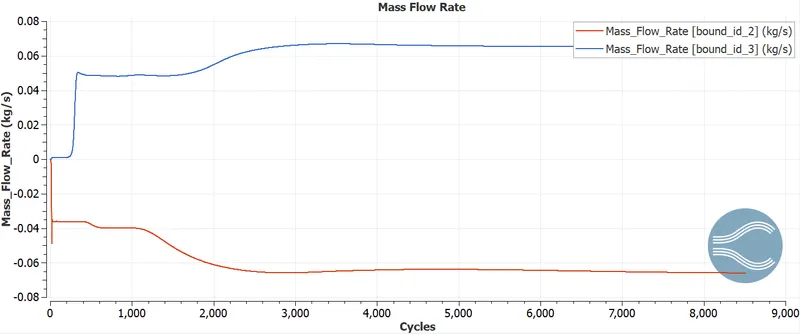
The mass flow rate at outlet is monitored for convergence
2.3 Simlulation Time Parameter
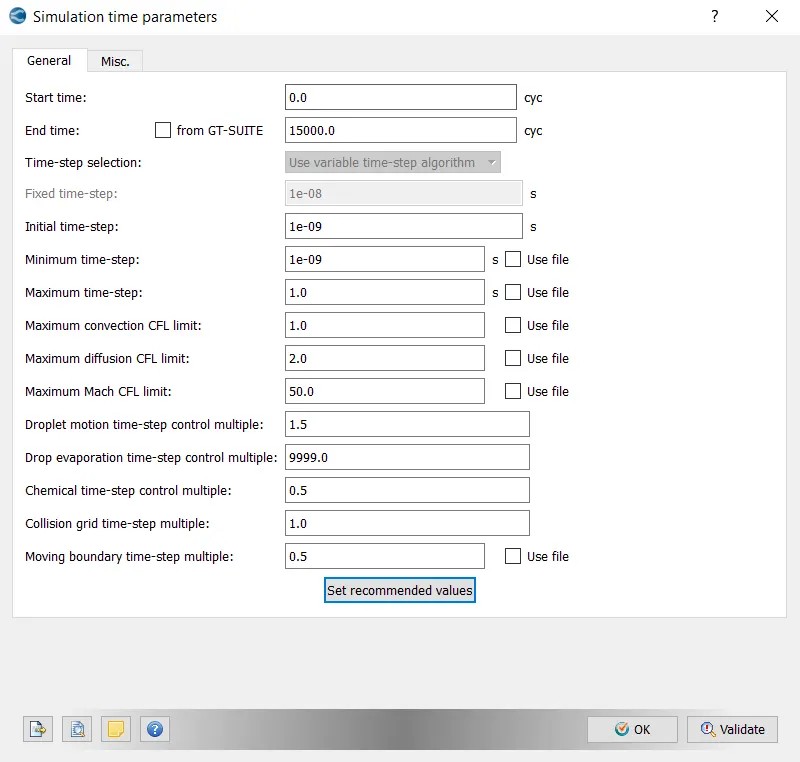
Since it is a steady state simulation, time is taken in cycles.
2.4 Solver Parameters
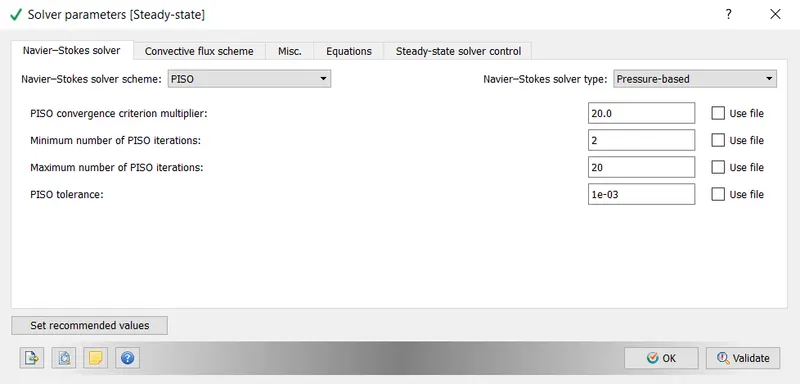
Solver type is chosen to be pressure based
3. Boundary Conditions
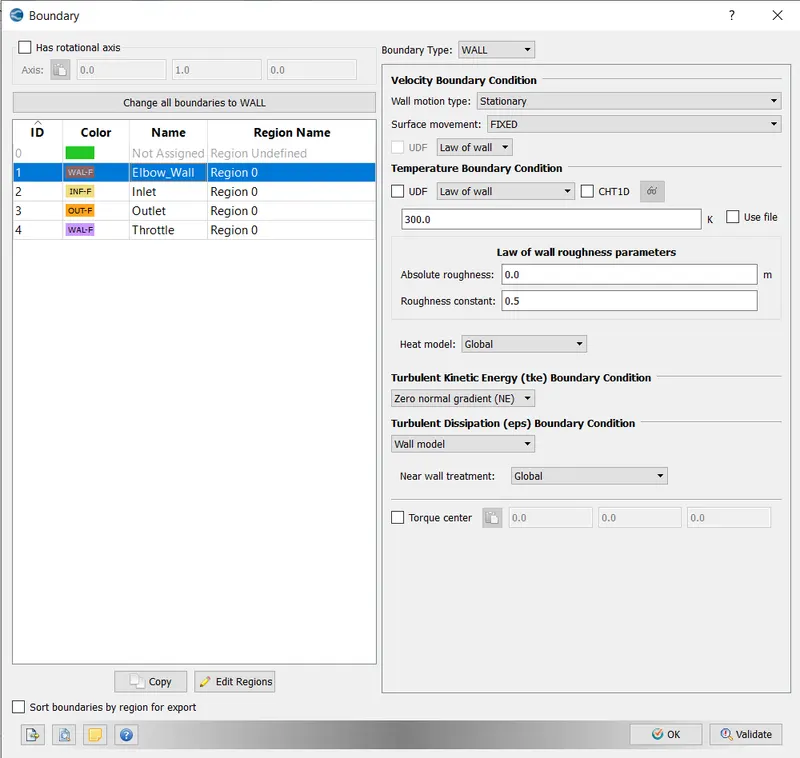
The boundary conditions for the different boundaries Inlet , Oulet,Elbow wall & Throttle are given. Inlet and outlet pressure are specified and the throttle's surface movement is stationary.
4. Regions and Initialization
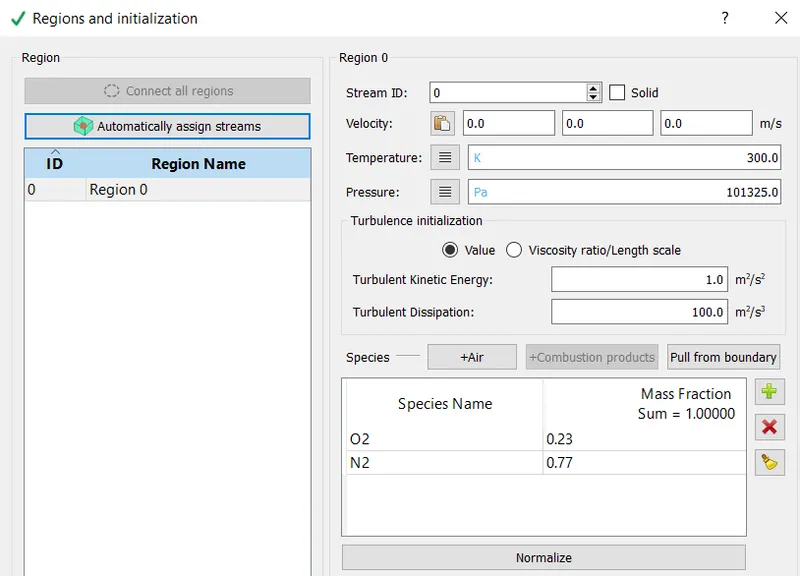
The region is defined containing mixture of air and inital values of pressure and temperatures are specified
5.Physical Model
The turbulence model of RANS_K_EPS_RNG is used
6.Grid Control
6.1 Base Grid
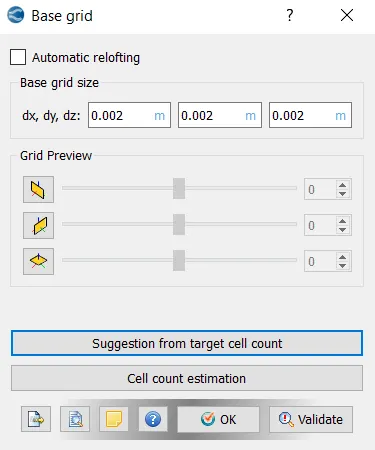
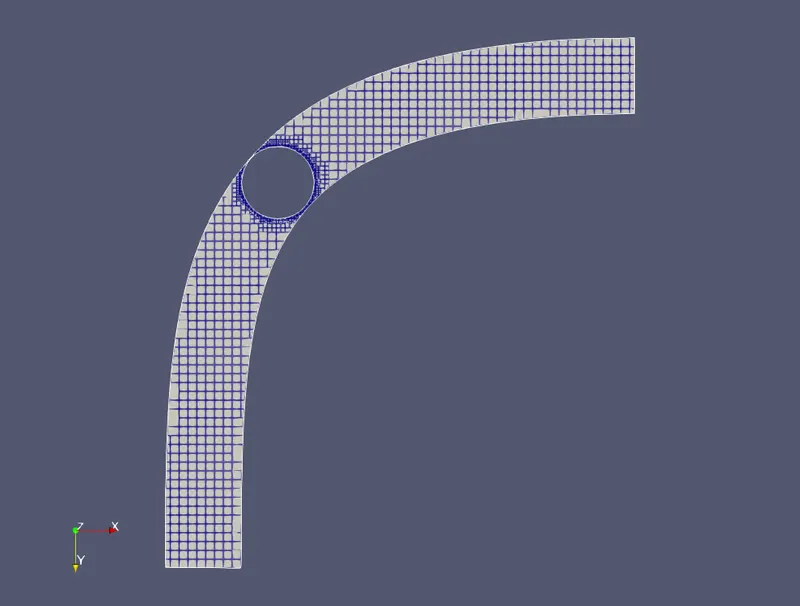
A size of 2mm is used as a base grid
6.2 Fixed embedding
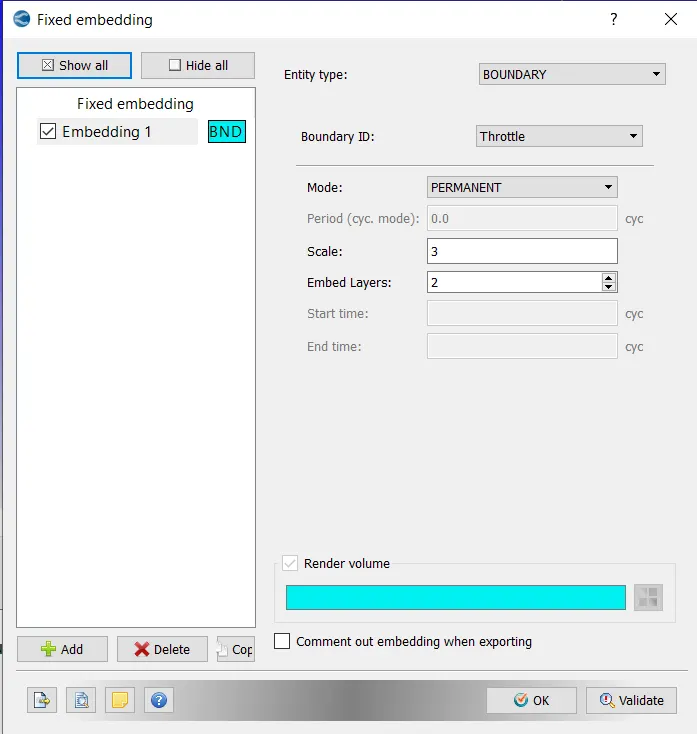
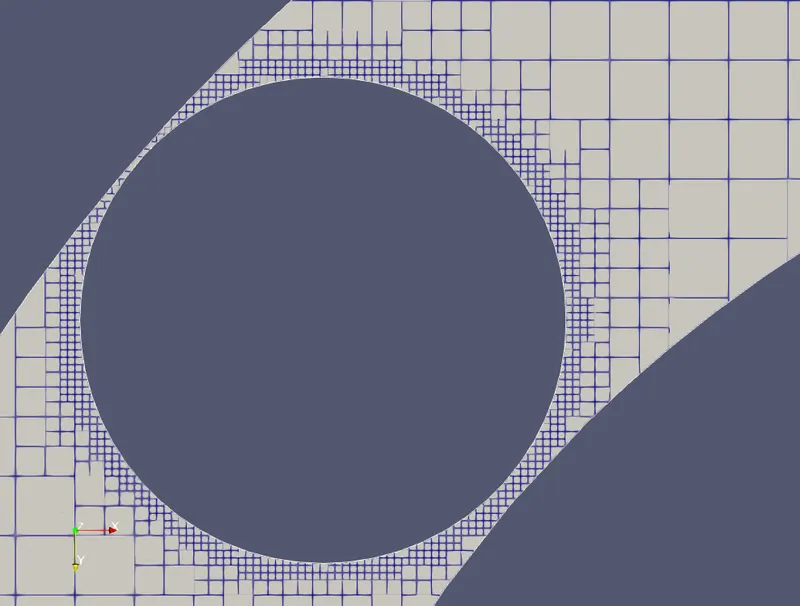
Around the throttle boundary a embedding of scale 3 is used.
Scale defines the level of refinement for embedding. Represents the value of n in dx_base/2^n.
Post Processing
The post processing of results is done using paraview package.
1.Front View
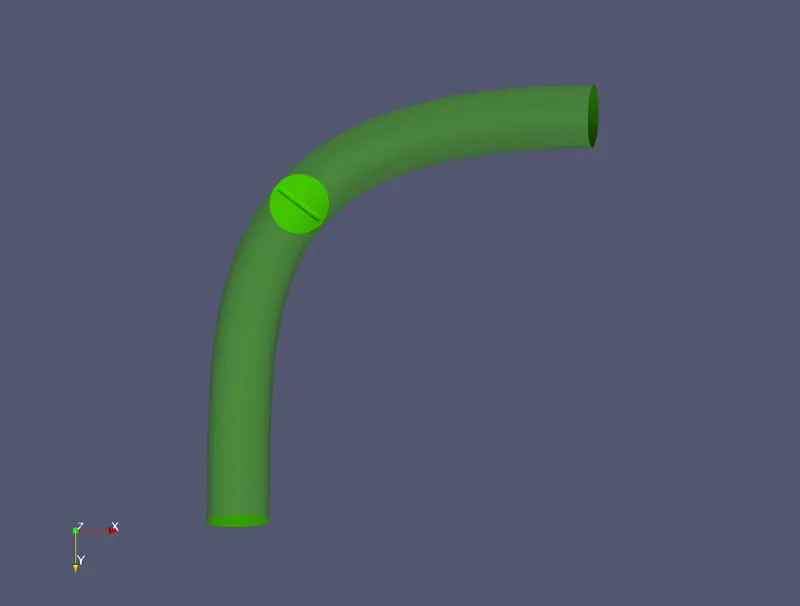
2.Top View
Grid
Velocity Contour
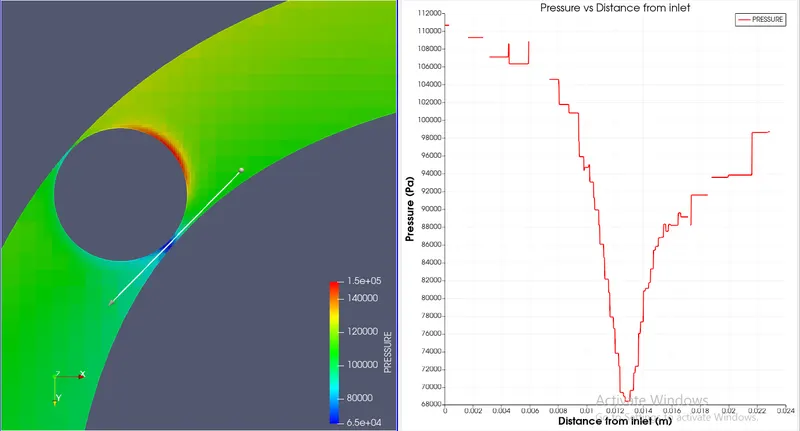
Pressure Contour
Converge Plots
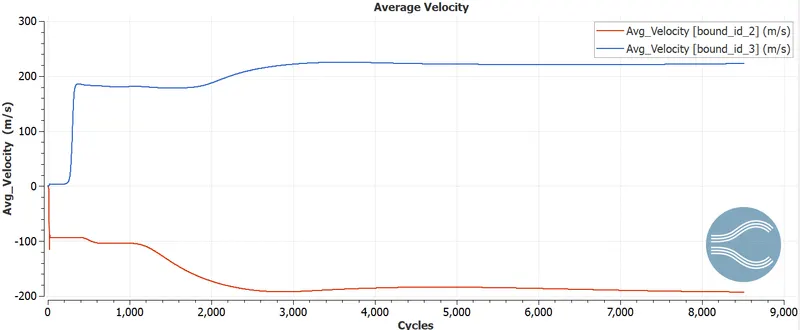
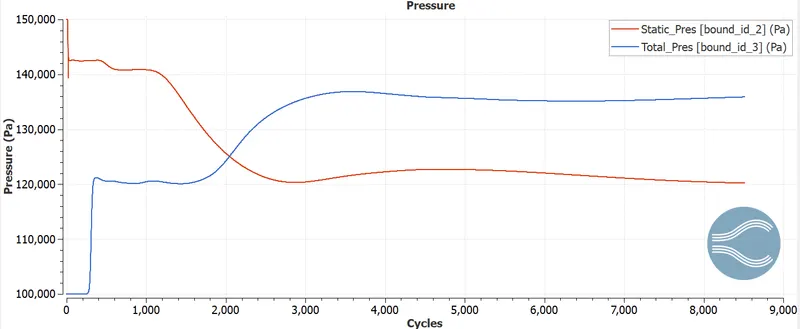
bound_id_2=inlet
bound_id_3=oultlet
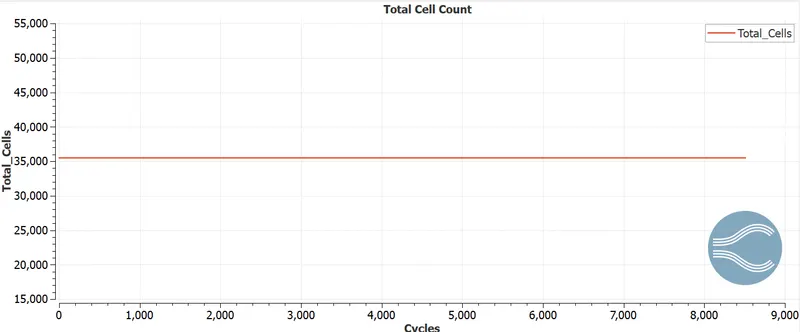
1. Total cell count
2. Velocity
3. Pressure
4. Mass Flow Rate
Flow Simulation
Observation:
1.The embedding scale set to 3 is evidently shown in the grid image as the grids around the throttle is refined as compared to the base grid.
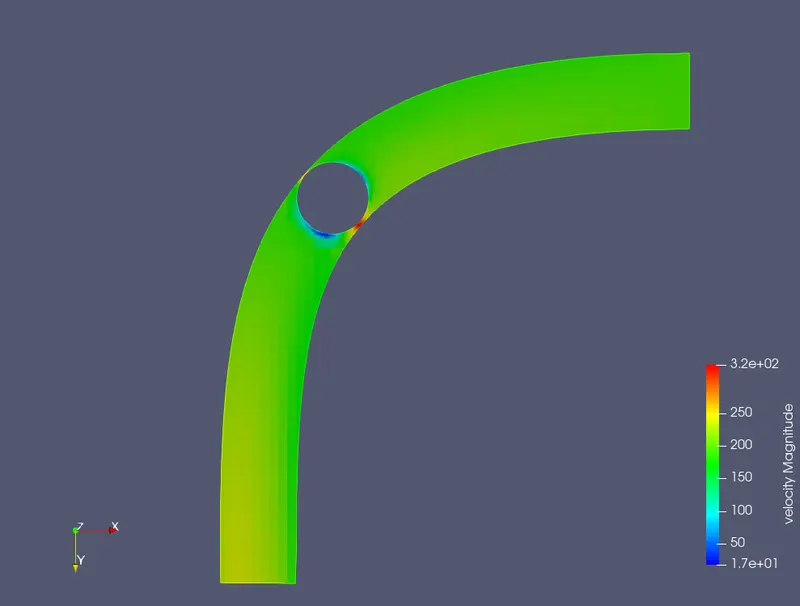
2.As we can see in the plots for both velocity contour and pressure distribution above , the velocity of fluid abruptly increases when it passes thorugh the constriction and the pressure decreases with increase in velocity with accordance to the bernoulli's theroem.
3.The flow as a whole goes from higher pressure to lower pressure downstream with opposite trend for the velocity where velocity decreases and then increases downstream.
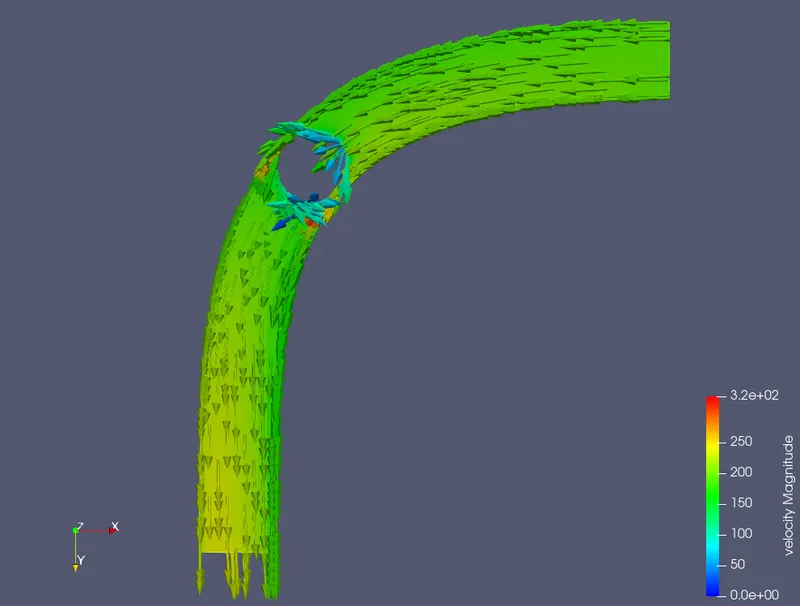
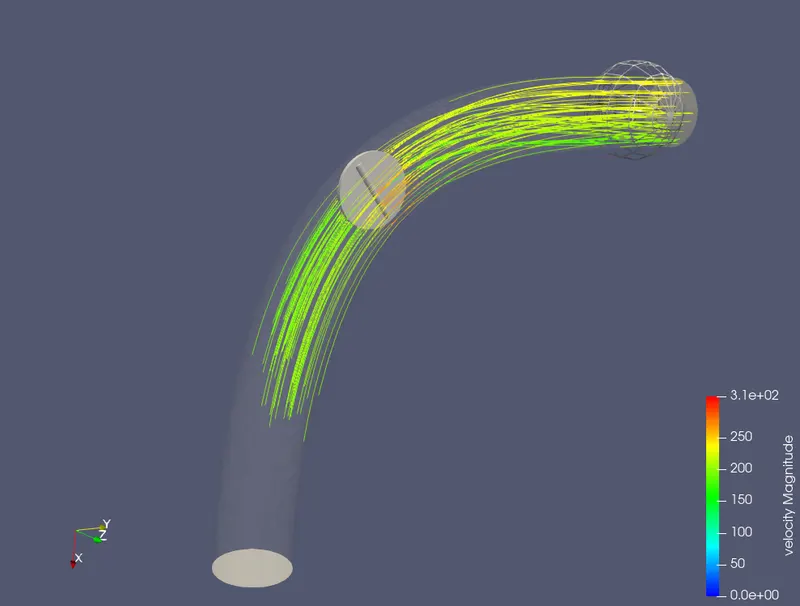
4.We can also view flow seperation , as the fluid has to travel above the throttle and can no longer follow the profile of the throttle , flow seperation occurs.
4.From the converge plots we can see that the simulation ran for 8510 cycles this is because the monitoring variable of average mass flow at oulet reached congvergence @ about 8510 cycles.
5.The other converge plots also seemed to have converged
6.The flow is shown as velocity vectors and using the stream tracer.