Week 4.1 - Genetic Algorithm
% GA syntax

x=ga(fun,nvars);
x=ga(fun,nvars,A,b);
x=ga(fun,nvars,A,b,Aeq,beq);
x=ga(fun,nvars,A,b,Aeq,beq,lb,ub);
x=ga(fun,nvars,A,b,Aeq,beq,lb,ub,nonlcon);
x=ga(fun,nvars,A,b,Aeq,beq,lb,ub,nonlcon,options);
x=ga(fun,nvars,A,b,[],[]lb,ub,nonlcon,lntCon);
x=ga(fun,nvars,A,b,[],[],lb,ub,nonlcon,lntCon,options);
x=ga(problem);
[x,fval]=ga(___);
[xfval,exitflag,outout,population,scores]=ga(___)
function[f]=genetic_algorithm_function(input_vector)
a1=(sin(5.1*pi*input_vector(1)+0.5))^6;
a2=(sin(5.1*pi*input_vector(2)+0.5))^6;
a3=exp(-4*log(2)*((input_vector(1)-0.0667)^2)/(0.64));
a4=exp(-4*log(2)*((input_vector(2)-0.0667)^2)/(0.64));
f=-(a1*a2*a3*a4);
end% GENETIC ALGORITHM
clear all
close all
clc
% Defining our search space
x=linspace(0,0.6,150);
y=linspace(0,0.6,150);
num_cases=60;
% Creating a 2-D mesh
[xx yy]=meshgrid(x,y);
% calling the function
for i=1:length(xx)
for j=1:length(yy)
input_vector(1)=xx(i,j);
input_vector(2)=yy(i,j);
f(i,j)=genetic_algorithm_function(input_vector);
end
end
% study 1 behaviour
tic
for i=1:num_cases
[inputs,fopt(i)]=ga(@genetic_algorithm_function,2);
xopt(i)=inputs(1);
yopt(i)=inputs(2);
end
studytime1=toc;
%unbounded inputs
figure(1)
subplot(2,1,1)
hold on
surfc(x,y,-f)
shading interp
plot3(xopt,yopt,-fopt,'Marker','o','MarkerSize',5,'MarkerFaceColor','r')
title('unbounded inputs')
subplot(2,1,2)
plot(-fopt)
xlabel('iterations')
ylabel('function maximum')
% study 2 behaviour
tic
for i=1:num_cases
[inputs,fopt(i)]=ga(@genetic_algorithm_function,2,[],[],[],[],[0,0],[0.5,0.5]);
xopt(i)=inputs(1);
yopt(i)=inputs(2);
end
studytime2=toc;
%bounded inputs
figure(2)
subplot(2,1,1)
hold on
surfc(x,y,-f)
shading interp
plot3(xopt,yopt,-fopt,'Marker','o','MarkerSize',5,'MarkerFaceColor','r')
title('bounded inputs')
subplot(2,1,2)
plot(-fopt)
xlabel('iterations')
ylabel('function maximum')
% study 3 behaviour
options=optimoptions('ga');
options=optimoptions(options,'PopulationSize',200);
tic
for i=1:num_cases
[inputs,fopt(i)]=ga(@genetic_algorithm_function,2,[],[],[],[],[0;0],[0.5;0.5],[],[],options);
xopt(i)=inputs(1);
yopt(i)=inputs(2);
end
studytime3=toc;
%optimisation
figure(3)
subplot(2,1,1)
hold on
surfc(x,y,-f)
shading interp
plot3(xopt,yopt,-fopt,'Marker','o','MarkerSize',5,'MarkerFaceColor','r')
title('optimisation')
subplot(2,1,2)
plot(-fopt)
xlabel('iterations')
ylabel('function maximum')
EXPLANATION OF CODE:
1.x=ga(fun,nvars) finds the local unconstrained min x to thr objective function fun.nvars is number of design variables of fun.
2.x=ga(fun,nvars,A,b) finds a local min x to fun subject to the linear inequalities A*x<=b ga evaluates the matrix product A*x as if x is transposed (A*x').
3.x=ga(fun,nvars,A,b,aeq,beq) finds a local min x to fun, subject to the linear equalities aeq*x=beq and A*x<=b.
4.x=ga(fun,nvars,A,b,aeq,beq,lb,ub) defines a set of lower and upper bounds on the design variables x so that a solution is found in the range lb<=x<=ub.
5.x=ga(fun.nvars.A,b,aeq,beq,lb,ub,nonlcon,options) minimizes with the default optimization parameters replaced by values in options
6.x=ga(fun,nvars,A,b,aeq,beq,lb,ub,nonlcon,intcon) requires that the variables listed in intcon take integer values.
7.x=ga(problem) find the minimum for problem where problem is a structure
8.[x,fval,exitflag,output]=ga(___) also returns existing an integer identifying the reasin the algorithm terminated and outout a structure that contains output from each generation and other information about the performance of the algorithm.
9.[x,fval,existing,output,population,scores]=ga(__) also returns a matrix population whose rows are the final population and a vector scores the scores of the final population.

working of GA:

the algorithm begins by creating a random initial population and creates a sequence of new population at each step it uses individuals in the current generation to create the next population.
to create the new population the algorithm performs the following steps
scores each member of the current population by computing its fittness value it is called fitness scores.
scales the raw fitness scores to convert them into a more usable range of values the values are called expectation values.
some of the individual in the currengt population that have lower fitness are chosen as elite.these elite individuals are passed to the next poppulation produces children from the parents.
children are produced from parents mutation or by combining the vector entries of a parents crossover,replaces the current population with the children to form the nextv generation
the algorithm stops when one of the stopping critera is met.

STOPPING CRITERIA:

stopping criteria determines what causes the algorithm to terminate
generation specifies the max number of iterations the genetic algorithm performs
time limit specifies the max time in sec the genetic algorithm runs before stoping
fitness limit if the best fitness value is less than or equal to the value of fitness limit the algorithm stops
stall generations if the average change in the fitness function value overstall generations is less than function tolerance the algorithm stops.
function tolerance and constraints are also applies.

STALAGMITE FUNCTION:

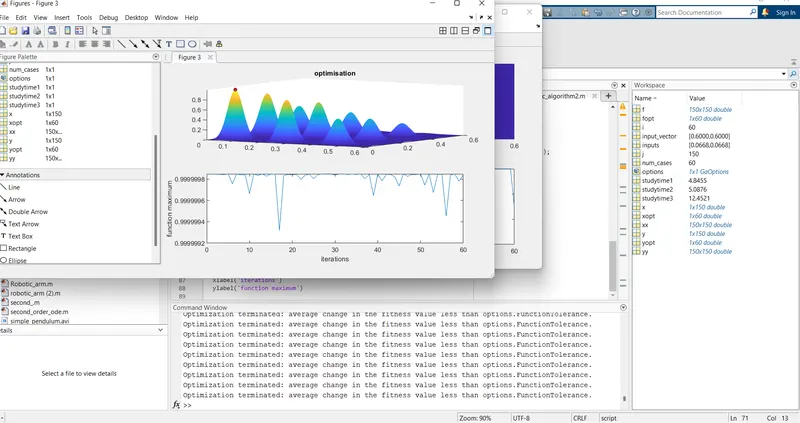
a stalagmite is an upward growing mound of mineral deposits that have precipitated from water dripping onto the floor og a cave.the figure we get is in the shape of stalagmite so we use this name here.

PROCEDURE:

INITIALLY x and y are given as o to 0.6 with range of 150 and num_cases is given as 60.
we will store the x,y value in a 2nd array by using meshgris function

the function which we stored is called in this code of loop function in which our input_vector is differentiated into input_vector(1) and input_vector(2).

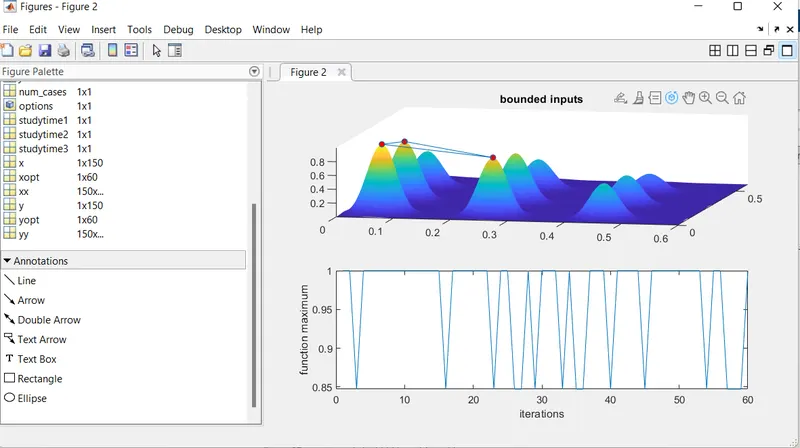
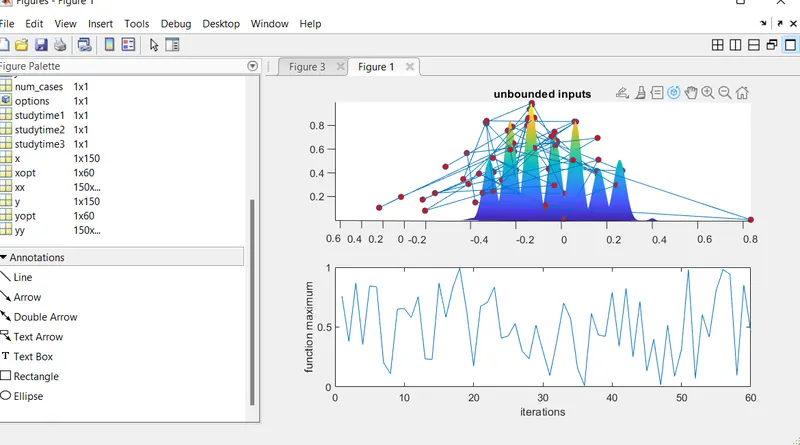
the study behaviour for fig 1 with unbounded inputs incluses calling our predifined funvtion in a loop function and running it with our no of num_cases the study fir 1st plot is calculated and surface plot is employed here.the subplot defines the rows and columns and the position of the variable.
the other two plots are also defimnes such ways

ERRORS FACED:

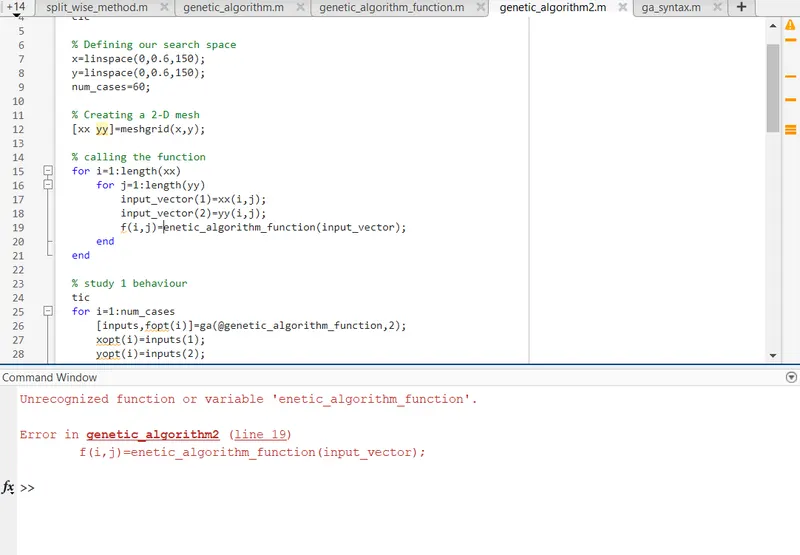
THE  stalagmite function declared was different

CORRECTED ERROR:

changed the name of the function and declared it.