EXPLANATION:

AIM: TO PARSE THE THERMODYNAMIC DATA FROM NASA USING MATLAB.


THEORY:

 The official record of thermodynamic values at different temperatures has been stored by NASA in the form of polynomials with specified constants ranging from one to fourteen for various species.

In order to quantify the values, the polynomials can be solved with defined temperature values in accordance with our requirements.

 The term 'parsing' refers to MATLAB reading an m-file (script or function) and translating it into an internal code that it stores in memory.

 It is this 'parsed' file in memory that is actually run when you execute the code.

GOVERNING EQUATIONS:

• SPECIFIC HEAT -

C_P/R=al+a2xT+a3x1^2+4x)^3+a5x114CP/R=al+a2xT +a3x12+a4xT3+a5x14

ENTHALPY -

H/RT=al+a2x1/2+a3x1^2/3+04x1^3/4+a5x114/5+06/TH/RT=al+a2x1/2+a3x12/3+44x13/4+a5xT4/5+06/1

• ENTROPY -S/R=alxlogT+a2xT+a3xT^2/2+a4x1^3/3+a5x114/4+a75/R=alxInT +a2xT +a3x12/2+(4x13/3+a5x14/4+a7

where,

Cp = Specific Heat

H = Enthalpy

S = Entropy

R = Universal Gas Constant (8.314 J/mol.k)

T = Temperature

* The First 7 Coefficients are High Temperature Coefficients and the Second 7 Coefficients are Low Temperature Coefficients.

OBJECTIVE:

1. To write a function extracting the 14 coefficients from the data file and calculating the specific heat,enthalpy and entropy of all species.

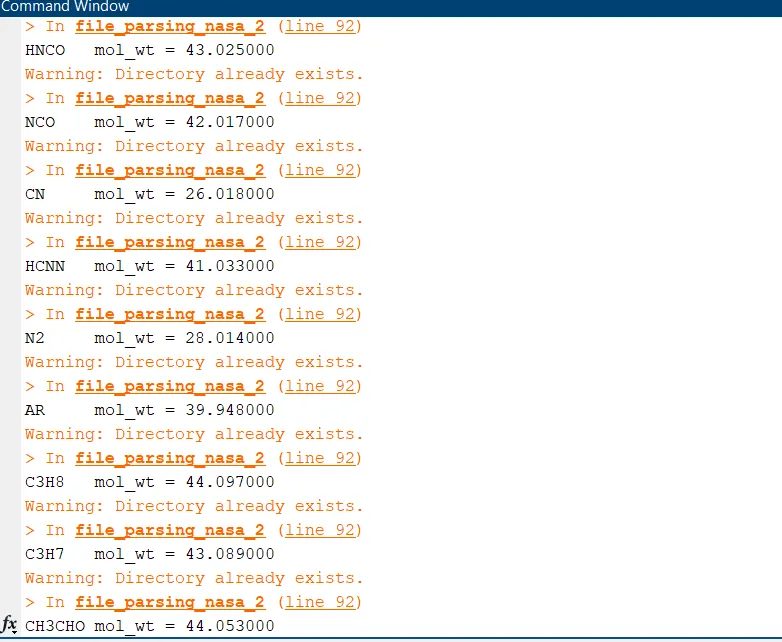
2. To calculate molecular weight of every species and displaying in command window.

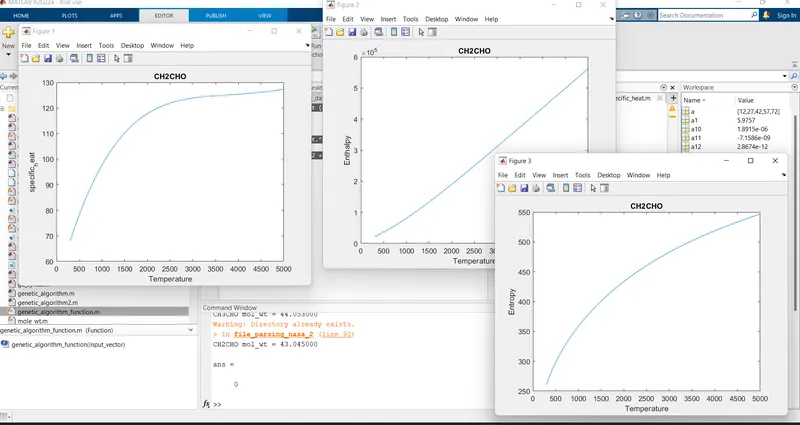
3. To plot specific heat, enthalpy and entropy with temperature range distributed from global high temperature to global low temperature.

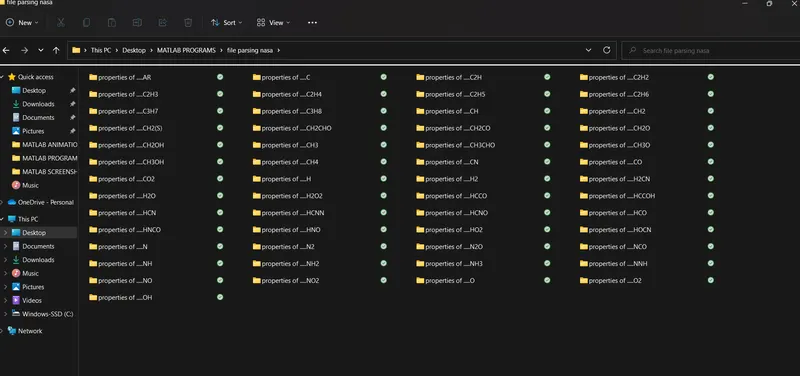
 4. To create a separate folder for all the plots and saving them in '.png' format.

EXPLANATION OF PROGRAM:
• Initially, a code is written to read the desired data file and values are assigned.
   Here, comments andother data is read using respective commands.

• The coefficient values are determined and allotted to a constant.

• A new folder with the name 'SPECIES' is created to desired location.
 The coefficient function is called and plotting of graphs is carried out.

• Plots are saved in the specified folder and the process of determining molecular weight is carried out.

• The molecular weight function is called and the values are printed in the command window.
function cp=specific_heat (a1, a2, a3, a4, a5, a8, a9, a10,a11,a12,R,t, mid_temp);

if t<=mid_temp

cp = (a8 + a9.*t + a10.*t.^2 + a11.*t.^3 + a12.*t.^4).*R;
else
cp = (a1 + a2.*t+a3.*t.^2 + a4.*t.^3 + a5.*t.^4).*R;
end
function H = enthalpy (a1, a2, a3, a4, a5, a6, a8, a9, a10, a11,a12,a13, R, t, mid_temp)
 if t<=mid_temp
H = (a8 + (a9.*t./2) + (a10.*t.^2/3) + (a11.*t.^3/4) + (a12.*t.^4/5) + (a13./t)).*R.*t;
else
H =(a1 + (a2.*t/2) + (a3.*t.^2/3) + (a4.*t.^3/4) + (a5.*t.^4/5) + (a6./t)).*R.*t;
 end
function S = entropy (a1, a2, a3, a4, a5, a7, a8, a9, a10, a11, a12, a14, R, t, mid_temp)

if t<=mid_temp

S = (a8*log(t)+a9.*t+(a10.*t.^2/2)+(a11.*t.^3/3)+(a12.*t.^4/4)+a14).*R;
 else
S = (a1* log(t)+a2.*t+(a3.*t.^2/2)+(a4.*t.^3/3)+(a5.*t.^4/4)+a7).*R;
end
function molecular_weight_calc = molecular_weight(species_name)
elements = ['o', 'H','C', 'N', 'A'];
atomic_mass = [15.999,1.008,12.011, 14.007,39.948];
mol_wt =0;
 for i = 1: length(species_name)
     for j = 1: length(elements)
 if strcmpi(species_name(i), elements(j))
       mol_wt = mol_wt+atomic_mass(j);
 z = j;
 end
     end
t = str2num(species_name(i));
if (t>1)
mol_wt = mol_wt+(atomic_mass(z)*(t-1));
end
molecular_weight_calc = mol_wt;
 end
clear all
close all
clc

% To open the thermal data file
f1=fopen('THERMO (1).dat','r');

%get heading file
heading = fgetl(f1);

%Global temperature values

global_temp =fgetl(f1);

x= strsplit(global_temp);

global_low_temp = str2double(x{2});
global_mid_temp = str2double(x{3});
global_high_temp = str2double(x{4});

fgetl(f1)
fgetl(f1)
fgetl(f1)

% their are 53 species
for i = 1:53

    line1 = fgetl(f1);

    species_name = line1(1:6);


   %local temperature


   local_temp1 =line1(49:55);

   low_temp = str2double(local_temp1);

local_temp2 = line1(58:65);
high_temp = str2double(local_temp2);

local_temp3 = line1(68:75);
mid_temp = str2double(local_temp3);

% extracting the coefficient
line2 = fgetl(f1);
line3 = fgetl(f1);
line4 = fgetl(f1);

a = strfind(line2,'E');
b = strfind(line3,'E');
c = strfind(line4,'E');

%extracting coefficient of high temperatur


   a1 = str2double(line2(1:a(1)+3));
 a2 = str2double(line2(a(1)+4:a(2)+3));
 a3 = str2double(line2(a(2)+4:a(3)+3));
a4 = str2double(line2(a(3)+4:a(4)+3));
a5 = str2double(line2(a(4)+4:a(5)+3));
a6 = str2double(line3(1:b(1)+3));
a7 = str2double(line3(b(1)+4:b(2)+3));

%extracting coefficient of low temp

a8 = str2double(line3(b(2)+4:b(3)+3));
 a9 = str2double(line3(b(3)+4:b(4)+3));
 a10 = str2double(line3(b(4)+4:b(5)+3));
 a11 = str2double(line4(1:c(1)+3));
 a12 = str2double(line4(c(1)+4:c(2)+3));
a13 = str2double(line4(c(2)+4:c(3)+3));
 a14 = str2double(line4(c(3)+4:c(4)+3));

%universal gas constant
R = 8.314;
t=linspace(low_temp,high_temp,500);

%calculating specific heat
cp = specific_heat (a1, a2, a3, a4, a5, a8, a9, a10, a11, a12, R, t,mid_temp);

%calculating enthalpy
H = enthalpy (a1, a2, a3, a4, a5, a6, a8, a9, a10, a11, a12, a13, R, t,mid_temp);

%calculating entropy
S = entropy(a1, a2, a3, a4, a5, a7, a8, a9, a10, a11, a12, a14, R, t, mid_temp);

%creating folder
data = strcat('properties of .....', species_name);
mkdir(data);
file = pwd;

%plotting
figure(1)
plot(t,cp)
data1= strcat(species_name, 'temperature vs specific heat');
xlabel ('Temperature')
ylabel('specific_heat')
title( species_name)
f = fullfile(data);
cd(f)
saveas (gcf,[pwd '/specific heat vs temperature .jpg'])
cd(file)

figure (2)
plot(t,H)
data2 = strcat(species_name, 'temperature vs enthalpy');
xlabel('Temperature')
ylabel('Enthalpy')
title(species_name)
cd(f);
saveas (gcf,[pwd '/enthalpy vs temperature .jpg'])
cd(file)

figure(3)
plot(t,S)
data3 = strcat(species_name, 'temperature vs entropy');
xlabel('Temperature')
ylabel('Entropy')
title(species_name);
cd(f);
saveas (gcf,[pwd '/entropy vs temperature .jpg'])
cd(file)

molecular_weight_calc = molecular_weight(species_name);
k=sprintf('%s mol_wt = %f', species_name, molecular_weight_calc);
disp(k)
end

fclose(f1)