Aim-
- Write a code in MATLAB to optimise the stalagmite function and find the global maxima of the function.
- Clearly expalin the concept of genetic algorithm in your own words and also explain the syntax for ga in MATLAB in your report.
- Plot graphs for all 3 studies and for F maximum vs no. of iterations. Title and axes labels are a must, legends could be shown if necessary.
Concept of genetic algorithm-
Genetic Algorithm (GA) is a search-based optimization technique based on the principles of Genetics and Natural Selection. It is frequently used to find optimal solutions to difficult problems which otherwise would take a long time to solve. It is frequently used to solve optimization problems, in research, and in machine learning.
In GA there is no typial formula that work for all equation.Even if initial GA is ready it will take lot of time and effort to work on parameters which is suitable for particular problem.
ga syntax in matlab- ga- find minimum of function using genetic algorithm.
function calling-
x= ga(@fun,nvars) finds a local unconstrained minimum, x, to the objective function, fun. nvars is the dimension (number of design variables) of fun.
x=ga(@fun,nvars,a,b,aeq,beq) finds a local minimum x to fun, subject to the linear equalities Aeq*x = beq and A*x ≤ b. (Set A=[] and b=[] if no linear inequalities exist.) ga evaluates the matrix product Aeq*x as if x is transposed (Aeq*x').
a,b= linear inequality constraint
aeq,beqn=linear equality constraint
nvars= no of variables
Programm-
clear all
close all
clc
% Writing optimization program
% range of x
x=linspace(0,0.6,150);
% range of y
y=linspace(0,0.6,150);
[xx, yy]=meshgrid(x,y);
% Evaluating Stalagmite Function.
for i=1:length(xx)
for j=1:length(yy)
input_vector(1)=xx(i,j);
input_vector(2)=yy(i,j);
f(i,j)=stalagmite_function(input_vector);
end
end
surf(xx,yy,-f);
shading interp;
[x,fval] = ga(@stalagmite_function,2);
% Optimization Program
x=linspace(0,0.6,150);
y=linspace(0,0.6,150);
[xx,yy] = meshgrid(x,y);
% Evaluating Stalagmite Function
for i=1:length(xx)
for j=1:length(yy)
input_vector(1)=xx(i,j);
input_vector(2)=yy(i,j);
f(i,j)=stalagmite_function(input_vector);
end
end
surf(xx,yy,-f);
hold on
shading interp;
% Unbounded
tic
num_cases = 50;
for i=1:num_cases
[results,fopt(i)] = ga(@stalagmite_function,2);
xopt(i)=results(1);
yopt(i)=results(2);
end
study_time1 = toc
figure(2);
subplot(2,1,1)
hold on
surf(xx,yy,-f);
shading interp;
plot3(xopt,yopt,-fopt,'marker','o','markersize',5,'markerfacecolor','r');
title('Unbounded Inputs');
subplot(2,1,2);
plot(-fopt);
xlabel('Iterations');
ylabel('Function Maximum Value');
% Bounded Solutions
x=linspace(0,0.6,150);
y=linspace(0,0.6,150);
[xx,yy] = meshgrid(x,y);
% Evaluating Stalagmite Function
for i=1:length(xx)
for j=1:length(yy)
input_vector(1)=xx(i,j);
input_vector(2)=yy(i,j);
f(i,j)=stalagmite_function(input_vector);
end
end
surf(xx,yy,-f);
hold on
shading interp;
tic
num_cases = 50;
for i=1:num_cases
[results,fopt(i)] = ga(@stalagmite_function,2,[],[],[],[],[0,0],[0.6,0.6]);
xopt(i)=results(1);
yopt(i)=results(2);
end
Study_time1 = toc
figure(2);
subplot(2,1,1)
hold on
surf(xx,yy,-f);
shading interp;
plot3(xopt,yopt,-fopt,'marker','o','markersize',5,'markerfacecolor','r');
title('Bounded Inputs');
subplot(2,1,2);
plot(-fopt);
xlabel('Iterations');
ylabel('Function Maximum Value');
% Optimization Program
x=linspace(0,0.6,150);
y=linspace(0,0.6,150);
[xx,yy] = meshgrid(x,y);
% Evaluating Stalagmite Function
for i=1:length(xx)
for j=1:length(yy)
input_vector(1)=xx(i,j);
input_vector(2)=yy(i,j);
f(i,j)=stalagmite_function(input_vector);
end
end
surf(xx,yy,-f);
hold on
shading interp;
% Optimization
options = optimoptions('ga');
options = optimoptions(options,'PopulationSize',200);
tic
num_cases = 50;
for i=1:num_cases
[results,fopt(i)] = ga(@stalagmite_function,2,[],[],[],[],[0,0],[0.6,0.6],[],[],options);
xopt(i)=results(1);
yopt(i)=results(2);
end
Study_time1 = toc
figure(3);
subplot(2,1,1)
hold on
surf(xx,yy,-f);
shading interp;
plot3(xopt,yopt,-fopt,'marker','o','markersize',5,'markerfacecolor','r');
title('Bounded Inputs');
subplot(2,1,2);
plot(-fopt);
xlabel('Iterations');
ylabel('Function Maximum Value');
%stalgmite function code
function [f]=stalagmite_function(input_vector)
x=input_vector(1);
y=input_vector(2);
f1=(sin(5.1*pi.*x+0.5)).^6;
f2=(sin(5.1*pi.*y+0.5)).^6;
f3=exp(-4*log(2).*(x-0.0667).^2/0.64);
f4=exp(-4*log(2).*(y-0.0667).^2/0.64);
f=-(f1.*f2.*f3.*f4);
end
Output-
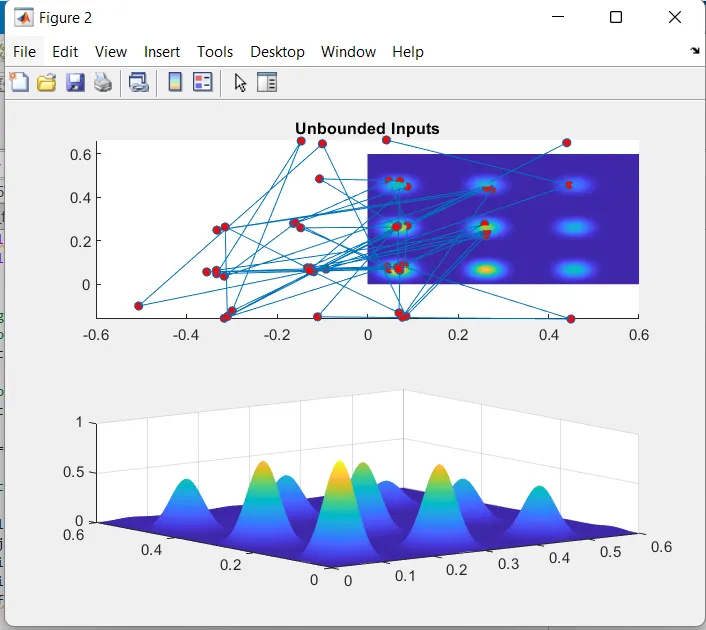
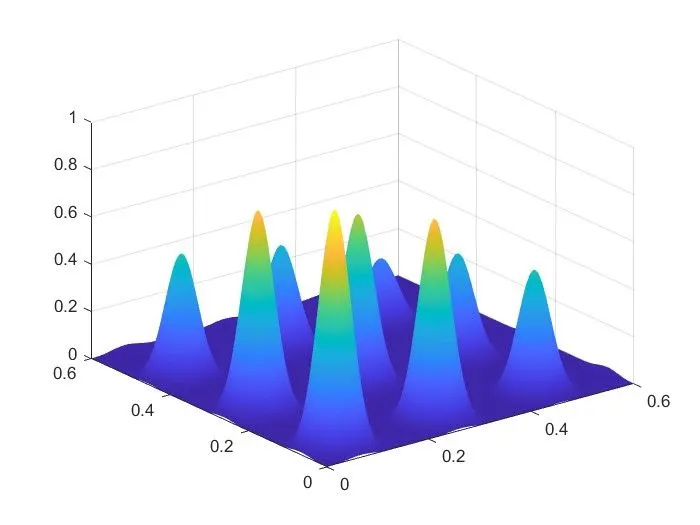
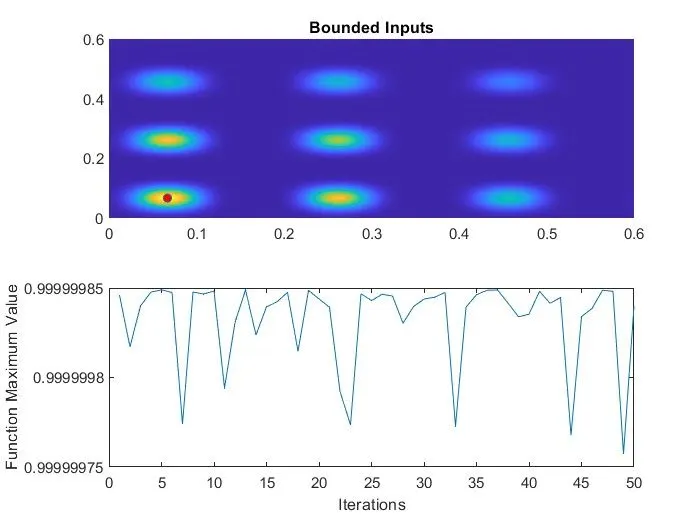
Explaination-
Create a funtion called stalgmite using parameter input vector.
Generate input vetor using linspace command and create meshing using meshgrid command.
Generate minimum and maximum funtion using stalagmite function and plot a graph.
tic and toc function use to generate 3 different study time and plot of graph of unbounded,bounded and increase iteration.