Project 1 - Parsing NASA thermodynamic data
Objectives :
To Write a program in Matlab to parse the NASA thermodynamics data file and then calculate thermodynamics properties of various species.
Requirements :
- To write a function that extracts 14 co-efficient and calculate enthalpy,entropy and specific heat for all species in data file.
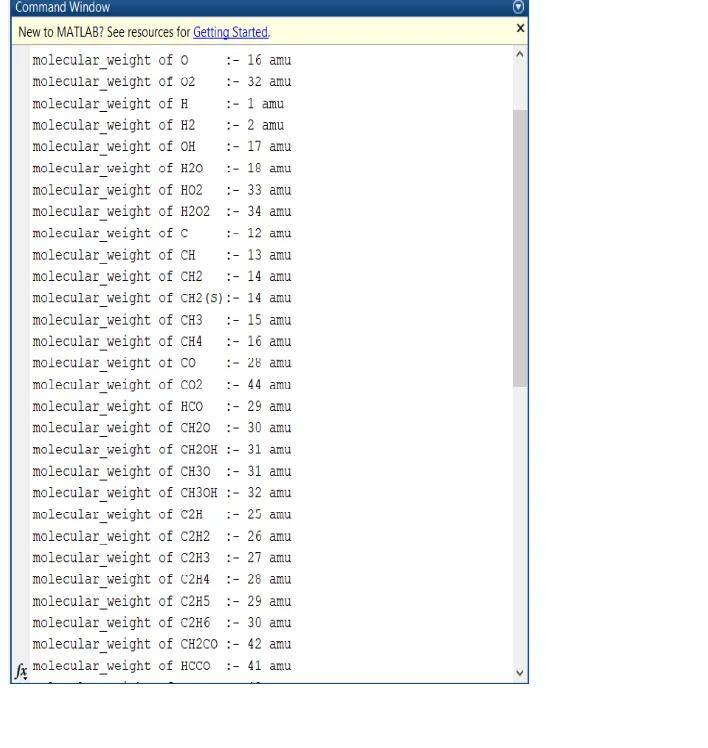
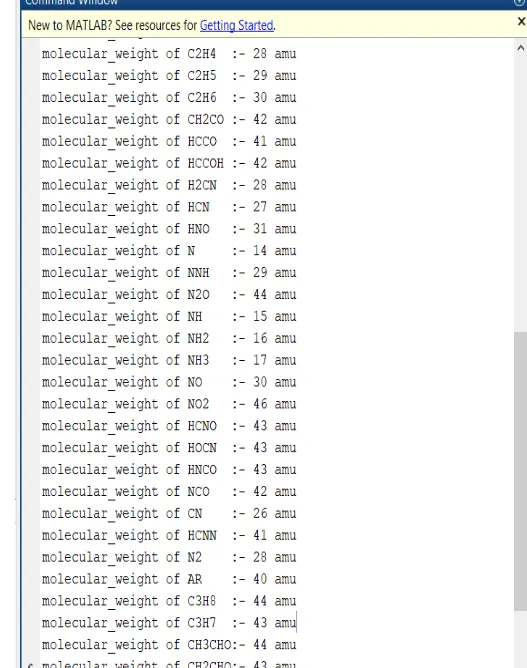
- calculate Molecular weight of each species and displaying it in command window.
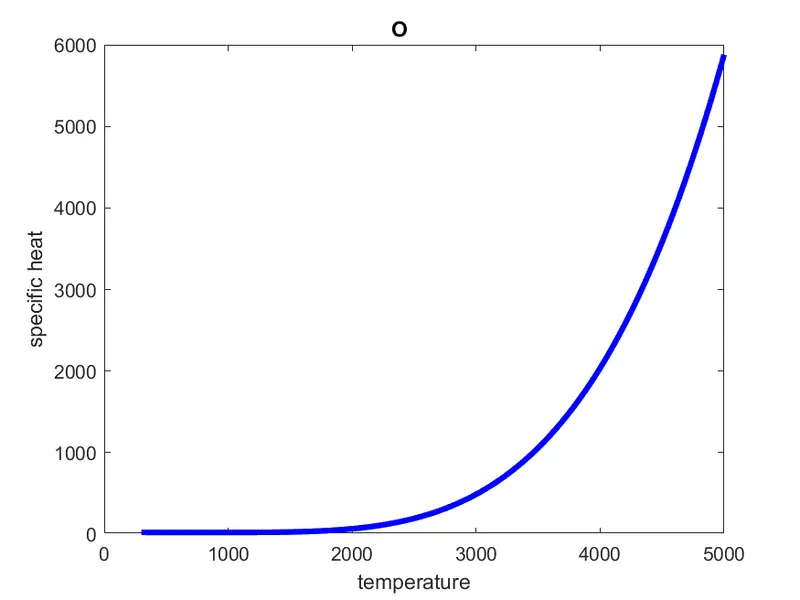
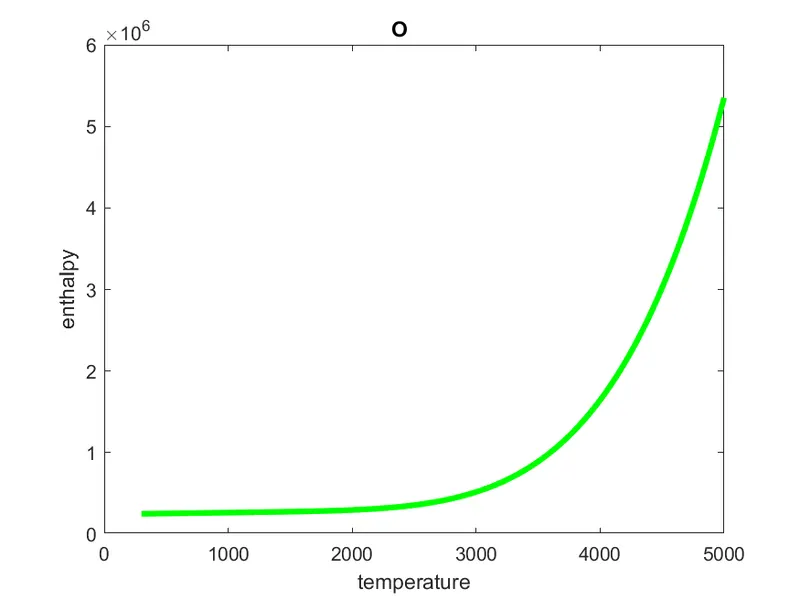
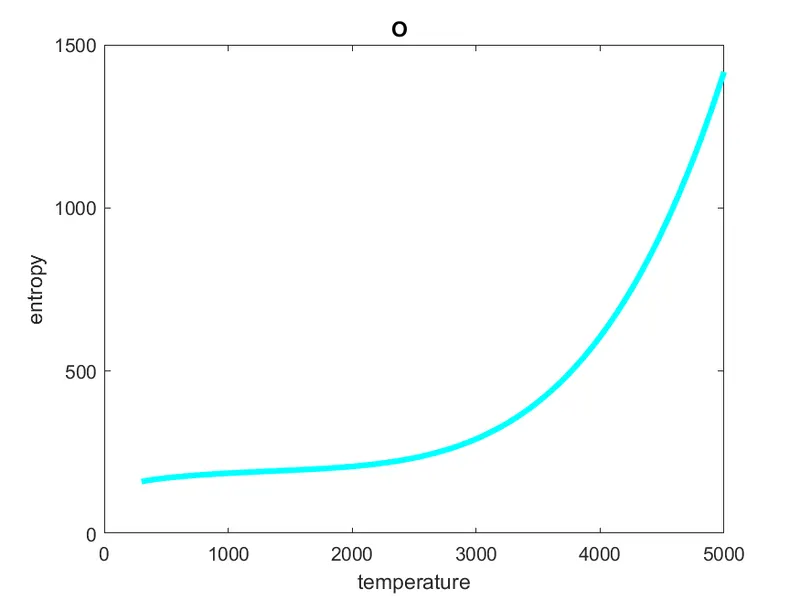
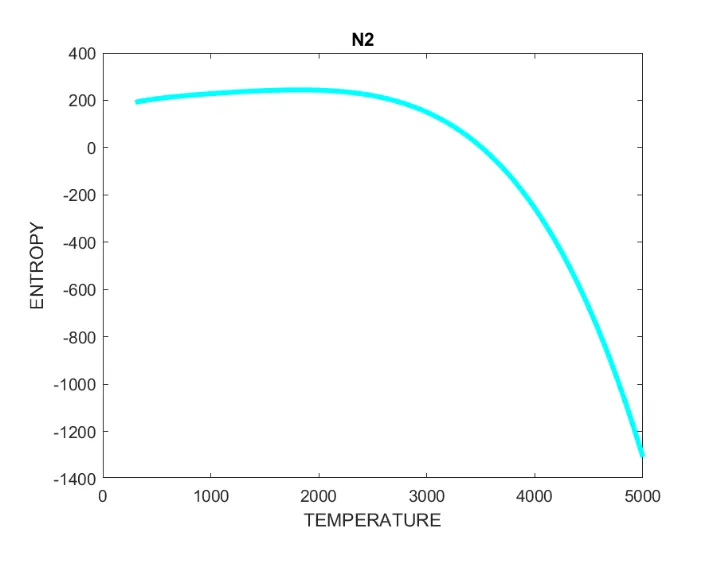
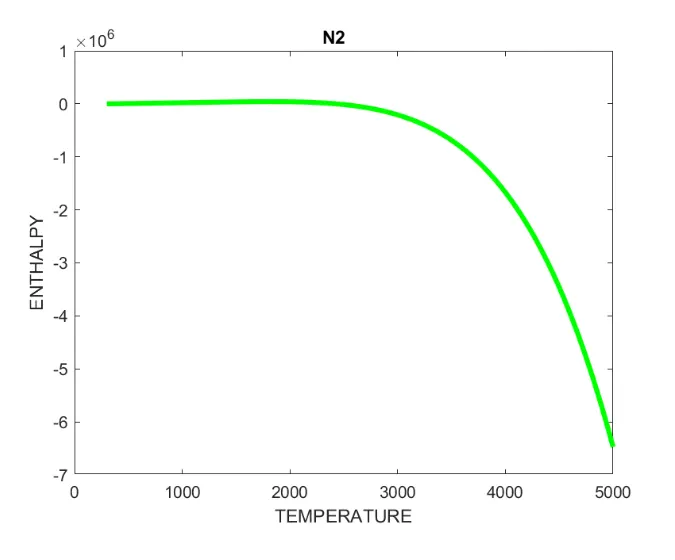
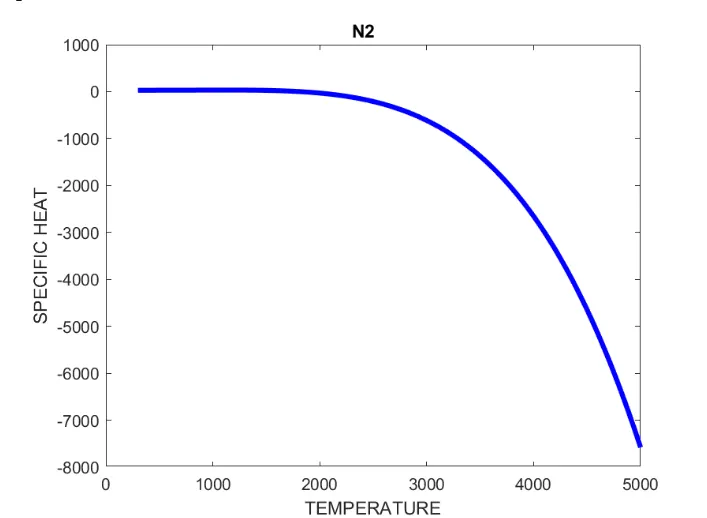
- Plotting enthalpy , entropy , Cp for local temperature range specific for each species.
- Save the plots as images with appropriate names and dump them in separate folders for each species with suitable name. All these should be generated automatically.
- The main program that you will submit will just take the "THERMO.dat" file as an input and generate Cp, H and S plots.
- Please write a detailed report to describe your logic.
Introductions :
- Parsing means to make something understandable. for programming this means to convert information represented is one form into another form thats easier to work with.
- This is done by partially analysing the data,understanding its underlying structure and then explicity representing that structure in the code.
- a data stream of some sort and building an in memory model of the sematic content of the data.
- this aims at facilitating performing some kind of transformation on the data.
Equations :
from the given themodyanic data it is clear that their are 53 species and each species their are 14 coefficient and for each species their ia a unique low,mid and high temperatureranges.
Where,
Cp = Specific Heat
R = Molor gas Constant
T =temperature
S = Entropy
H = Enthalpy
a = Coefficients
Defnations :
1) Specific Heat :
It is a ratio of the quantity of heat required o raise the temp. of a body one degree to that required to raise the temp. of an equal mass of water one degree.
2) Enathalpy :
it is a thermodynamics system is defined as the sun of its internal energy and the work required to achieve its pressure and volume.
3) Entropy :
it is a measure of degree of disorderness of the system.
Code : Explanation
main code
Explanation :
- Initially the value of R is being defined.
- then we use a command to open the file 'THERMO.dat'
- Further we use the 'fget1' to start reading the lines and after reading the first two lines, from the second line converting the strings to numbers and assigning global temperatures.
- Then we have written a command to get the temperature range for calculation and plotting purpose.
- again using the fgetl command to go to thel next 3 lines ans skipping it
- We use a for loop to get 53 species and their temperatures and the 14 coefficients.
- in the for loop we again use the fgetl command and then the next line is read and from that line species name, the three local temperatures are read and stored.
- we use fgetl command to go further line and get first 7 coefficients and store them. using the fgetl command we move to the next two lines and get the reamining coefficients.
- after getting the 14 coefficients we use thease coefficients and by calling the functions we calculatecp,H,S.
- In this plotting we use the figure command to get the thre different plots and saveas command to save the figures in
- again we change our directory to start the loop , So loop continues to function till get all the 53 species and then gets terminated.
output