Week 4.1 - Genetic Algorithm
Steps for creating general algorithm MATLAB program
1. First, erase and close the previous data keyed in by typing the clc, clear all and close all.
2. Input the X and Y coordinates by mentioning the limits and the number of values to be taken inbetween them using linspace. Also mention the no of cases/iterations for the 1st study.
3. Creation of the stalgamite function in a seperate stalgamite.m file and save in the same directory. Include all the outputs f1x, f2x,f1y & f2y in the function file.
4. mention the input_vector(1) and input vector(2) to hold the values of all x and y corresponding functions respectively.
5. Create two for loops to run the x and y values arrived from the stalgamite function for every iteration
6. for study 1 we are just going to run a for loop for the optimization for fopt , xopt and yopt with a ga syntax x = ga(fun,nvars)
7. In order to calculate the time for the study 1,2 and 3 to run we use the tic and toc command.
8. plot the surface curve using surfc coomand for x,y and f.using subplot plot the 3d of xopt, yopt and -fopt as we determine to find the Global maxima.
9. Include title unbounded inputs also plot just the -fopt in the subplot and include the xlabel and ylabel before generating the results
10. for study 2 we are going to run a for loop for the optimization for fopt , xopt and yopt with a ga syntax x = ga(fun,nvars,A,b,Aeq,beq,lb,ub) where lb and ub are lower and upper bounds. A,b,beq,Aeq are all constants/values for aiding in calculation of fopt
11. Repeat the same steps 8 and 9 for generating the plots for study 2.
12. For study 3 we are using the optimoptions for ga syntax options = optimoptions(SolverName)
options = optimoptions(SolverName,Name,Value)
13. After this for study 3 we are just going to run a for loop for the optimization for fopt , xopt and yopt with a ga syntax x = ga(fun,nvars,A,b,Aeq,beq,lb,ub,nonlcon,options)
where nonlcon stands for non linear constraint and options is calling options
14. Repeat the same steps 8 and 9 for generating the plots for study 3.
clc;
close all;
clear all;

% Providing coordinates for x and y
x = linspace(0,0.6,150);
y = linspace(0,0.6,150);
n_cases = 50
% Creating a 2D meshgrid

[xx yy] = meshgrid(x,y);
tic

% Evaluating the stalagmite function
for i = 1:length(xx)
    for j = 1:length(yy)
        input_vector(1) = xx(i,j);
        input_vector(2) = yy(i,j);
        f(i,j) = stalagmite(input_vector);
    end
end

% study1 - statistical beahiour
for i =1:n_cases
    [inputs,fopt(i)] = ga(@stalagmite,2);
    xopt(i) = inputs(1);
    yopt(i) = inputs(2);
end

study1_time = toc
figure(1)
 subplot(2,1,1)
 hold on
surfc(xx,yy,-f)
shading interp
plot3(xopt,yopt,-fopt,'marker','o','markersize',4,'markerfacecolor','r')
title('unbounded inputs')
 subplot(2,1,2)
plot(-fopt)
xlabel('iterations')
ylabel('function maxima')
tic
% Stydy 2 Bounded limits values

for i=1:n_cases
    [inputs,fopt(i)]=ga(@stalagmite,2,[],[],[],[],[0;0],[0.6;0.6]);
        xopt = inputs(1);
        yopt = inputs(2);
end

study2_time = toc
figure(2)
subplot(2,1,1)
surfc(xx,yy,-f)
hold on
shading interp
plot3(xopt,yopt,-fopt,'marker','o','markersize',4,'markerfacecolor','r')
title('bounded inputs')
subplot(2,1,2)
plot(fopt)
xlabel('iterations')
ylabel('function maximum')
tic

% study 3 increased no of iterations

options = optimoptions('ga')
options = optimoptions(options,'populationsize',150)

for i=1:n_cases
    [inputs,fopt(i)] = ga(@stalagmite,2,[],[],[],[],[0;0],[0.6;0.6],[],[],options);
    xopt = inputs(1);
    yopt = inputs(2);
end

study3_time = toc
figure(4)
subplot(2,1,1)
surfc(xx,yy,-f)
hold on
shading interp
plot3(xopt,yopt,-fopt,'marker','o','markersize',4,'markerfacecolor','r')
title('more iterations');
subplot (2,1,2)
plot(-fopt)
xlabel('iterations')
ylabel('func min')
tic
Stalgamite function
function[f] = stalagmite(input_vector)
% f(x,y) = (f1.x,f2.x,f1.y,f2.y)
x=input_vector(1);
y=input_vector(2);

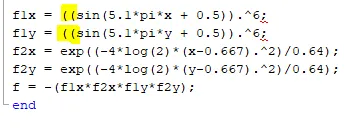
f1x = (sin(5.1*pi*x + 0.5)).^6;
f1y = (sin(5.1*pi*y + 0.5)).^6;
f2x = exp((-4*log(2)*(x-0.667).^2)/0.64);
f2y = exp((-4*log(2)*(y-0.667).^2)/0.64);
f = -(f1x*f2x*f1y*f2y);
end
f = -(f1x*f2x*f1y*f2y)
'-' sign as we need to find the global maxima instead of the minima.
Errors while doing Matllab program
1. 
Error
 .
.
correct the nos of brackets in the stalgamite function.
2.
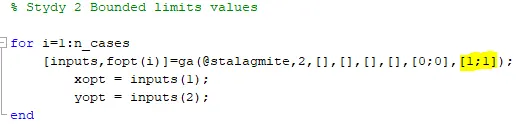
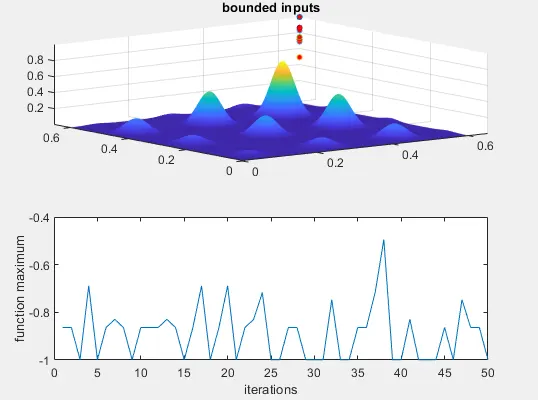
Limits given 1,1 so the graph generated is
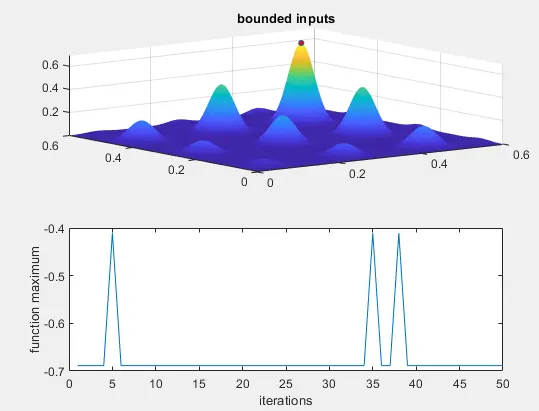
After correction
3.
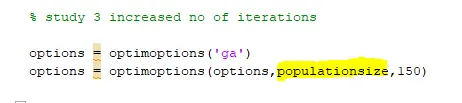
no quote for population size
Error
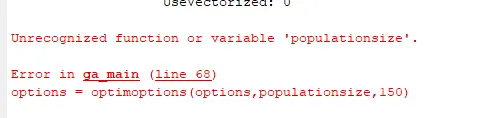
correction insert quotes