Project 1 - Parsing NASA thermodynamic data
File Parsing of NASA thermodynamic data
Introduction
In this report we are going to explain how to parse the thermodynamics data that has been provided to us using MATLAB. Also how we are going to generate plots between Cp, S and H for each and every element.
Steps for creating File Parsing of NASA thermodynamic data using MATLAB program
- First, erase and close the previous data keyed in by typing the clc, clear all and close all.
- Input the fopen command to run the file THERMO.dat and save it in a thermo name
- Take first line using fgetl command and save it in thermo.
- Use strsplit command to get the different global temperature ranges and split them into different arrays
- Convert the string to numbers using the str2num command for all high low and mid temperature.
- The next three lines are just comments so we can neglect that.
- Now run this loop for all elements and their temperature ranges using the commands while and for loops for all the 53 elements.
- Now we us flip command to this line to read the elements in the reverse direction.
- Now to calculate molecular weight we assign elements which are available in the data sheet and give their molecular weights in the corresponding array. Set counter MM=0
- Run a for loop for the entire series of species name and a for loop for the each single atom elements in each of the 6 arrays
- Use if command and run strcmpi to compare the elements and the species name and if the result is yes it will go to calculate wt in j loop including the molecular mass
- Now if the atoms inside is more than one store the j value in a variable and multiply it with a (n-1)
- Now use sprintf the molecular weight of each element and their corresponding weight.
- Convert string to number of the local temperatures of each and every element for low,mid and high
- Get the temperature coefficients of TC1 to TC5 using the fgetl of the file. Similarly do it for T6 and T7 from the next line for high temp coefficients
- Repeat the same process for T8 to T14 which are recorded as the low temperature coefficients.
- Now give the for loop and if loop for condition local temperature less than mid temperature use specific heat , enthalpy and entropy calculations from TC8 to TC14 if it is greater use TC1 to TC7.
- Type in the formulae for specific heat , enthalpy and entropy for low and high temperatures accordingly.
- Create a folder directory using mkdir,cd of the species name and use save as command for the following plotted graphs to be saved.
- Plot the graphs Temperature(T) vs Specific heat(Cp), Temperature(T) vs Entropy(S) and Temperature(T) vs Enthalpy(H)
- . to close the directory and end command for the while loop
clc
clear all;
close all;

thermo = fopen('THERMO.dat','r')
[tline] = fgetl(thermo);
[temp_ranges] = fgetl(thermo);
A = strsplit(temp_ranges,' ');

% Saving of temperature ranges for calculation
Global_Low_temp= str2num(A{2});

Global_Mid_temp = str2num(A{3});

Global_High_temp = str2num(A{4});

% running the comments file

[comment_1] = fgetl(thermo);
[comment_2] = fgetl(thermo);
[comment_3] = fgetl(thermo);


while ~feof(thermo)
  for j=1:53

% getting the species name and their local temperature

[elements_temps] = fgetl(thermo)

B = strsplit(elements_temps,' ')

B_dash = flip(B);


  % Calculation of Molecular weight
elements = ['H','C','N','O','Ar','S']
wt = [1,12,14,16,40,32]

MM = 0
sp_name = B{1}

for i= 1:length(sp_name);

  for j=1:length(elements);

    if strcmpi(elements(j), sp_name(i))
      MM = MM + wt(j)
      p=j;
    end
    end
n=str2double(sp_name(i));
if n>1;
  MM=MM+wt(p)*(n-1)

end
end

sprintf('Mol_wt of %s=%d',sp_name,MM)

 Local_low_temp = str2num(B_dash{4});
 Local_mid_temp = str2num(B_dash{2});
Local_high_temp = str2num(B_dash{3});

% getting the High local temperature coefficient for every element - line1

temp_coef_1 = fgetl(thermo)
exp = strfind(temp_coef_1,'E')
TC1 = temp_coef_1(1:12+3);
TC2 = temp_coef_1(exp(1)+4:exp(2)+3);
TC3 = temp_coef_1(exp(2)+4:exp(3)+3);
TC4 = temp_coef_1(exp(3)+4:exp(4)+3);
TC5 = temp_coef_1(exp(4)+4:exp(5)+3);

% converting High temperature coefficient strings to numbers - line1

TC1 = str2num(TC1);
TC2 = str2num(TC2);
TC3 = str2num(TC3);
TC4 = str2num(TC4);
TC5 = str2num(TC5);

% getting the High local temperature coefficient for every element - line2

temp_coef_2 = fgetl(thermo);
exp_2 = strfind(temp_coef_2,'E');
TC6 = temp_coef_2(1:12+3)
TC7 = temp_coef_2(exp_2(1)+4:exp_2(2)+3)

% converting High temperature coefficient strings to numbers - line2

TC6 = str2num(TC6);
TC7 = str2num(TC7);

% getting the Low local temperature coefficient for every element - line2

TC8 = temp_coef_2(exp_2(2)+4:exp_2(3)+3);
TC9 = temp_coef_2(exp_2(3)+4:exp_2(4)+3);
TC10 = temp_coef_2(exp_2(4)+4:exp_2(5)+3);

% converting Low temperature coefficient strings to numbers - line2

TC8 = str2num(TC8);
TC9 = str2num(TC9);
TC10 = str2num(TC10);

% getting the Low local temperature coefficient for every element - line3

temp_coef_3 = fgetl(thermo);
exp_3 = findstr(temp_coef_3,'E');
TC11 = temp_coef_3(1:12+3);
TC12 = temp_coef_3(exp_3(1)+4:exp_3(2)+3);
TC13 = temp_coef_3(exp_3(2)+4:exp_3(3)+3);
TC14 = temp_coef_3(exp_3(3)+4:exp_3(4)+3);

% converting Low temperature coefficient strings to numbers - line3

TC11 = str2num(TC11);
TC12 = str2num(TC12);
TC13 = str2num(TC13);
TC14 = str2num(TC14);

% giving T value ranges

T = linspace(Local_low_temp,Local_high_temp,200);
R = 8.314;

% Creating if loop for calculating Cp,H and S
for i=1:length(T)
if T(i)>Local_mid_temp

   % Calculating high temperature specific heat(Cp), Enthalpy(H) & Entropy(S)

    H(i)  = R*T(i)*((TC1) + (TC2*(T(i)/2)) + (TC3*((T(i)^2)/3)) + (TC4*((T(i)^3)/4)) + (TC5*((T(i)^4)/5)) + (TC6/T(i)));
    Cp(i) = R*((TC1) + (TC2*T(i)) + (TC3*(T(i)^2)) + (TC4*(T(i)^3)) + (TC5*(T(i)^4)));
    S(i)  = R*(TC1*log(T(i)) + TC2*T(i) + TC3*((T(i)^2)/2) + TC4*((T(i)^3)/3) + TC5*((T(i)^4)/4) + TC7);
else

    % Calculating low temperature specific heat(Cp), Enthalpy(H) & Entropy(S)

     Cp(i) = R*((TC8) + (TC9*T(i)) + (TC10*(T(i)^2)) + (TC11*(T(i)^3)) + (TC12*(T(i)^4)));
      H(i)  = R*T(i)*(TC8 + TC9*(T(i)/2) + TC10*((T(i)^2)/3) + TC11*((T(i)^3)/4) + TC12*((T(i)^4)/5) + TC13/T(i));
      S(i)  = R*(TC8*log(T(i)) + TC9*T(i) + TC10*((T(i)^2)/2) + TC11*((T(i)^3)/3) + TC12*((T(i)^4)/4) + TC14) ;
end
end

 figure(1)
plot(T,Cp,'linewidth',3,'color','r')
xlabel('Specific Heat')
ylabel('Temperature')
 mkdir(sp_name)
 cd (sp_name)
 saveas(1,'CpvsT_plot.jpeg')
 figure(2)
plot(T,H,'linewidth',3,'color','b')
xlabel('Enthalpy')
ylabel('Temperature')
saveas(2,'HvsT_plot.jpeg')
 figure(3)
plot(T,S,'linewidth',3,'color','m')
xlabel('Entropy')
ylabel('Temperature')
 saveas(3,'SvsT_plot.jpeg')
  cd ..


end
end
Errors

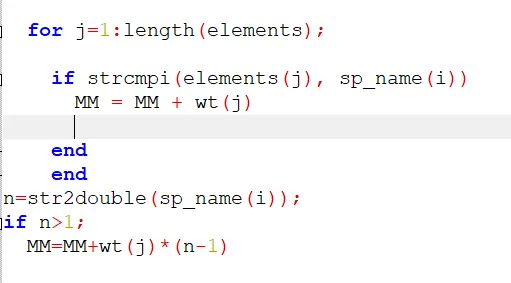
Solution
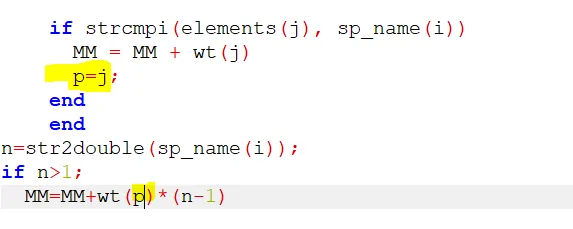
error 2
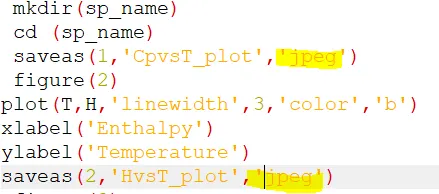
made a seperate format array which didnt work
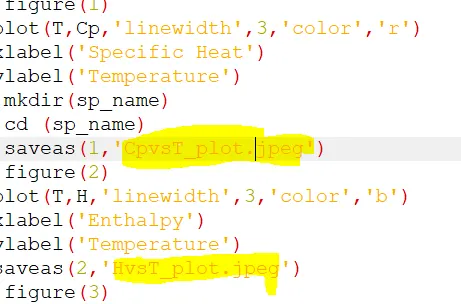
Later correcting it worked