Week 4.1 - Genetic Algorithm
Genetic Algorithm :
it is kind of search based optimization technique based on principle of genetic and natural selection. normally, it is used to solve optimization problems.
Syntex for GA :
ga(@stalagmate, 2, [],[],[],[],[0:0],[0.6:0.6],[],[],options)
ga(fun,nvars,A,b,Aeg,beq,lb,ub,nonlcon, options)
fun = functions
nvars = number of variables
A = linear inequality real matrix
b = linear inequality real vector
Aeq = linear equality real matrix
beq = linear eu=quality real vectors
lb = lower bound
ub = upper bound
nonlcon = non linear function
options = output
Stalagmate function :
function A = stalagmate(input_vector)
x = input_vector(1);
y = input_vector(2);
f1 = (sin(5.1*pi*x+0.5)).^6;
f2 = exp((-4*log(2)*((x-0.0667).^2))/0.64);
f3 = (sin(5.1*pi*y+0.5)).^6;
f4 = exp((-4*log(2))*((y-0.0667).^2)/0.64);
A = -(f1*f2*f3*f4);
end
Matlab program :
%input
x = linspace(0,0.6,150);
y = linspace(0,0.6,150);
num_spaces = 50;

%forming 2D
[xx, yy] = meshgrid(x,y);
for i = 1 : length(x)
    for j = 1 : length(y)
        input_vector(1) = xx(i,j);
        input_vector(2) = yy(i,j);
        f(i,j) = stalagmate(input_vector);
    end
end

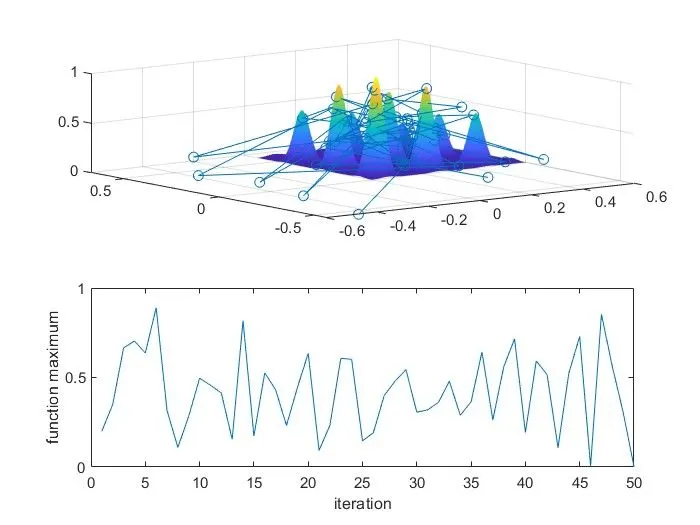
%case1-unbounded
tic
for i = 1 : num_spaces
    [results, fopt(i)] = ga(@stalagmate,2)
    xopt(i) = results(1)
    yopt(i) = results(2)
end
study_time1 = toc
figure(1)
subplot(2,1,1)
surf(x,y,-f)
shading interp
hold on
plot3(xopt, yopt, -fopt, 'marker','o')
subplot(2,1,2)
plot(-fopt)
xlabel('iteration')
ylabel('function maximum')

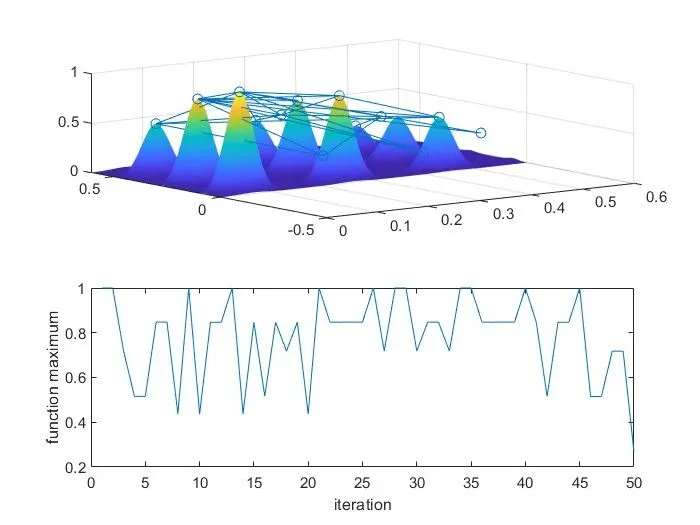
%case2-bounded
tic
for i = 1 : num_spaces
    [results, fopt(i)] = ga(@stalagmate,2,[],[],[],[],[0:0],[0.6;0.6])
    xopt(i) = results(1)
    yopt(i) = results(2)
end
study_time2 = toc
figure(2)
subplot(2,1,1)
surf(x,y,-f)
shading interp
hold on
plot3(xopt, yopt, -fopt, 'marker','o')
subplot(2,1,2)
plot(-fopt)
xlabel('iteration')
ylabel('function maximum')

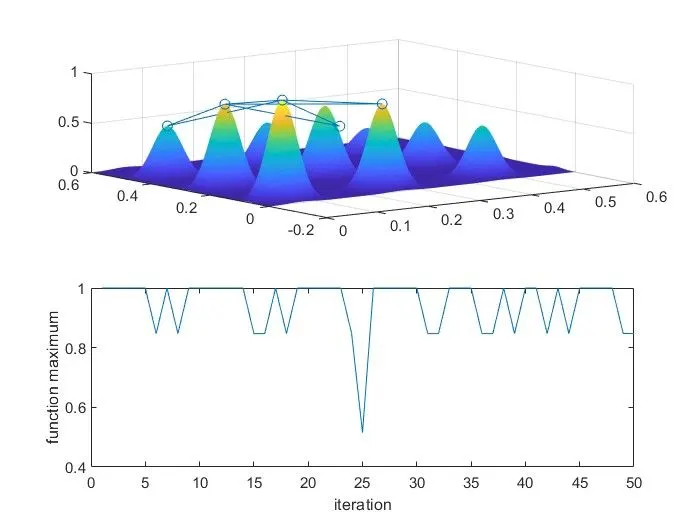
%case3-increase in population
tic
options = optimoptions('ga')
options = optimoptions(options, 'populationsize',250)
for i = 1 : num_spaces
    [results, fopt(i)] = ga(@stalagmate,2,[],[],[],[],[0:0],[0.6:0.6],[],[],options)
    xopt(i) = results(1)
    yopt(i) = results(2)
end
study_time3 = toc
figure(3)
subplot(2,1,1)
surf(x,y,-f)
shading interp
hold on
plot3(xopt,yopt,-fopt,'marker','o')
subplot(2,1,2)
plot(-fopt)
xlabel('iteration')
ylabel('function maximum')
Output :
Reference :