Week 4.1 - Genetic Algorithm
AIM :- Write a code in MATLAB to optimise the stalagmite function and find the global maxima of the function.
OBJECTIVE :-
Using matlab, using global formula and stalagmite function using genetic algorithm to calculate global maxima.
THEORY :-
If a function is continuous on a closed interval, then by the extreme value theorem, global maxima and minima exist. Furthermore, a global maximum (or minimum) either must be a local maximum (or minimum) in the interior of the domain, or must lie on the boundary of the domain.
- Make a list of all values of c, with a≤c≤b, a ≤ c ≤ b , for which. f′(c)=0, f ′ ( c ) = 0 , or. f′(c) does not exist, or. ...
- Evaluate f(c) for each c in that list. The largest (or smallest) of those values is the largest (or smallest) value of f(x) for a≤x≤b.
A global maximum point refers to the point with the largest y-value on the graph of a function when a largest y-value exists. A global minimum point refers to the point with the smallest y-value. ... Global refers to the entire domain of the function. Global extrema are also called absolute extrema.
Global maxima or minima of f(x) in [a, b] is basically the greatest or least value of f(x) in [a, b]. Mathematically, it is written as: The function f(x) has a global maximum at the point 'a' in the interval I if f (a) ≥f(x), for all x∈I.
To find the global maxima and minima in (a, b) step 1 and 2 is same but after that we have to be a bit careful. After step 1 and 2 find
M1 =max{ f(C1), f(C2)………..f(Cn)} and M2= min{f(C1), f(C2)………..f(Cn)}.
Optimization Processes :-
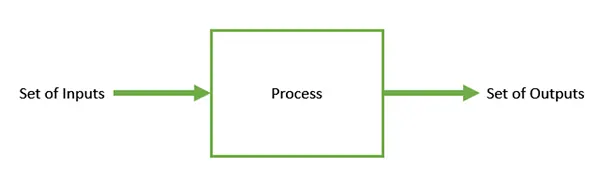
Optimization is the process of making something better. In any process, we have a set of inputs and a set of outputs as shown in the following figure.
GENETIC ALGORITHM :-
A global maximum, also known as an absolute maximum, the largest overall value of a set, function, etc.
over its entire range. It is impossible to construct an algorithm that will find a global maximum for an arbitrary function.
- Scores each member of the current population by computing its fitness value. ...
- Scales the raw fitness scores to convert them into a more usable range of values. ...
- Selects members, called parents, based on their expectation.
x = ga(fun,nvars,A,b,Aeq,beq,lb,ub)
lb is used for lower point
ub is used for upper point.
SYNTAX :-
[inputs, fopt(i)]= ga(@stalagmite, 2);
xopt(i) =inputs(1);
yopt(i) =inputs(2);
Ga is used for the genetic algorithm it is used to calculate the population in a specific area
with the help of ga and stalagmite function we able to draw a polynomial hole on the xx,yy coordinate
and the gap given from the one polynomial to the other.
STOPPING CRITERIA :-
Stopping criteria refers to conditions that must be reached in order to stop the execution of the algorithm.
Some of the most common stopping conditions are: execution time, total number of iterations, non-improving iterations,
optimal (lower bound for min, upper bound for max) solution found, etc.
To stop the execution of the program some time if we forget to give ; to the coding lines to not shown in the command window
if the calculation taking high time and in finding errors if the errors are find high.
Stop command is present besid to the the run command with the help of stop command program will stop.

SIGNIFICANCE OF RUNNING MULTIPLE ITERATIONS :-
The most beifited significance of running multiple iterations in the same editor (The iterations of a collection run reflect many times
the collection will run. Here we have3 iterations to run. window isto not confused ) to stored and look again and again change the
window to see the code.
In study1time
Iteration
In study2time
Iteration
In study3time
Iteration.
STALAGMITE FUNCTION :-
f1,x = is the function for x.
f1,y = is the function for y.
f2,x = is the function for x.
f2,y = is the function for y.
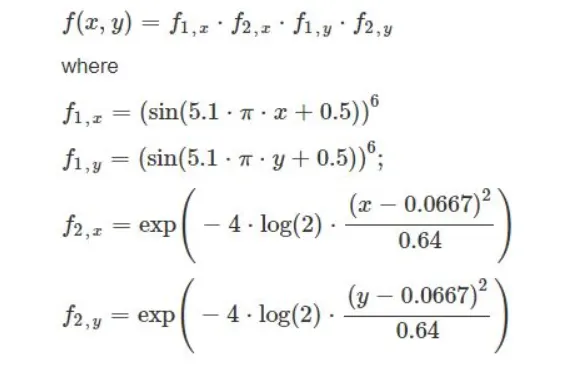
STALAGMITE FUNCTION
function f= stalagmite(input_vector)
        x= input_vector(1);
        y= input_vector(2);
x1= (sin((5.1*pi*x)+0.5))^6;
y1= (sin((5.1*pi*y)+0.5))^6;
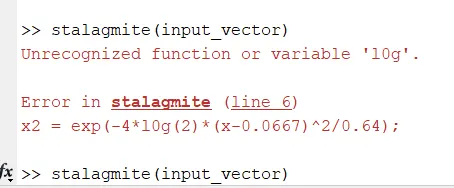
x2 = exp(-4*log(2)*(x-0.0667)^2/0.64);
y2 = exp(-4*log(2)*(y-0.0667)^2/0.64);
f= -(x1*x2*y1*y2);
end
MAIN PROGRAM
clear all
close all
clc

%defining search space
x= linspace(0,0.6,150);
y= linspace(0,0.6,150);

%from 1D to 2D array
[xx yy]= meshgrid(x,y);


%Evaluate the stalagmite function
for i= 1:length(xx)
  for j= 1:length(yy)
      input_vector(1)=xx(i,j);
      input_vector(2)=yy(i,j);
      f(i,j)= stalagmite(input_vector);
    end
end

surfc(xx,yy,-f)
shading interp

[x, fval]= ga(@stalagmite, 2)
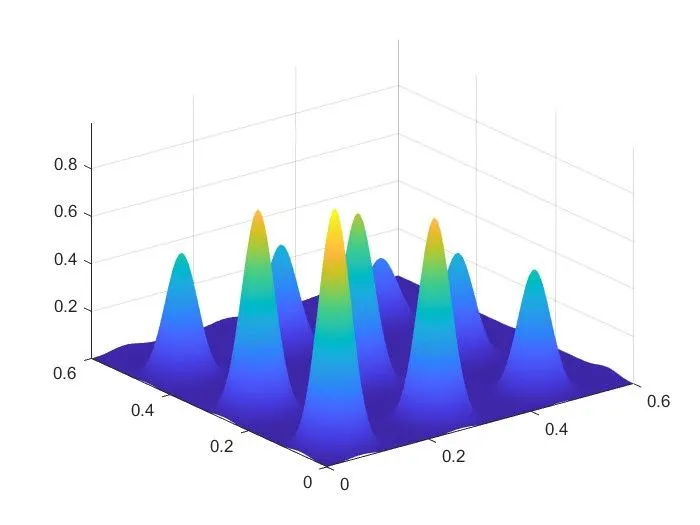
figure:- for negative stalagmite function( with positive value on y-axis).
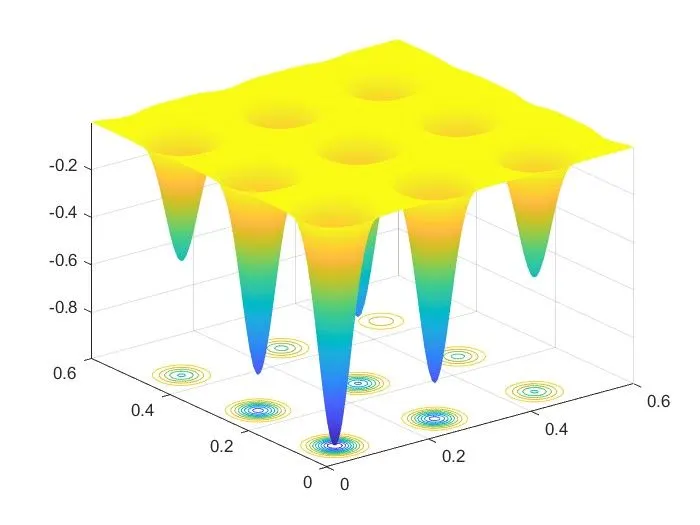
figure:- for positive stalagmite function( with negative value on y-axis).
To reverse the figure used -f to change the coordinate axis - to positive.
The values are in negative for the y-axis then it will reverse and change to positive.
MAIN PROGRAM (PROGRAM FOR STUDY-1, STUDY-2, STUDY-3 )
clear all
close all
clc

%defining search space
x= linspace(0,0.6,150);
y= linspace(0,0.6, 150);
[xx yy]= meshgrid(x,y);
num_cases = 50

for i=1:length(xx)
    for j=1:length(yy)
        input_vector(1)= xx(i,j);
        input_vector(2)= yy(i,j);
        f(i,j)=stalagmite(input_vector);
    end
end


%To study 1 - statitical behavior
tic
for i =  1:num_cases
    [inputs, fopt(i)]= ga(@stalagmite, 2);
    xopt(i) =inputs(1);
    yopt(i) =inputs(2);

end
study1_time = toc
%figure(1) for genetic algorithm
figure(1)
subplot(2,1,1)
hold on
surfc(x,y,-f)
shading interp
plot3(xopt,yopt,-fopt, 'markersize',5 , 'markerfacecolor', 'r')
title('Unbounded inputs')
subplot(2,1,2)
plot(fopt)
xlabel('Iterations')
ylabel('function maximum')

%study upper and lower bound
tic
for i=1:num_cases
    [inputs fopt(i)]= ga(@stalagmite,2,[],[],[],[],[0,0],[1,1]);
    xopt(i)= inputs(1);
    yopt(i)= inputs(2);
end
study2time= toc

figure(2)
subplot(2,1,1)
hold on
surfc(x,y,-f);
shading interp
plot3(xopt,yopt,-fopt,'marker','o','markersize',5, 'markerfacecolor', 'r')
title('bounded inputs');
subplot(2,1,2)
plot(-fopt)
xlabel('iterations')
ylabel('function maximum')


%study 3- iterations
options= optimoptions('ga');
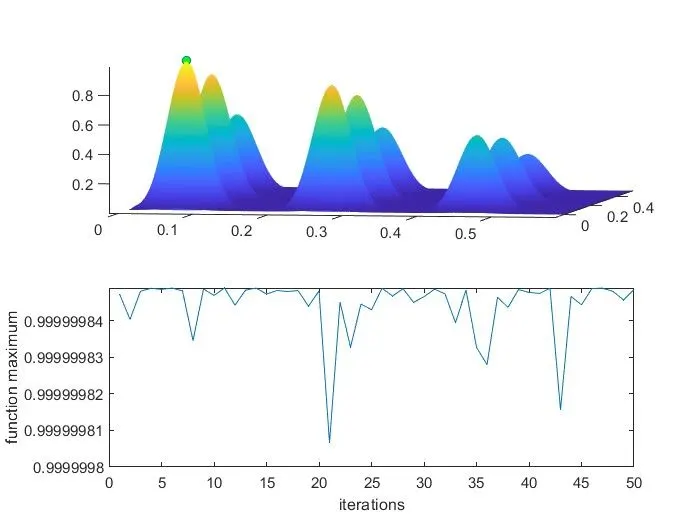
options= optimoptions(options, 'populationsize',500)

tic
for i=1:num_cases
    [inputs,fopt(i)]= ga(@stalagmite,2,[],[],[],[],[0,0],[1;1],[],[],options)
    xopt(i)= inputs(1);
    yopt(i)= inputs(2);
end
study3time=toc

%plot
figure(3)
subplot(2,1,1)
hold on
surfc(x,y,-f)
shading interp
plot3(xopt,yopt,-fopt,'marker','o','MarkerSize',5, 'MarkerFaceColor','g')
subplot(2,1,2)
plot(-fopt)
xlabel('iterations')
ylabel('function maximum')
Figure (1)
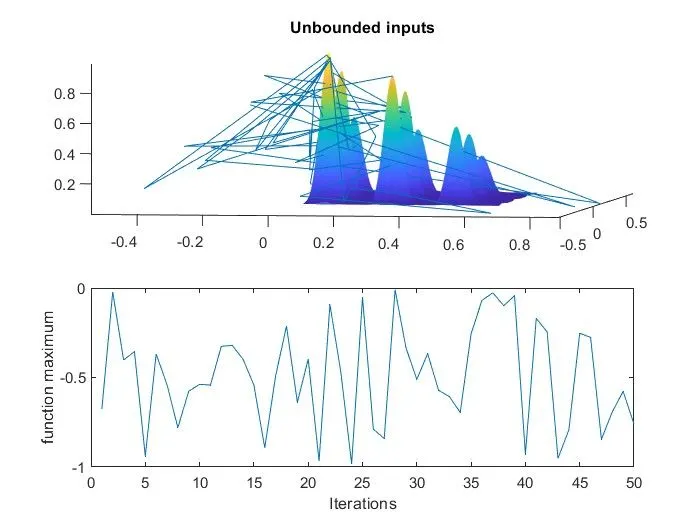
Figure (2)
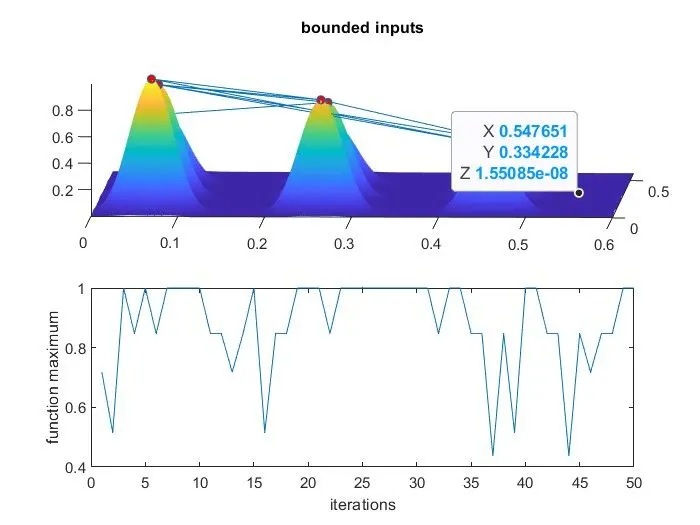
Figure (3)
Result explanation :-
Explanation
To reverse the figure used -f to change the coordinate axis - to positive.
The values are in negative for the y-axis then it will reverse and change to positive.
Ga is used for the genetic algorithm it is used to calculate the population for local minima
or maximum minima.
In study1time
Iteration
In study2time
Iteration
In study3time
Iteration.
ERRORS FACING WHILE EXECUTION AND OVERCOME :-
1) Unrecognized variable f
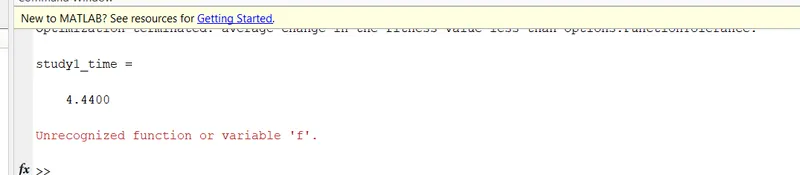
Then mention after the finding error.
2) must call TIC line before the TOC.
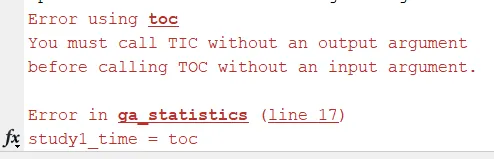
corrected the line no 17.
3) l0g-----> to------> log.
REFERENCES :-
1) Matlab.
2) google.
2) mat search.
3) skill-lync.