Project 1 - Parsing NASA thermodynamic data
AIM :- Write a function that extracts the 14 co-efficients and calculates the enthalpy, entropy and specific heats for all the species in the data file.
OBJECTIVES :-
1) Isto write the program put to use with the help of matlab, in the Matlab.
2) Plot the graph as according to the given avail in the above data with the help of matlab.
3) Screenshot of the window where all the folders are saved.
4) Plots for o2, N2 and Co2 species (your program should be case insensitive, if it is going to take the species name as an input).
THEORY :-
1)Calculate the molecular weight of each species
x= atomicity
y=atomic weight
Molecular weight= atomic weight*atomicity.
Here, R is the real gas constant,
T is the temperature
cp is the specific heat [k].
H is the Enthalpy [KJ/Kmol-k].
S is the Entropy [KJ/mol].
Specific heat :
Entropy :
Enthalpy :
a1= first coefficient.
a2= second coefficient.
a3= third coefficient.
a4= fourth coefficient.
a5= fifth coefficient.
a6= sixth coefficient.
a7= seventh coefficient.
STEPS:-
1) Firstly, we will input the parameter R and we will open a file THERMo.dat file and reading this file using fopen command.
2) Then,we will read first THERMO using fgetl coomand and then we read temperature file and we will split the temperatures ausing strsplit command to convert it into cell array then we will convert this string to number using str2num command to find low, high and mid temperatures.
3) Then we will assign temperature range using linspace command. Then we run loop to skip command lines the data file using fgetl command inside the loop.
4) Now,we will run the loop to find 53 element in the data file by assigning fgetl command and then spliting into the cell array to find the species line and then find the species name and then find the number of the temperatures in the species line.
5) Then we read the new line. In order to read the coefficient in the data file we will first find the 'E' string using strfind command to find before and after numbers of the coefficients then we will find remaining 14 coefficients and convert them to numbers from strings.
6) Out of which we will find the first 7 coefficients which are for higher temperature and then second 7 coefficients which are for lower temperature.
7) Now we will specify specific heat cp, Entrop S, Enthalpy H functions to find these parameters using these 14 coeffients for lower and higher temperature. then we wil specify molecular weight W function to find the molecular weight of the different species.
Main Program :-
clear all
close all
clc


%input
%Universal gas constant
R= 8.314;

%for line no 7
tline = '2.56942078E+00-8.59741137E-05 4.19484589E-08-1.00177799E-11 1.22833691E-15    2'
tline(7)

%for reading thermodynamic file 'r'
f1= fopen('THERMO.dat', 'r');
fgetl(f1);

%Now reading Temperature from this file
temp=fgetl(f1);

%spliting
s=strsplit(temp);

%local temperature range for each species


%strings to numbers


%temp range

%Ignor the first 3 comment lines
for i=1:3
    get=fgetl(f1);
end

 %reading the species
for j=1:53

tline1= fgetl(f1);
Q= strsplit(tline1, ' ')
element_name=Q{1};
templow= str2num(Q{end-3});
temphigh=str2num(Q{end-2});
tempmid= str2num(Q{end-1});

T=linspace(templow,temphigh,500);

tline2= fgetl(f1)
A= strfind(tline2,'E');

tline3= fgetl(f1)
B= strfind(tline3,'E');

tline4= fgetl(f1)
C= strfind(tline4,'E');

%for finding 14 coefficient
a1= str2num(tline2(1:A(1)+3));
a2= str2num(tline2(A(1)+4:A(2)+3));
a3= str2num(tline2(A(2)+4:A(3)+3));
a4= str2num(tline2(A(3)+4:A(4)+3));
a5= str2num(tline2(A(4)+4:A(5)+3));

a6= str2num(tline3(1:B(1)+3));
a7= str2num(tline3(B(1)+4:B(2)+3));

a8= str2num(tline3(B(2)+4:B(3)+3));
a9= str2num(tline3(B(3)+4:B(4)+3));
a10= str2num(tline3(B(4)+4:B(5)+3));
a11= str2num(tline4(1:C(1)+3));
a12= str2num(tline4(C(1)+4:C(2)+3));
a13= str2num(tline4(C(2)+4:C(3)+3));
a14= str2num(tline4(C(3)+4:C(4)+3));


%calculate specific heat, enthalp, entropy
cp= specific_heat(a1,a2,a3,a4,a5,a8,a9,a10,a11,a12,T,R,tempmid);
H= Enthalpy(a1,a2,a3,a4,a5,a6,a8,a9,a10,a11,a12,a13,T,R,tempmid);
S= Entropy(a1,a2,a3,a4,a5,a7,a8,a9,a10,a11,a12,a14,T,R,tempmid);

%calcute molecular weight
W= molecular_weight(element_name);

%writing molecular wt file
fprintf('Molecular weight %s = %f',element_name,W)

%plot the graph

mkdir(element_name);
cd(element_name);

%plot 1 c_p vs T
figure(1)
plot(T,cp,'linewidth',2,'color','b')
xlabel('Temperature(k)');
ylabel('specific heat(KJ)');
title(sprintf('specific heat vs Temperature range of %s', element_name));
grid on
saveas(figure(1), 'specific heat.jpg');

%plot2 S vs T
figure(2)
plot(T,S,'LineWidth',2,'Color','r');
xlabel('Temperature(k)');
ylabel('Enthalpy(KJ/mol)');
title(sprintf('Enthalpy vs Temperature range of %s', element_name));
grid on
saveas(figure(2), 'Enthalpy.jpg');

%plot3 S vs T
figure(3)
plot(T,S,'LineWidth',2,'Color','g');
xlabel('Temperature(k)');
ylabel('Entropy(KJ/mol-K)');
title(sprintf('Entropy vs Temperature range of %s', element_name));
grid on
saveas(figure(3), 'Entropy.jpg');

cd ..

%Molecular weight

end
STEPS :-
1) Firstly we create an Molecular_weight function W and assigning species input to that.
2) Then define the main element of all 53 species in an array atomic_name that are :- 'H','C','O','N','Ar'.
3) Then by taking above main elements we will create their atomic_weight array from any source like the internet that are :- 1.008 12.011015.999 14.007039.948.
4) Then we will assign molecular starting range W to zero and then create an for loop condition which runs to the length of the species and an another nested for loop is created which run to the length of the string atomic_name.
5) Then we will create an condition using if condition and use strcmp command to compare the species and atomic_name strings to calculate molecular masses if by comparison both string found same then we will assign its molecular weight.
6) Now, we will string to the number using str2num command assign to n. Then we run an cindition of if loop to find weather the species contains more than one element if there are more then 1 elements that is n>1 then we will increment the atomic weight by the multiplication of position and n-1 to the atomic_weight array.
7) Then we will print the molecular weight usng fprintf command and display it using disp command.
function program for specific heat :-
function cp= specific_heat(a1,a2,a3,a4,a5,a8,a9,a10,a11,a12,T,R,tempmid)
if (T <=tempmid)
    cp=R*(a8+(a9*T)+(a10*(T).^2)+(a11*(T).^3)+(a12*(T).^4));
else
    cp= R*(a1+(a2*T)+(a3*(T).^2)+(a4*(T).^3)+(a5*(T).^4));
end
end
Steps :
In function loop we need to writte a specific heat and gives the T is <=tempmid
for second coefficient value
else for
1st coeffiecient value.
function program for entropy :-
function S = Entropy(a1,a2,a3,a4,a5,a7,a8,a9,a10,a11,a12,a14,T,R,tempmid)
if (T<=tempmid)
    S= R*(a8.*log(T)+a9*T+a10*T.^2/2+a11*T.^3/3+a12*T.^4+a14);
else
    S= R*(a1.*log(T)+a2*T+a3*T.^2/2+a4*T.^3+a5*T.^4/4+a7);
end
Steps :
In function loop we need to writte a Entropy and gives the T is <=tempmid
for second coefficient value
else for
1st coeffiecient value.
function program for enthalpy :-
function H= Enthalpy(a1,a2,a3,a4,a5,a6,a8,a9,a10,a11,a12,a13,T,R,tempmid)
if(T<=tempmid)
    H= R*T.*(a8+((a9*T)/2)+((a10*(T).^2)/3)+((a11*(T).^3/4))+((a12*(T).^4)/5)+((a13./T)));
else
    H= R*T.*(a1+((a2*T)/2)+((a3*(T).^2)/3)+((a4*(T).^3)/4)+((a5*(T).^4)/5)+((a6./T)));
end
end
Steps :
In function loop we need to writte a Enthalpy and gives the T is <=tempmid
for second coefficient value
else for
1st coeffiecient value.
function W= molecular_weight(species)
atomic_name= ['H','C','O','N','Ar'];
atomic_weight= [1.00784,12.0107,15.999,14.0067,39.948];
W= 0;
for i=1:length(species)
    for j=1:length(atomic_weight)
        if species(i)==atomic_name(j)
            W=W+atomic_weight(j)
            position=j
        end
    end
    n= str2num(species(i))
    if n>1
        W=W+atomic_weight(position)*(n-1)
    end
end
end
Different species are saved(saved location) :

Output of molecular weight:-
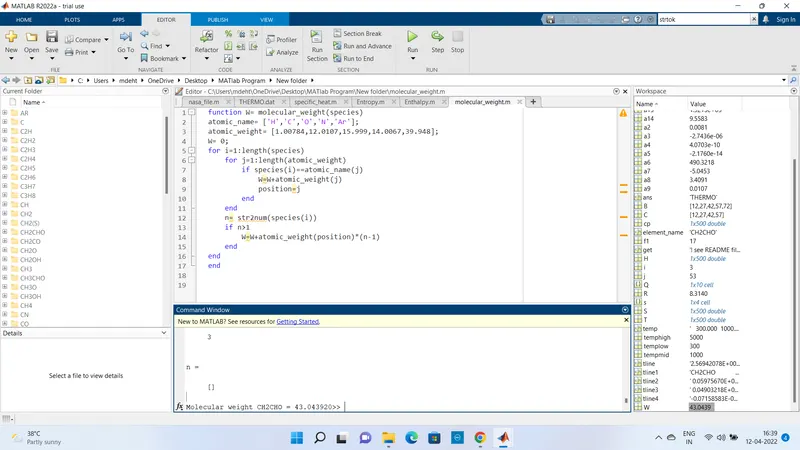
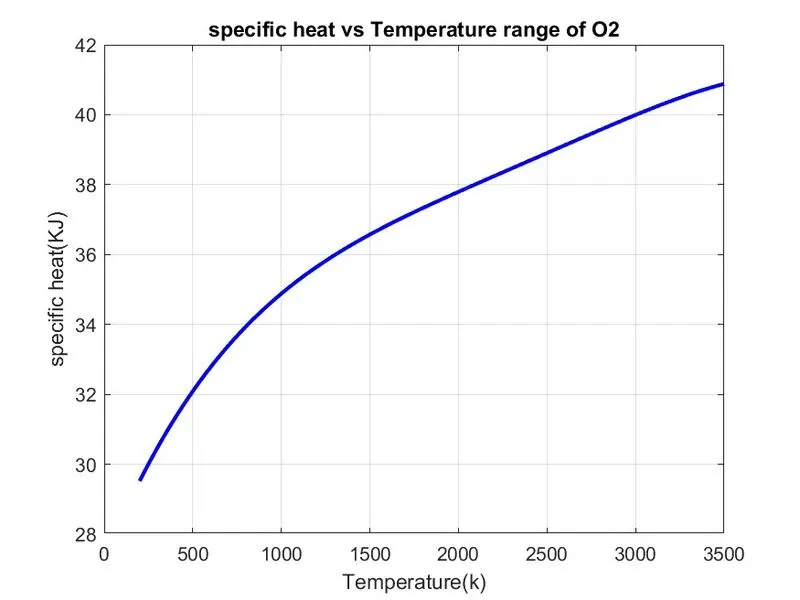
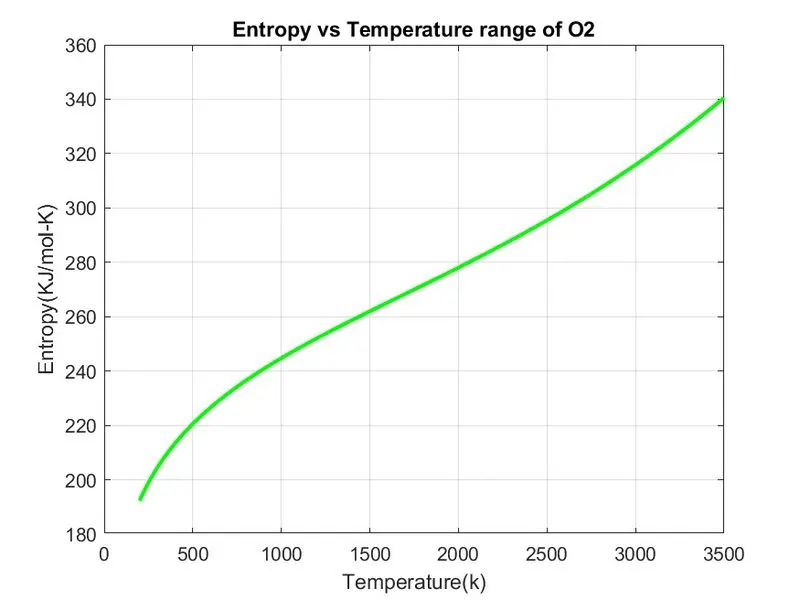
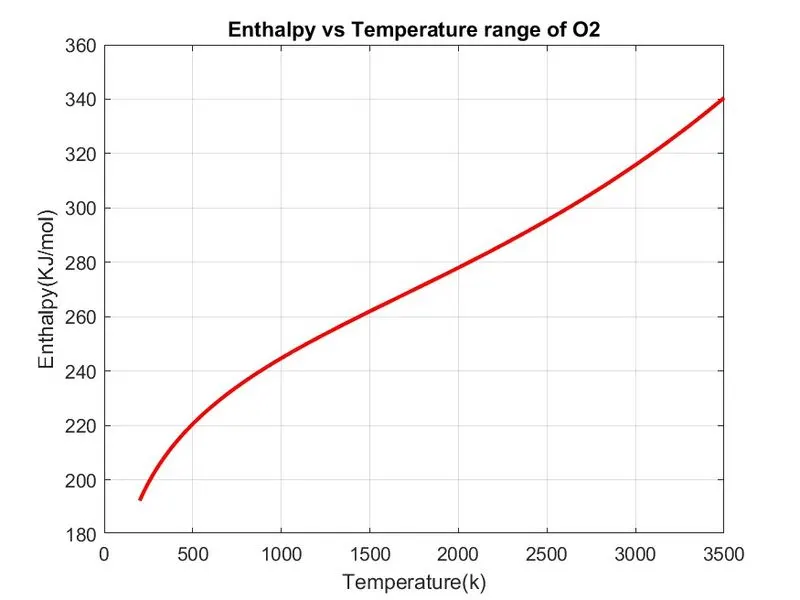
Plotted graph for O2
Plotted graph for N2 :
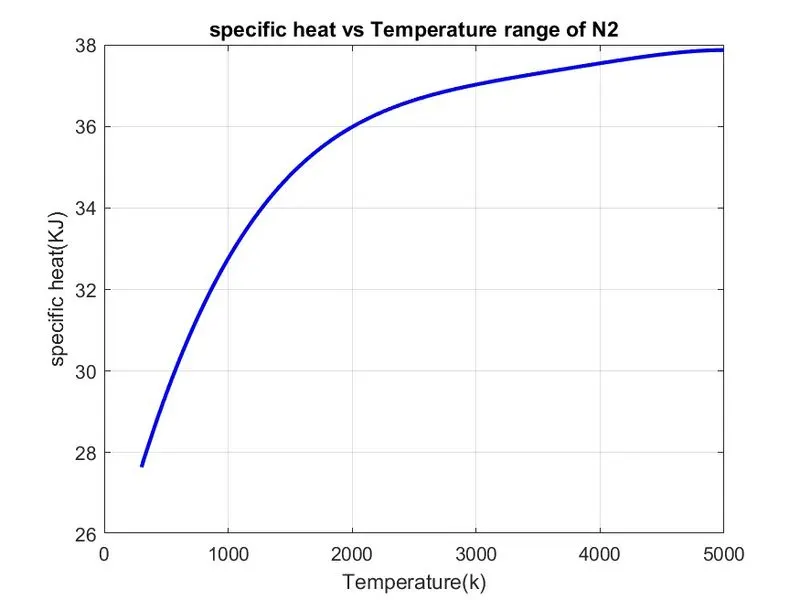
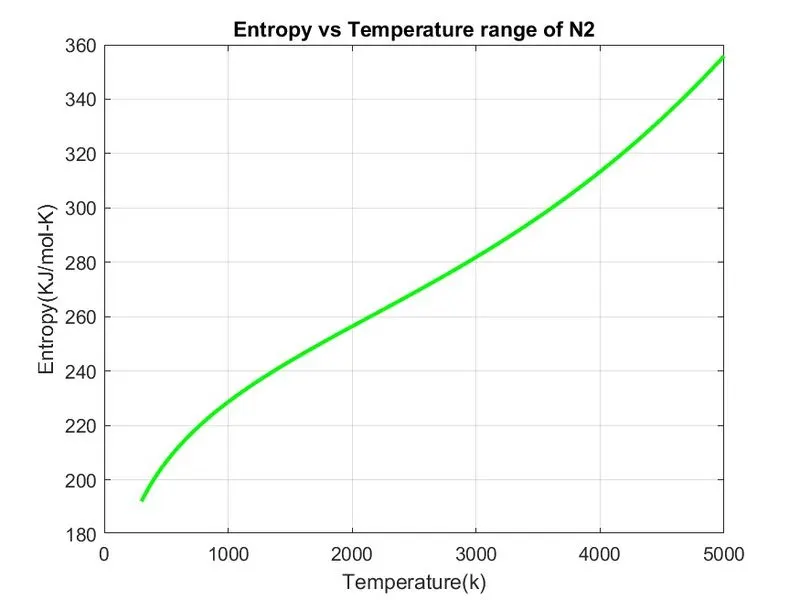
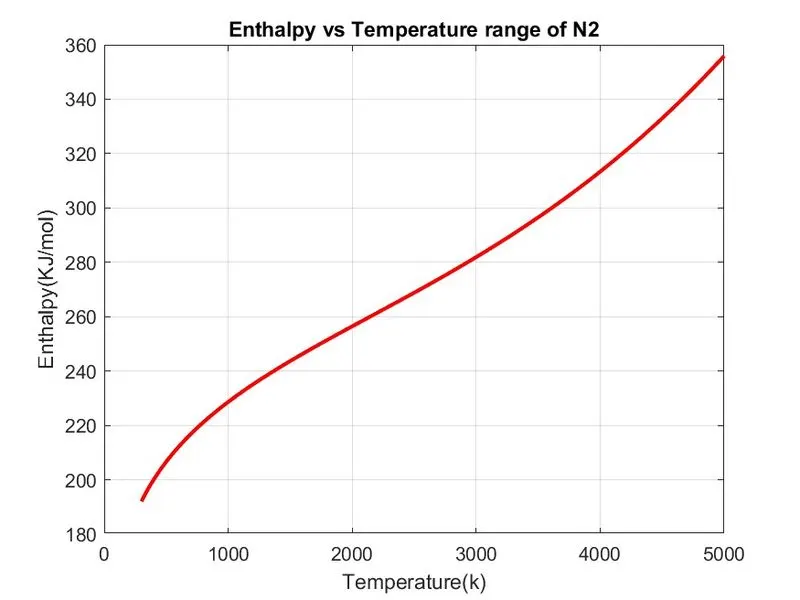
Plotted graph for CO2 :
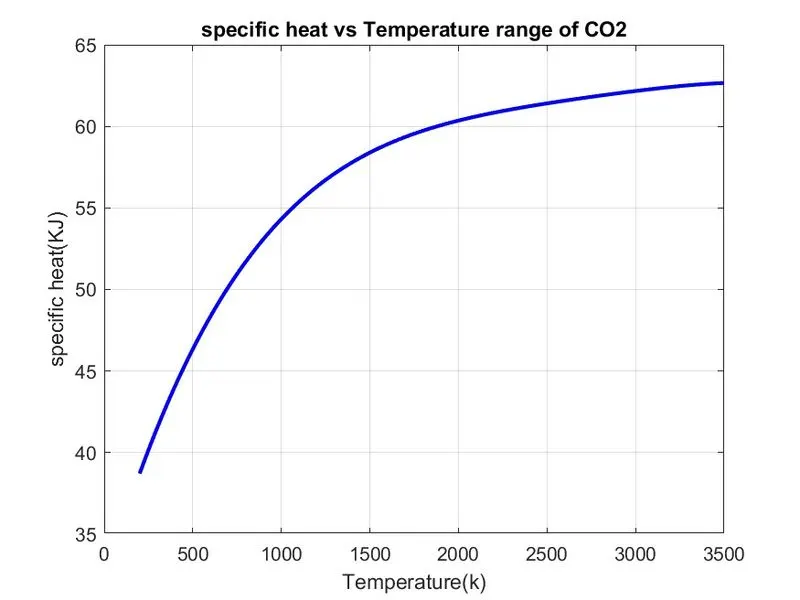
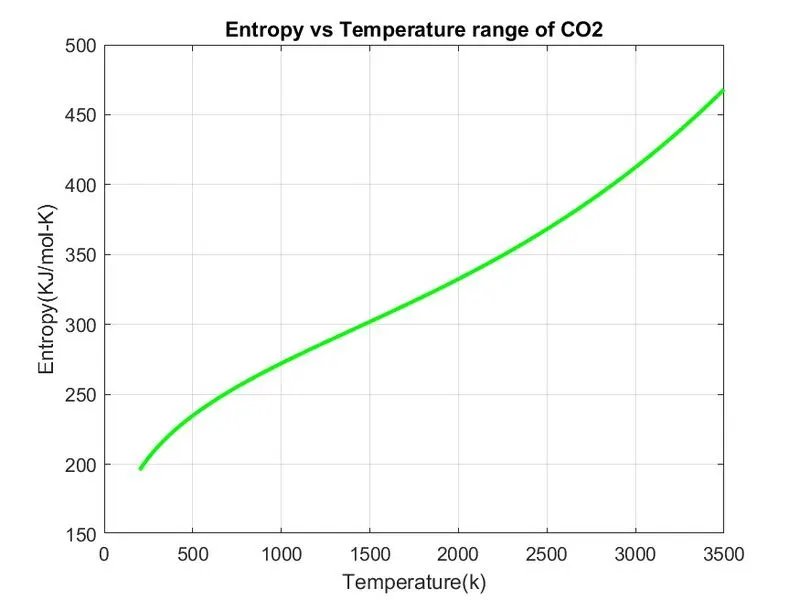
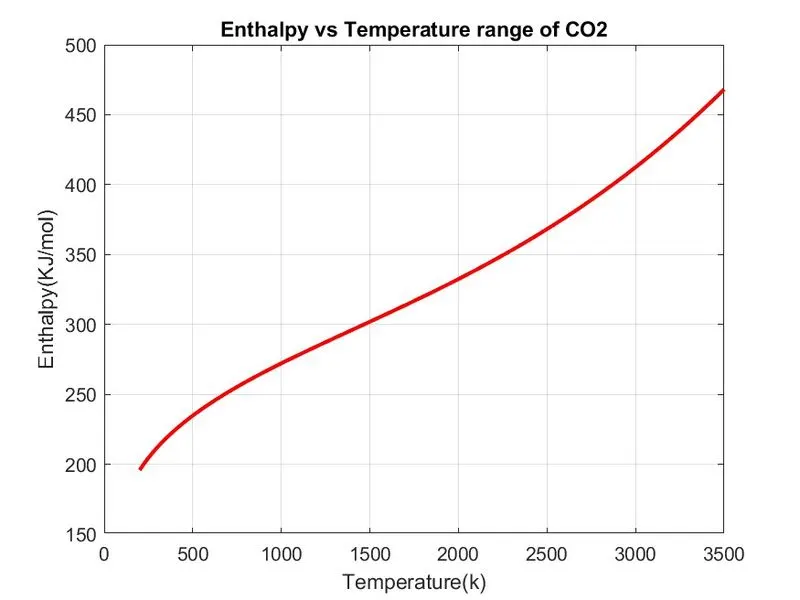
These the graphs are varies according to the values varies as u seen above figures.