Week 4.1 - Genetic Algorithm
MATLAB code for the function of stalagmite function which i have used in this all programme.
This function code should save in the same directory where the MATLAB all other code is to be saved.
In our case, the stalagmite function acts as the fitness function given by,
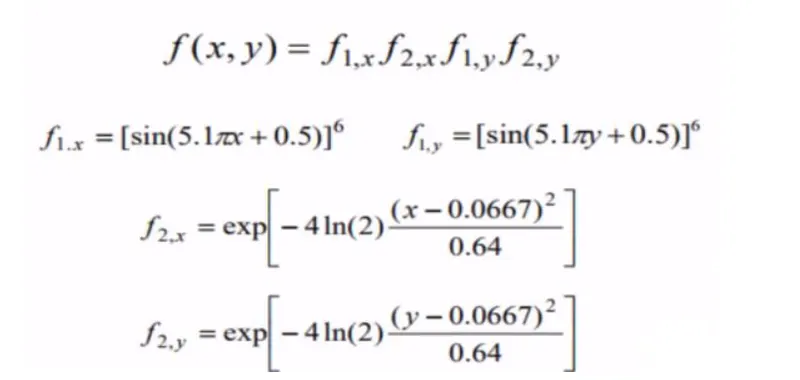
for this stalagmite equation the MATLAB code is given below.
function [f] = stalagmite(input_vector)

x = input_vector(1);
y = input_vector(2);

f1x = (sin(5.1*pi*x+0.5))^6;
f1y = (sin(5.1*pi*y+0.5))^6;
f2x = exp(-4*log(2)*(((x-0.0667)^2)/0.64));
f2y = exp(-4*log(2)*(((y-0.0667)^2)/0.64));

f = -1*(f1x*f2x*f1y*f2y);

end
now using the ga function which is inbuilt in MATLAB . using this function we can find the values of global minima.
here in the below code i have find the values for global maxima using the ga function.
clear all
close all
clc

%Defining our search space
x = linspace(0,0.6,150);
y = linspace(0,0.6,150);

%Creating a 2Dimensional mesh
[xx yy] = meshgrid(x,y);

%Evaluating the stalagmite function
for i = 1:length(xx)
    for j = 1:length(yy)
    input_vector(1) = xx(i,j);
    input_vector(2) = yy(i,j);
    f(i,j) = stalagmite(input_vector);
    end
end

surfc(xx,yy,-f)
xlabel('xvalue')
ylabel('yvalue')

shading interp
[inputes,fval] = ga(@stalagmite,2)
here, in the above code i use the first syntax for ga function. and using this function i have run the programme for the global maxima. but here, i cann't get the exact values or a single point for the global maxima. so, i have applied another syntax for finding the point or values of the global maxima.
here , in the above code first we create 2dimentional mesh using meshgrid command. and after that evaluating the stalagmite function and where i use the for loop for different values of inputs. and i use the inputs for stalagmite function.
now, using surfc command i have plotting the 3d plot.
and using stalagmite first syntex x = ga(fun,nvars) which finds a local unconstrained minimum. here,fun is the fuction which i have used(in our case we use the stalagmite), nvars is the dimenstions(no of design variables).
also I have used the negative sign in the plot command for value of f.because if we use the positive sign i have get the values for global minima. but if i am using the negative sign i have inverse the plot and we get the values for global maxima.
here we get the resultant plot as below:
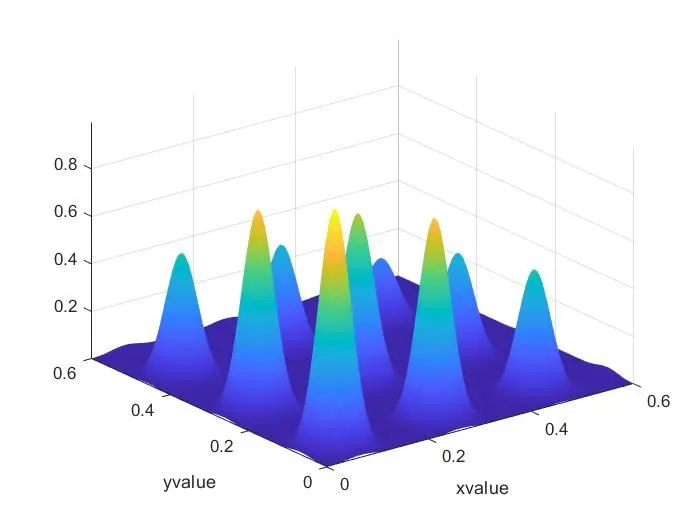
But this is not the answer What am i expecting.
So, I have use the another syntex of the ga function for the finding the values or exact point for the global Maxima.
which i have explain in below and also i have write the programme for that as well in result in the below.
Code for the Global Maxima with Bounded inputs with modified population size:
clear all
close all
clc

x = linspace(0,0.6,150);
y = linspace(0,0.6,150);
num_cases = 50
%Creating a 2Dimensional mesh
[xx yy] = meshgrid(x,y);

%Evaluating the stalagmite function
for i = 1:length(xx)
    for j = 1:length(yy)
    input_vector(1) = xx(i,j);
    input_vector(2) = yy(i,j);
    f(i,j) = stalagmite(input_vector);
    end
end


options = optimoptions ('ga')
options = optimoptions (options,'populationsize',400);

tic
for i = 1:num_cases
    [inputs,fopt(i)] = ga(@stalagmite,2,[],[],[],[],[0;0],[0.6;0.6],[],[],options);
    xopt(i) = inputs(1);
    yopt(i) = inputs(2);
end
study3_time = toc
figure(3)
subplot(2,1,1)
hold on
surfc(x,y,-f)
shading interp
plot3(xopt,yopt,-fopt,'marker','o','markersize',5,'markerfacecolor','r')
title('Bounded inputs with modified population size')
subplot(2,1,2)
plot(-fopt)
xlabel ('Iteraction')
ylabel ('Function maximum')
here in the above code i have used the sytax of ga function is:
x = ga(fun,nvars,A,b,[],[],lb,ub,nonlcon,IntCon,options)
where in this function i have used lower bounding limit as [0;0] and upper bounding limit as [0.6;0.6] and for other all inputs i have used [].
now when i am going to run this above code, i have found the plot as below shown figure:
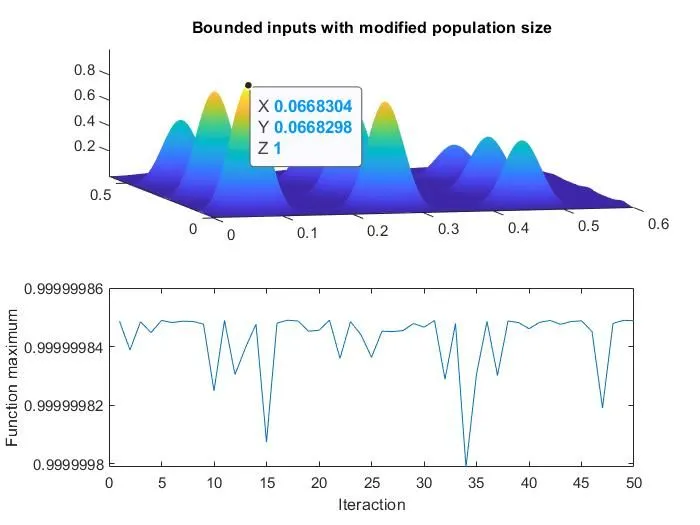
here, from the above graph we can see the exact point where the global maxima is found.
here the value for global maxima is x=0.0668325,y=0.066828 and z=0.99999 which is nearest 1.
so using the above code and function we find the global maxima.
Concept of genetic algorithm:
A genetic algorithm is a search heuristic that is inspired by Charles Darwin's theory of natural evolution.The genetic algorithm is one such optimization algorithm built based on the natural evolutionary process of our nature.Genetic algorithms are based on the ideas of natural selection and genetics. These are intelligent exploitation of random search provided with historical data to direct the search into the region of better performance in solution space. They are commonly used to generate high-quality solutions for optimization problems and search problems.
The genetic algorithm is based on the genetic structure and behavior of the chromosome of the population. The following things are the foundation of genetic algorithms.
- A fitness function characterizes each individual in the population. Therefore, greater fitness better is the solution.
- Out of the available individuals in the population, the best individuals are used to reproduce the next generation offsprings.
There are five phases of genetic algorithm:
1)Initial population:
The process begins with a set of individuals which is called a population. and each individual is a solution to the problem you want to solve. here, an individual is characterized by a set of parameters known as Genes.Genes are joined into a string to form a chromosome. usually, binary values are used string of 1s and 0s.
2)Fitness Function:
We have to select the best ones to reproduce offspring out of the available chromosomes, so each chromosome is given a fitness value. The fitness score helps to select the individuals who will be used for reproduction.
3)Selection:
The idea of selection phase is to select the fitness individuals and let them pass their genes to the next generation. Two pairs of individuals are selected based on their fitness scores. Individuals with high fitness have more chance to be selected for reproduction.
4)Reproduction:
Generation of offsprings happen in 2 ways:
- Crossover: crossover is the most significant phase in a genetic algorithm.During crossover, a random point is selected while mating a pair of parents to generate offsprings. Offspring are created by exchanging the gens of parants among themselves until the crossover point is reached. The new offspring are then added to the population.
- Mutation: In a few new offspring formed, some of their genes can be subjected to a low random probability mutation. This indicates that some of the bits in the bit chromosome can be flipped. Mutation happens to take care of diversity among the population and stop premature convergence.
5)Convergens:
When there is no improvement in the solution quality after completing a certain number of generations set beforehand. When a hard and fast range of generations and time is reached. Till an acceptable solution is obtained.
Now, I am going to explain the Syntax for GA in MATLAB:
x = ga(fun,nvars) which finds a local unconstrained minimum x. where,fun is the objective function & nvars is the number of design variables of fun.
x = ga(fun,nvars,A,b) which finds a local minimum x to fun, subject to the linear inequalities A*x<=b.
x = ga(fun,nvars,A,b,Aeq,beq) which finds a local minimum x to fun, subject to the linear equalities Aeq*x = beq and A*x<=b.(Set A=[] and b=[] if no liniear inequalities exit.)
x = ga(fun,nvars,A,b,Aeq,beq,lb,ub) which defines a set of lower and upper bounds on the design variables x, so that a solution is found in the range lb<=x<=ub.(Set Aeq = [] and beq = [] if no linear equalities exists.)
x = ga(fun,nvars,A,b,Aeq,beq,lb,ub,nonlcon) which subjects the minimization to the constraints defined in nonlcon. The function nonlcon accepts x and returns vectors c and Ceq, representing the nonlinear inequalities and equalities respectively. ga minimizes the fun such that c(x)<=0and Ceq(x)=0.(Set lb = [] and ub = [] if no bounds exist.)
x = ga(fun,nvars,A,b,Aeq,beq,lb,ub,nonlcon,options) in which minimizes with the default optimization parameters replaced by values in options. (Set nonlcon = [] if no nonlinear constraints exist.)
x = ga(fun,nvars,A,b,Aeq,beq,lb,ub,nonlcon,intcon)
x = ga(fun,nvars,A,b,Aeq,beq,lb,ub,nonlcon,intcon,options).
Now, using this syntax i am going to study 3 condition and make a programm for plotting for that all three cases with explainations.
Three Case Studies for GA .
now in the below code is for different three case studies and also plotting their values :
case 1) Statistical behaviour without bounds
case 2) Statistical behaviour with bounds
case 3) Statistical behaviour with bounds and a larger population
clear all
close all
clc

%defining our search space and iterations
x = linspace(0,0.6,150);
y = linspace(0,0.6,150);
%number of iterations
num_cases = 50
%Creating a 2Dimensional mesh
[xx yy] = meshgrid(x,y);

%Evaluating the stalagmite function
for i = 1:length(xx)
    for j = 1:length(yy)
    input_vector(1) = xx(i,j);
    input_vector(2) = yy(i,j);
    f(i,j) = stalagmite(input_vector);
    end
end


tic
% study 1 - statistical behavior without Bounds

%finding maximum value for each iteration
for i = 1:num_cases
    %calling genetic algorithm function
    [inputs,fopt(i)] = ga(@stalagmite,2);
    xopt(i) = inputs(1);
    yopt(i) = inputs(2);
end
study1_time = toc
%creating subplot to have 2 plots in same figure
figure(1)
subplot(2,1,1)
hold on
%inverting stalagmite for maximum value
surfc(x,y,-f)
shading interp
plot3(xopt,yopt,-fopt,'marker','o','markersize',5,'markerfacecolor','r')
title('Unbounded inputs')
subplot(2,1,2)
plot(-fopt)
xlabel ('Iteraction')
ylabel ('Function maximum')


tic
% study 2 - statistical behavior - with upper and lower bounds

for i = 1:num_cases
    %setting bounded inputs in genetic algorithm function
    [inputs,fopt(i)] = ga(@stalagmite,2,[],[],[],[],[0;0],[0.6;0.6]);
    xopt(i) = inputs(1);
    yopt(i) = inputs(2);
end
study2_time = toc
figure(2)
subplot(2,1,1)
hold on
surfc(x,y,-f)
shading interp
plot3(xopt,yopt,-fopt,'marker','o','markersize',5,'markerfacecolor','r')
title('Bounded inputs')
subplot(2,1,2)
plot(-fopt)
xlabel ('Iteraction')
ylabel ('Function maximum')


% study 3 - increasing GA iterations
% statical behaviour with bound and larger population
options = optimoptions ('ga')
%changing population size to 400
options = optimoptions (options,'populationsize',400);

tic
for i = 1:num_cases
    %setting bounded inputs with modified population size in genetic algorithm function
    [inputs,fopt(i)] = ga(@stalagmite,2,[],[],[],[],[0;0],[0.6;0.6],[],[],options);
    xopt(i) = inputs(1);
    yopt(i) = inputs(2);
end
study3_time = toc
figure(3)
subplot(2,1,1)
hold on
surfc(x,y,-f)
shading interp
plot3(xopt,yopt,-fopt,'marker','o','markersize',5,'markerfacecolor','r')
title('Bounded inputs with modified population size')
subplot(2,1,2)
plot(-fopt)
xlabel ('Iteraction')
ylabel ('Function maximum')
Now in this above code i have first clearing workspace and defining search space and number of iterations. and creating two dimentional mesh of search space. now evaluating the stalagmite function for surface plot. for each iteration, using ga function to calculate the maximum value. plotting the stalagmite function and maximum values.
the resultant plots are discuss in the below with figure.
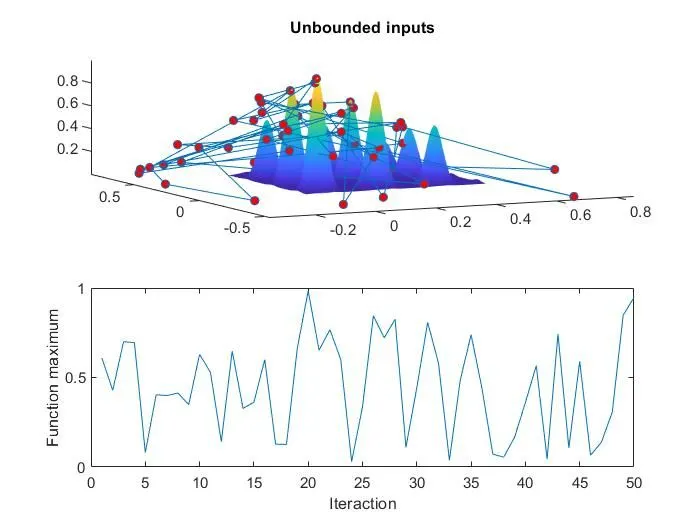
now in first case calling the function for the unbounded values and we get the result as aboe figure.here in the result the optimum value keeps changing and is randmised with no scope of converging. Hence, this approch is wrong.
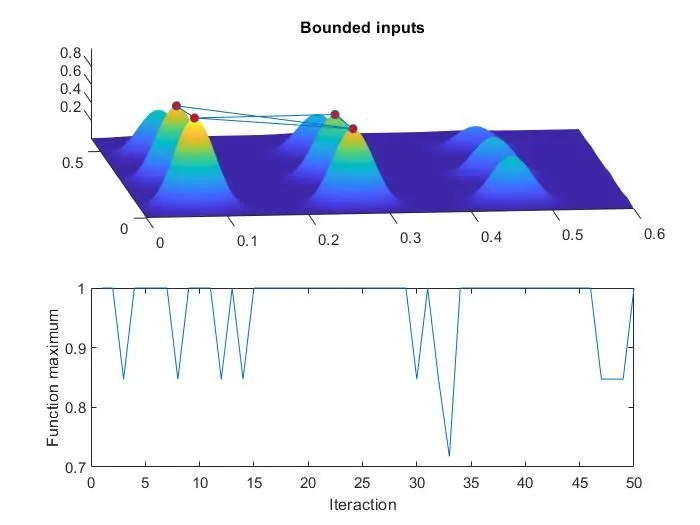
after second case evalution the result shown in above figure. in the second case calling the function for bounded values. in which as a result the optimum values keeps switching between two values but is structured. Hence, this approach is right but can be improved.
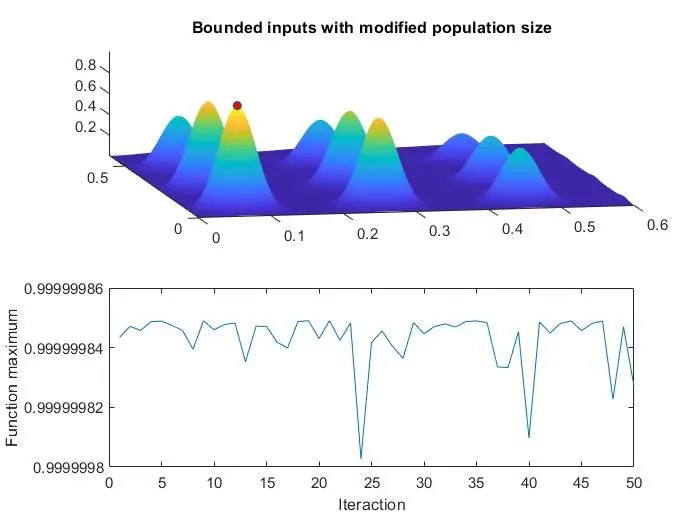
when evaluate the third case the resultant figure as shown in above figure. in the third case calling function for the bounded inputs with increasing in population size. here in third case the optimum value is constant with negligible error. hence, this approach is right and gives the correct answer.
Thus the maximum value of the stalagmite function under search space is approximately equal 1.
References:
https://www.educba.com/what-is-genetic-algorithm/
https://en.wikipedia.org/wiki/Genetic_algorithm
https://in.mathworks.com/help/gads/ga.html
and youtube videos.
Errors facing while during the code run:
some typo mistakes and space error while using the code population size. and typing error faceing when using the stalagmite function.